Statistical Analysis of Bitcoin and Stocks: ECON 1030

Verified

Added on  2023/03/20

|19
|2110
|73
Report
AI Summary
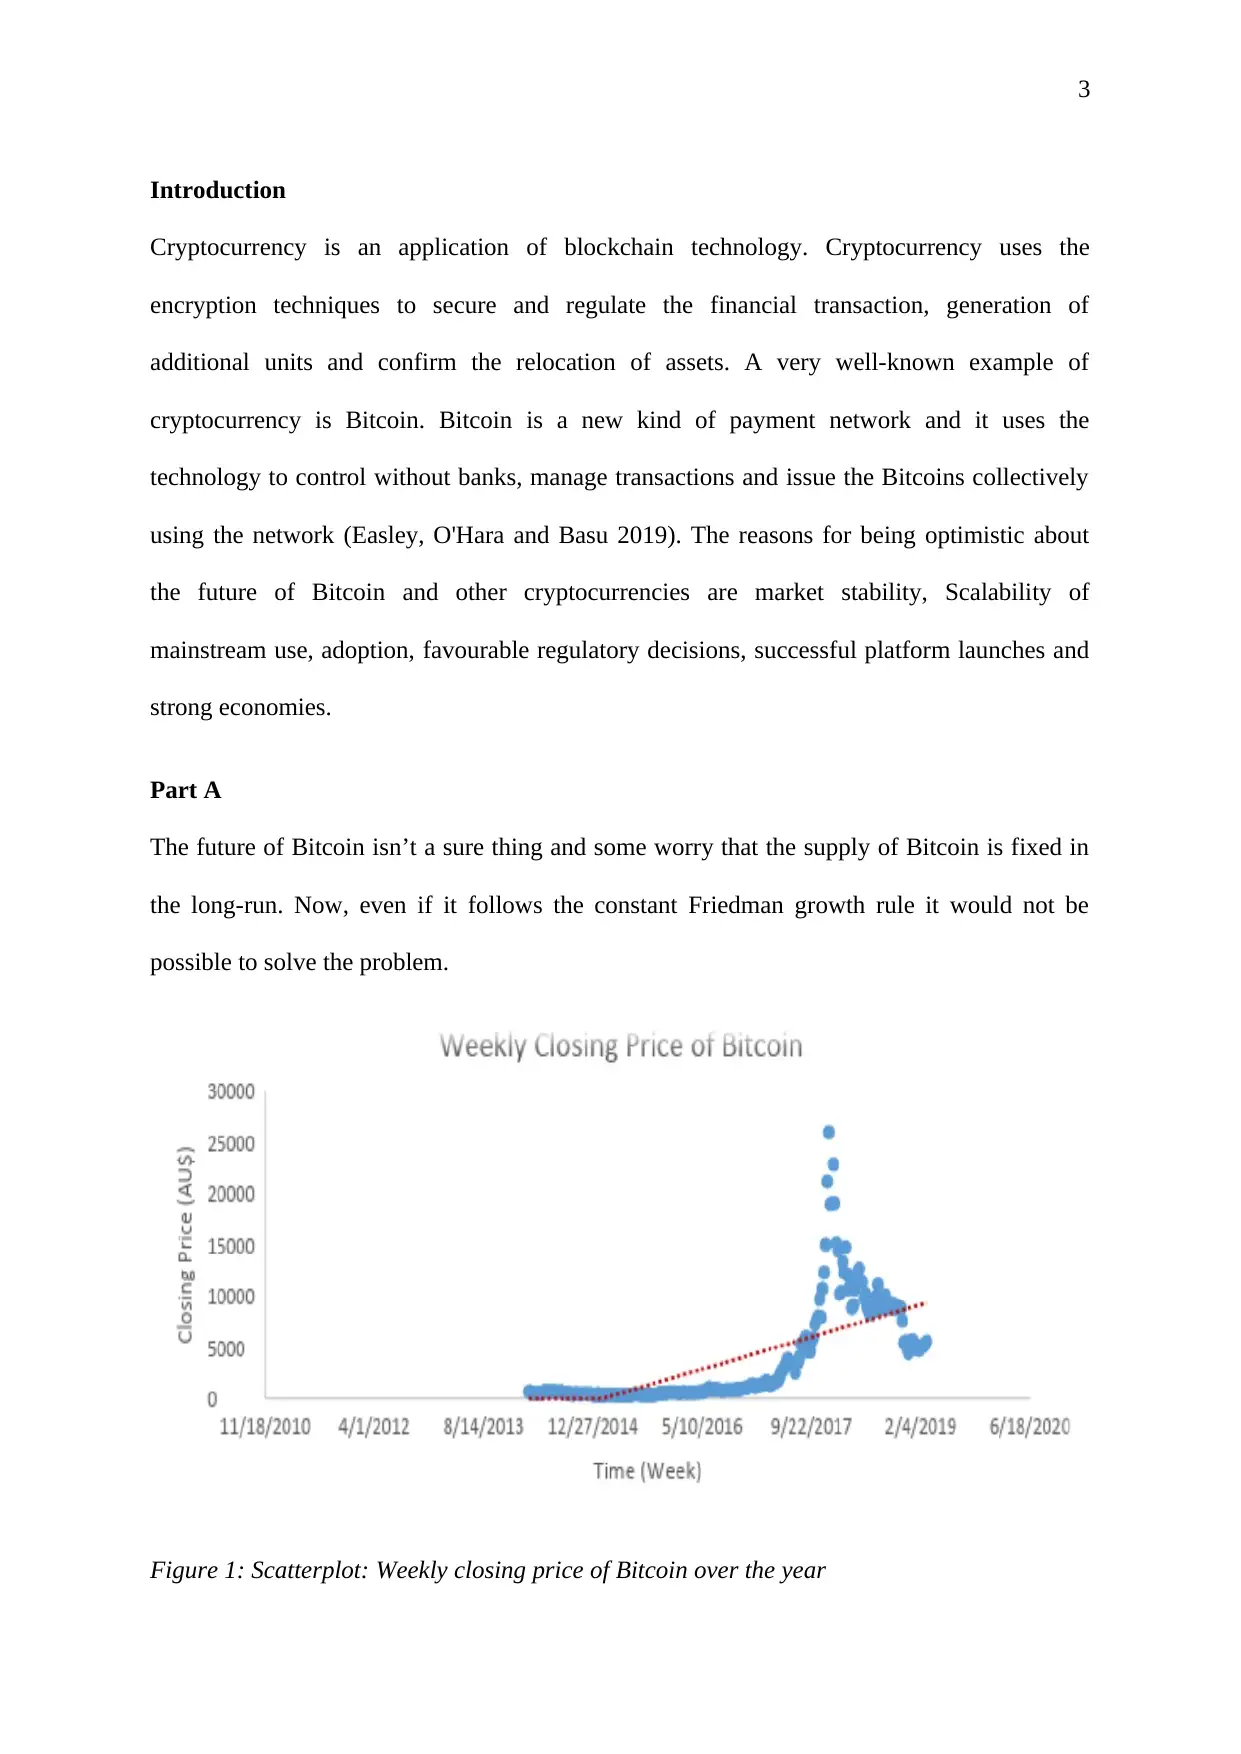
This report provides a comprehensive statistical analysis of Bitcoin as an investment, comparing its performance with other stocks like NAB, Wesfarmers, and Woodside. The analysis includes scatterplots and histograms to visualize weekly closing prices and returns, alongside descriptive statistics such as mean, standard deviation, skewness, and kurtosis. The report calculates confidence intervals for returns and conducts hypothesis tests to assess the validity of an investment advisor's claims regarding Bitcoin's return and the returns of other shares. The findings suggest that the statistical data does not support investment in Bitcoins due to low returns and high volatility, while the analysis of other stocks provides contrasting insights. The report also addresses the limitations of the data, such as non-normal distributions and trend deviations, which may impact the investment decisions. The appendices include detailed calculations of confidence intervals and interpretations of the results.
Document Page
0
Business Statistics
Assessment 2: Individual/Group Assessment
With Dr Pratima Srivastava
ECON 1030
Created by
- Suleman Gjoshi
S3668296 - Michael Ross Zappia
- Mrityunjay Kumar
tabler-icon-diamond-filled.svg

Secure Best Marks with AI Grader

Need help grading? Try our AI Grader for instant feedback on your assignments.
Document Page
1
Table of Contents
Executive Summary...................................................................................................................2
Introduction................................................................................................................................3
Part A.........................................................................................................................................3
Conclusion................................................................................................................................11
Reference..................................................................................................................................12
Appendices...............................................................................................................................13
Document Page
2
Executive Summary
Bitcoin is a payment network which is a very well-known as a cryptocurrency that uses the
blockchain technology. It is considered a secure, global and digital currency that could
represent the future of finance; however, some people are not so optimistic about it.
Statistical analysis is needed to judge whether it is recommendable or not to invest in Bitcoin.
Data on the closing price and the return of Bitcoin on a weekly basis can be used to get the
best results from the analysis. The trend and the statistics can suggest the better option
between investing and not investing on Bitcoins.
Document Page
3
Introduction
Cryptocurrency is an application of blockchain technology. Cryptocurrency uses the
encryption techniques to secure and regulate the financial transaction, generation of
additional units and confirm the relocation of assets. A very well-known example of
cryptocurrency is Bitcoin. Bitcoin is a new kind of payment network and it uses the
technology to control without banks, manage transactions and issue the Bitcoins collectively
using the network (Easley, O'Hara and Basu 2019). The reasons for being optimistic about
the future of Bitcoin and other cryptocurrencies are market stability, Scalability of
mainstream use, adoption, favourable regulatory decisions, successful platform launches and
strong economies.
Part A
The future of Bitcoin isn’t a sure thing and some worry that the supply of Bitcoin is fixed in
the long-run. Now, even if it follows the constant Friedman growth rule it would not be
possible to solve the problem.
Figure 1: Scatterplot: Weekly closing price of Bitcoin over the year
tabler-icon-diamond-filled.svg

Secure Best Marks with AI Grader

Need help grading? Try our AI Grader for instant feedback on your assignments.
Document Page
4
The above figure is a scatter diagram presenting the weekly closing price of the Bitcoin. The
scatter diagram is helpful to determine the relationship between two variables. To do so, it
presents the dependent variable on the vertical axis and the independent variable on the
horizontal axis. Then it presents the data of the dependent variable against each value of the
independent variable. In the figure above the closing price of Bitcoin is presented on the
vertical axis and the dots are presenting the closing price of Bitcoin against each week from
2014 to 2019. A trend line is presented which does not match with the scatter diagram of
close price of Bitcoins. Therefore, it can be said that the price does not follow the trend line
(Güçlü 2018).
Figure 2: Histogram: Weekly return on Bitcoin over the year
For normal distributions, the top point of bars of histogram makes a bell shape. But the above
figure does not appear as a bell-shaped and there are too many peaks that imply that the
closing price is not normally distributed. The peak and bottom values of the return on Bitcoin
Document Page
5
are the evidence of the outliers. There are several peaks and bottoms that are shown by the
longest bars of the histogram.
Return on Bitcoin
Mean 0.016
Standard Error 0.008
Median 0.012
Standard Deviation 0.126
Sample Variance 0.016
Kurtosis 3.006
Skewness 0.606
Range 1.054
Minimum -0.398
Maximum 0.657
Sum 4.124
Count 260
Table 1: Descriptive statistics of weekly return on Bitcoin
Three points of descriptive analysis (location, shape and spread) of the weekly return on
Bitcoin is presented by the above table 1. The location is presented by the mean value that
equals to 0.016% of the variable around which the closing prices are stabilized. The shape is
measured by the number of mode values, skewness and kurtosis. The distribution of weekly
return on Bitcoin is multimodal distribution. The value of skewness is positive which
indicates that the distribution is positively skewed that means most of the values are on the
right side of the median. Kurtosis is 3.006 that indicates that the tail of the distribution is
normal. The spread of a data set is described by the standard deviation of the data (Chambers
2017). The standard deviation of the weekly closing price is 0.126 that the return on Bitcoin
varies between -0.11 and 0.142. The higher the value of SD, the higher the spread is. The
probability of loss in inviting on Bitcoins is (114/260) or 43.85%.
Document Page
6
Figure 3: Scatterplot: Weekly closing price of NAB over the year
The scatter diagram almost follows the trend line from the year 2013 to 2019 but there exist
some values above and below the trend line.
Figure 4: Scatterplot: Weekly return on NAB over the year
tabler-icon-diamond-filled.svg

Paraphrase This Document

Need a fresh take? Get an instant paraphrase of this document with our AI Paraphraser
Document Page
7
The return on NAB is not normally distributed. There are several peaks and bottoms that are
shown by the longest bars of the histogram that are the evidence of outliers.
Return on NAB
Mean -0.001
Standard Error 0.002
Median 0.001
Mode 0.000
Standard Deviation 0.028
Sample Variance 0.001
Kurtosis 0.742
Skewness -0.186
Range 0.179
Minimum -0.088
Maximum 0.091
Sum -0.152
Count 260
Table 2: Descriptive statistics of weekly return on NAB
The mean value of the return is -0.001%. The value of skewness is negative which means
most of the values are on the left side of the median. Kurtosis is 0.742 that indicates that the
tail of the distribution is much lower than a normal tail. The standard deviation of the weekly
return on NBA is 0.028 that the closing price varies between -0.029 and 0.027. The lower the
value of SD, the lower the spread is.
The probability of loss in inviting on NAB is (126/260) or 48.46%.
Document Page
8
Figure 5: Scatterplot: Weekly closing price of Wesfarmers over the year
The scatter diagram almost follows the trend line from the year 2013 to 2019. In this case, it
is evident that the closing price of the Wesfarmers follows a positive trend line.
Figure 6: Weekly return on Wesfarmers over the year
Document Page
9
The return on Wesfarmers is not normally distributed. There are several peaks and bottoms
that are shown by the longest bars of the histogram that are the evidence of outliers.
Return on Wesfarmers
Mean 0.001
Standard Error 0.002
Median 0.002
Standard Deviation 0.024
Sample Variance 0.001
Kurtosis 0.907
Skewness -0.441
Range 0.157
Minimum -0.086
Maximum 0.070
Sum 0.206
Count 260
Table 3: Descriptive statistics of weekly return on Wesfarmers
The mean value of the return is 0.001 %. The value of skewness is negative which means
most of the values are on the left side of the median. Kurtosis is 0.907 that indicates that the
tail of the distribution is lower than a normal tail. The standard deviation of the weekly return
on NBA is 0.024 that means the closing price varies between -0.023 and 0.025.
The probability of loss in inviting on Wesfarmers is (119/260) or 45.77%.
tabler-icon-diamond-filled.svg

Secure Best Marks with AI Grader

Need help grading? Try our AI Grader for instant feedback on your assignments.
Document Page
10
Figure 7: Scatterplot: Weekly closing price of Woodside over the year
The scatter diagram does not follow the trend line from the year 2013 to 2019.
Figure 8: Weekly return on Woodside over the year
Document Page
11
The return on Woodside is not normally distributed. There is a huge number of peaks and
bottoms that are shown by the longest bars of the histogram that are the evidence of outliers.
Return on Woodside
Mean 0.000
Standard Error 0.002
Median 0.002
Standard Deviation 0.031
Sample Variance 0.001
Kurtosis 0.629
Skewness -0.058
Range 0.187
Minimum -0.083
Maximum 0.104
Sum 0.060
Count 260
Table 1: Descriptive statistics of weekly return on Woodside
The mean value of the return is 0.000 %. The value of skewness is negative which means
most of the values are on the left side of the median. Kurtosis is 0.629 that indicates that the
tail of the distribution is lower than a normal tail. The standard deviation of the weekly return
on NBA is 0.031 meaning the spread is very low.
The probability of loss in attractive on Woodside is (124/260) or 47.69%.
Conclusion
The above analysis shows that the return on Bitcoin is .016% which is very low, and the
spread is 0.126 which is also very low. This means the statistics do not support the
investment in Bitcoins. However, the data on return is not normally distributed and the
closing price not following the trend line indicates the fluctuation of the closing price. These
are not good indicators for investing in Bitcoin (Lim 2015). The advisor is correct as the
mean return of NAB, Wesfarmers & Woodside are all no different from zero, and however,
the investment advisor is wrong because the return of Bitcoin is not 4%.
Document Page
12
Reference
Chambers, J.M., 2017. Graphical Methods for Data Analysis: 0. Chapman and Hall/CRC.
Easley, D., O'Hara, M. and Basu, S., 2019. From mining to markets: The evolution of bitcoin
transaction fees. Journal of Financial Economics.
Güçlü, Y.S., 2018. Multiple Şen-innovative trend analyses and partial Mann-Kendall
test. Journal of Hydrology, 566, pp.685-704.
Lim, K.G., 2015. Financial valuation and econometrics.
tabler-icon-diamond-filled.svg

Paraphrase This Document

Need a fresh take? Get an instant paraphrase of this document with our AI Paraphraser
Document Page
13
Appendices
6. Construct a 95% confidence interval of the return to Bitcoin and interpret the interval.
How does your interval change if the level of confidence is 90% and 99% respectively, and
explain why? [Topics 6-7]
The expression = 0.016 +/- 1.96 * 0.126/ 260
= 0.006842 to 0.0313158 this is the confidence interval
When rounding 0.007 to 0.031
As we do not know μ, we will not be able to say the confidence interval that we calculated
0.007 to 0.031 will contain μ or not. From what we have learnt we know that the confidence
interval either does or does not contain μ. What we do know is that 95% of the confidence
intervals will contain μ even if we do not know the value of μ.
With a change in the confidence level e.g.90%, the interval would be the narrower meaning
we are less confident of the interval containing the true value. And with a higher confidence
level e.g. 99%, the interval will be wider which means we can be more confident of catching
the true value within the interval.
For example:
90% Confidence interval is 0.003146 to 0.028854 the difference is 0.025708
95% Confidence interval is 0.000684 to 0.031316 the difference is 0.030632
From the above example we can see that when the confidence interval is increased from 90%
to 95%, the confidence interval has become wider.
The reason for the change is because the bigger the confidence level is, the wider the interval
will be.
7. Construct a 95% confidence interval of the return to NAB, Wesfarmers, and
Woodside respectively. [Topics 6-7]
95% confidence interval of the return on NAB
The expression = -0.001 +/- 1.96 * 0.028/ 260
= -0.004403 to 0.002403 this is the confidence interval
When rounded -0.004 to 0.002
95% confidence interval of the return on Wesfarmers
The expression = 0.001 +/- 1.96 * 0.024/ 260
= 0.001917 to 0.003917 this is the confidence interval
Document Page
14
When rounded0.002 to 0.004
95% confidence interval of the return on Woodside
The expression = 0.000 +/- 1.96 * 0.031/ 260
= -0.003768 to 0.003768 this is the confidence interval
When rounded -0.004 to 0.004
8. An investment advisor claimed that the return to Bitcoin is 4% while the returns to
other three shares are no different from zero. Do you agree? Justify your reasoning using a
two-tailed hypothesis test approach at the significance level of 5%. [Topic 8]
Bitcoin
Document Page
15
NAB
Wesfarmers
tabler-icon-diamond-filled.svg

Secure Best Marks with AI Grader

Need help grading? Try our AI Grader for instant feedback on your assignments.
Document Page
16
Woodside Energy
Document Page
17
Document Page
18
chevron_up_icon
1 out of 19
circle_padding
hide_on_mobile
zoom_out_icon
logo.png

Your All-in-One AI-Powered Toolkit for Academic Success.

Available 24*7 on WhatsApp / Email

[object Object]