Comprehensive Statistical Analysis of Car Prices Using Excel
VerifiedAdded on 2023/04/12
|10
|721
|388
Homework Assignment
AI Summary
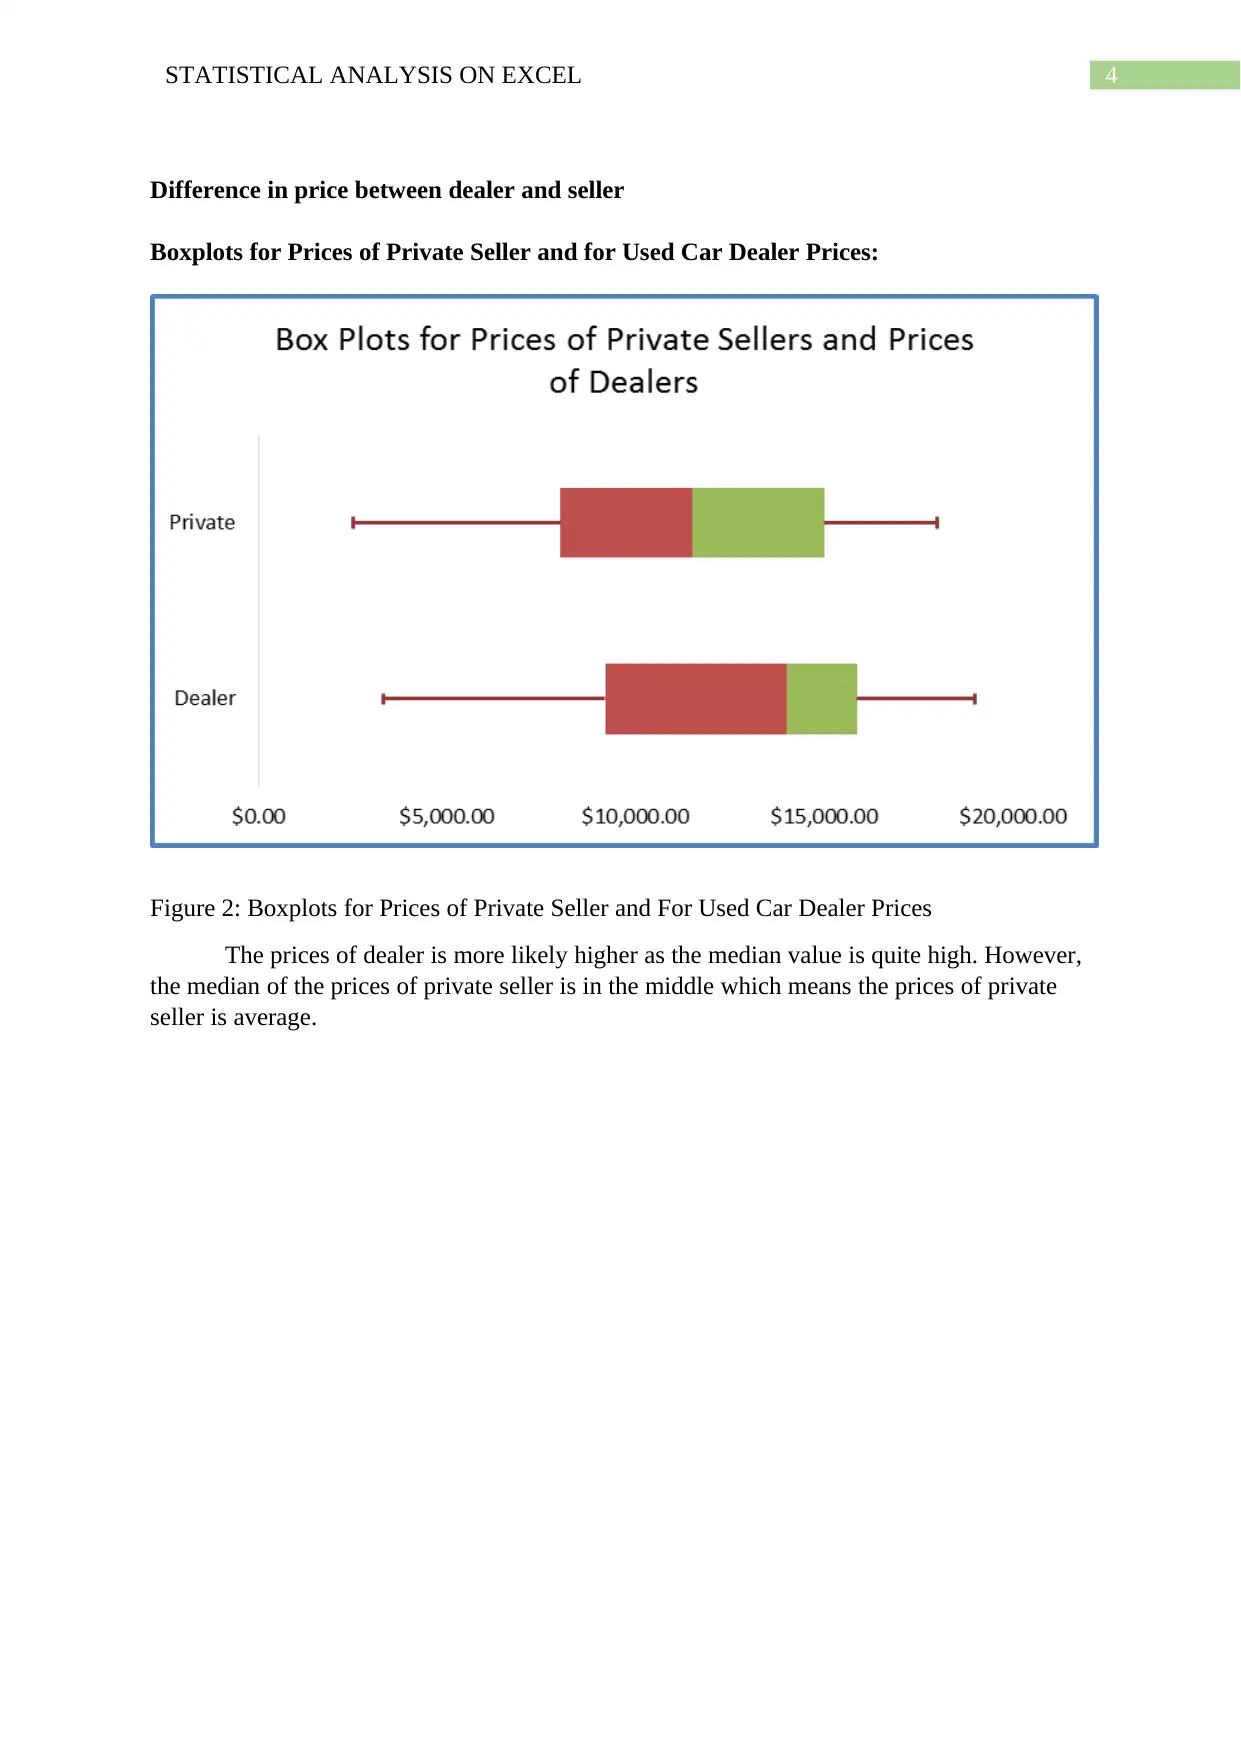
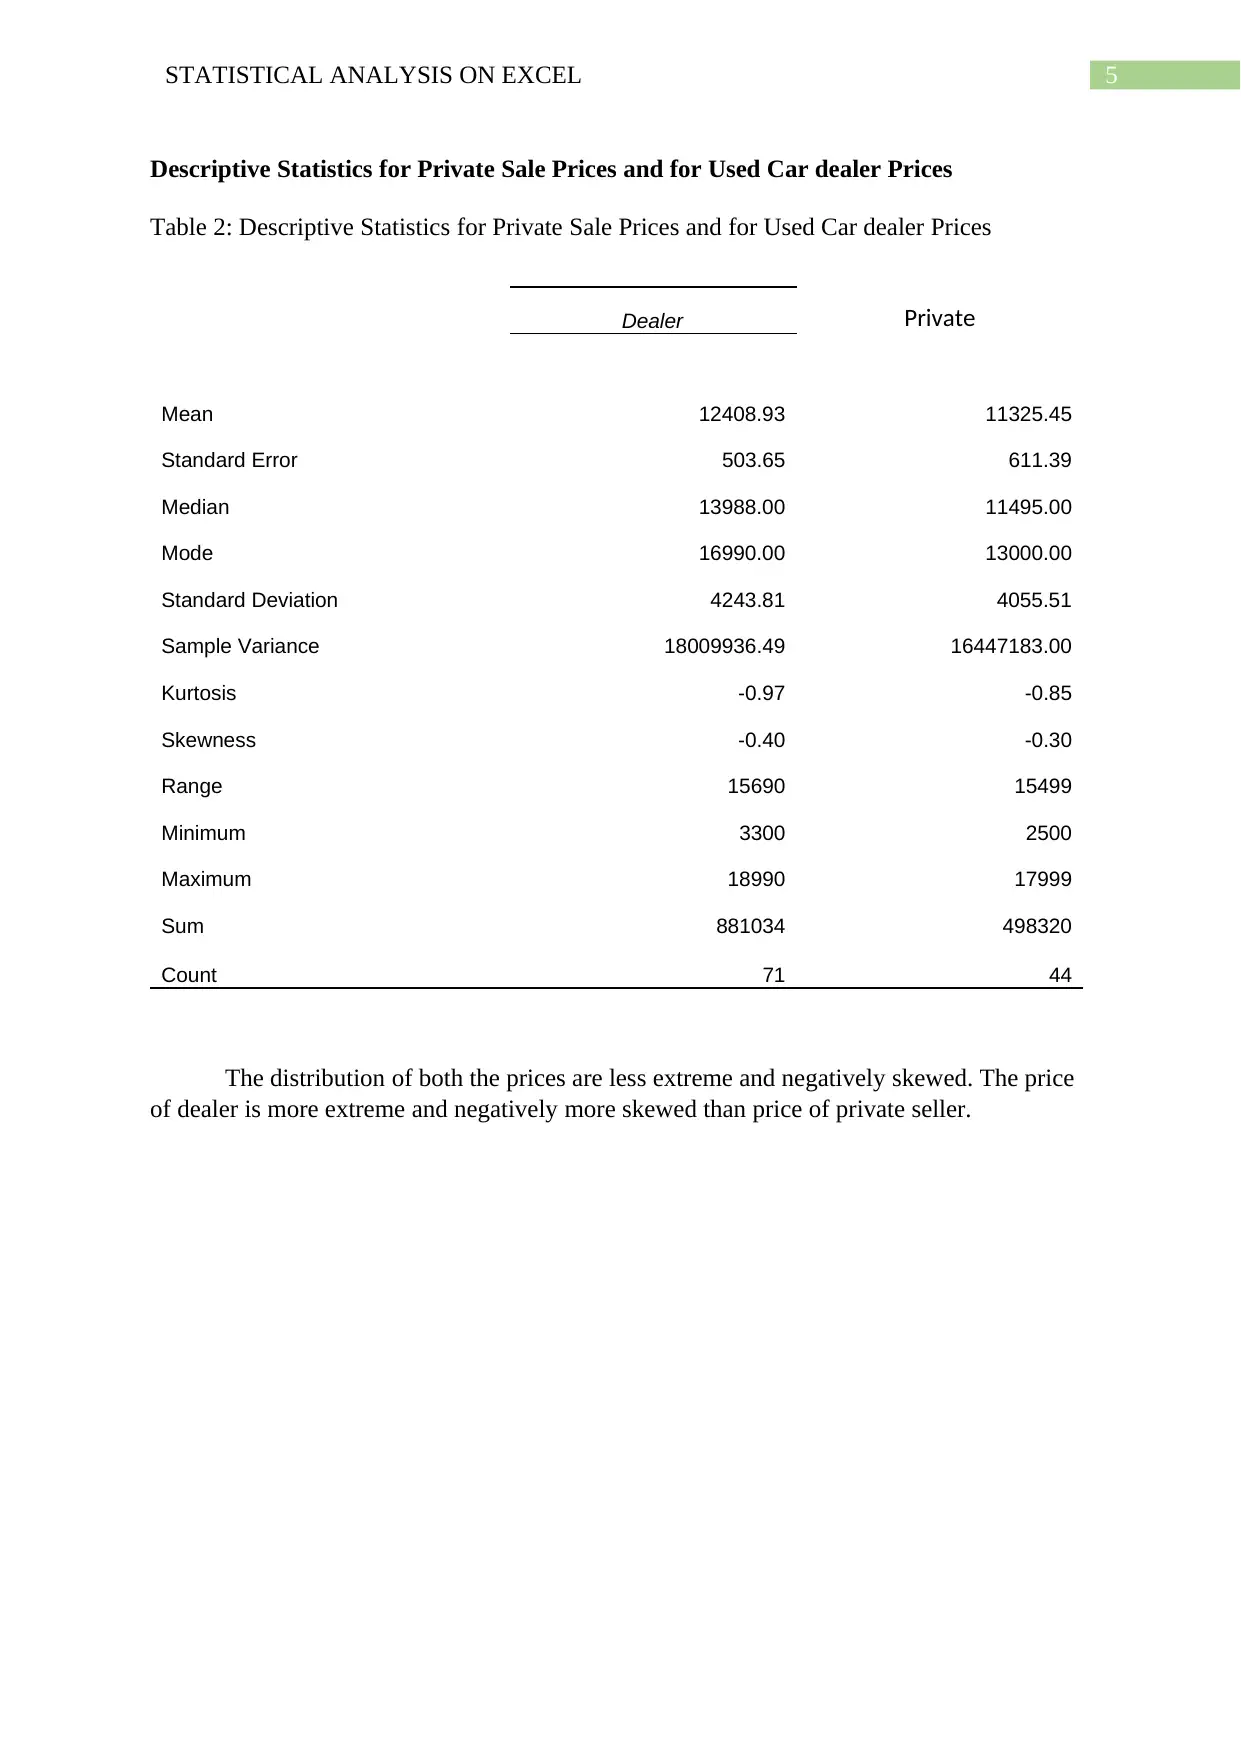
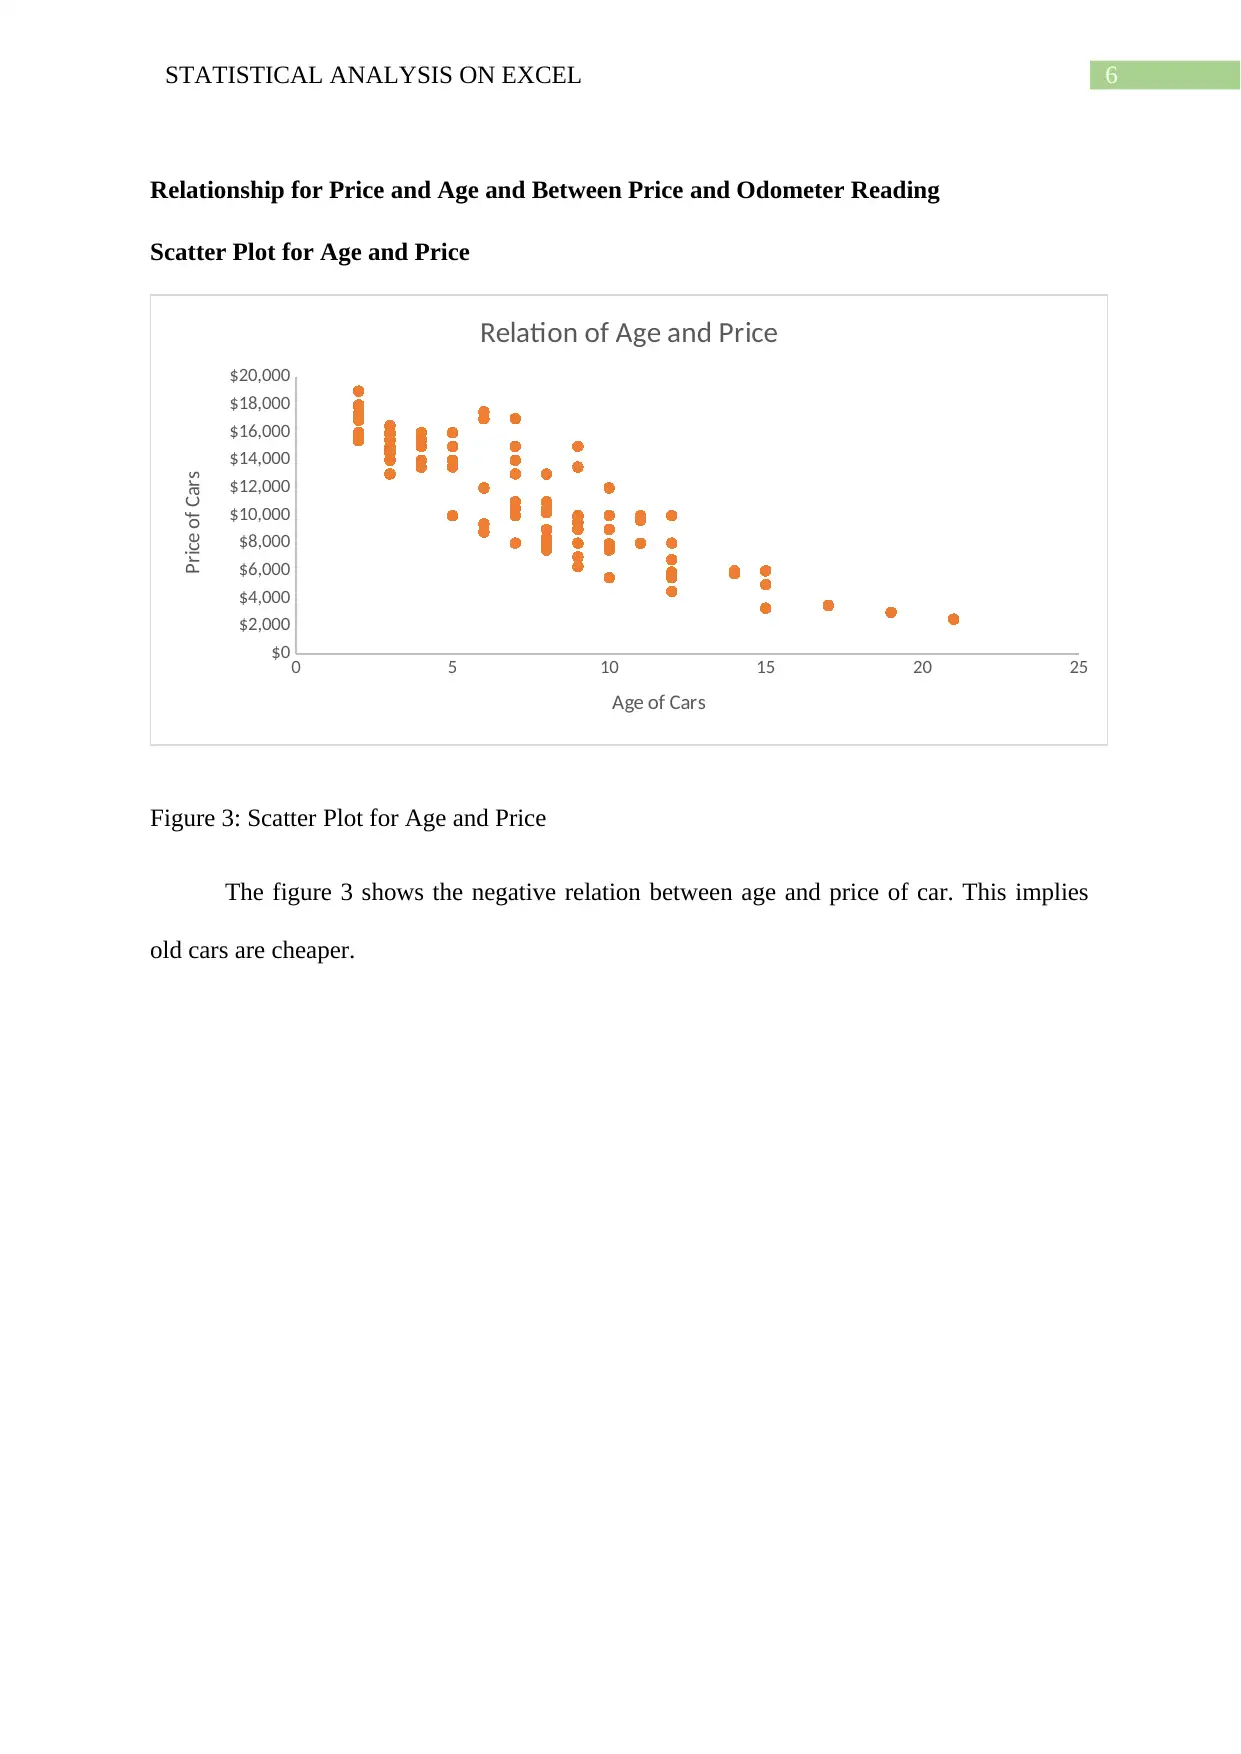
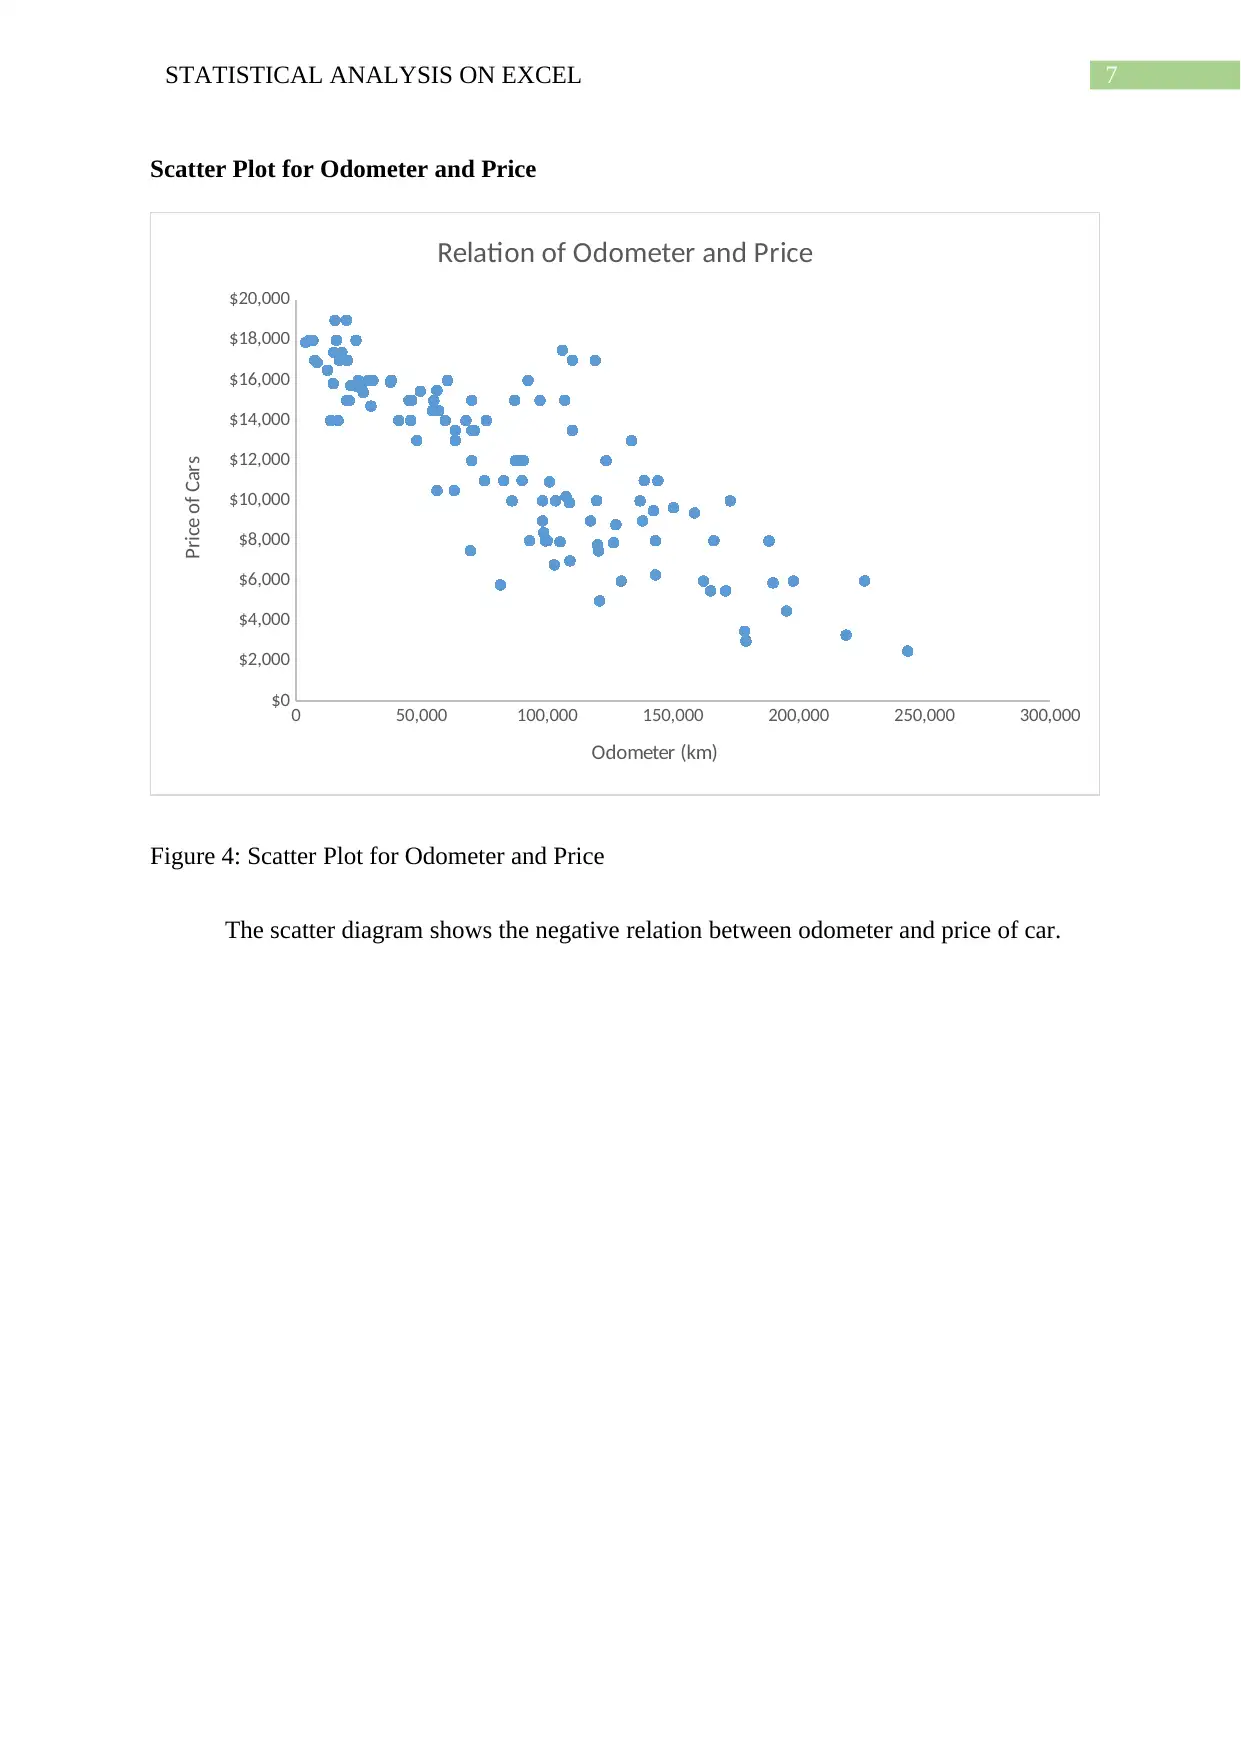
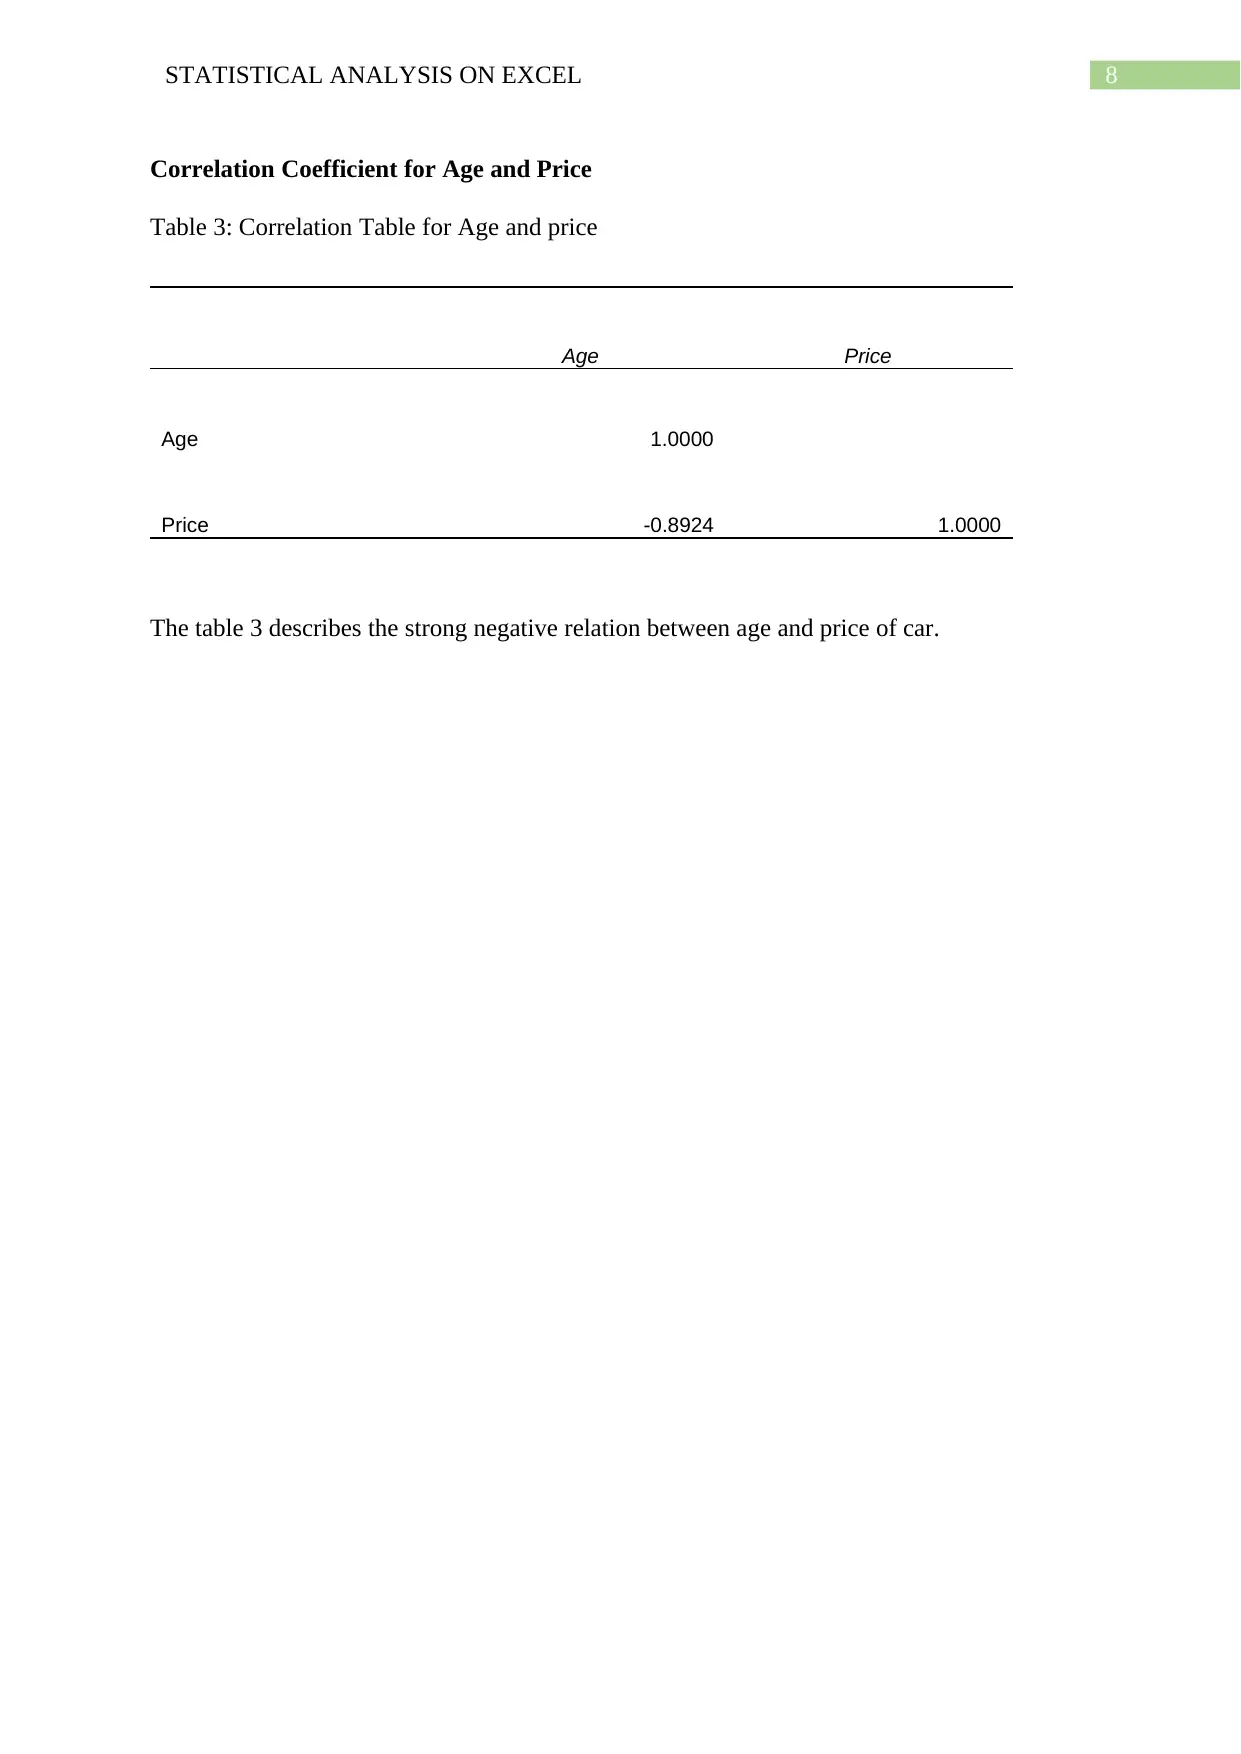
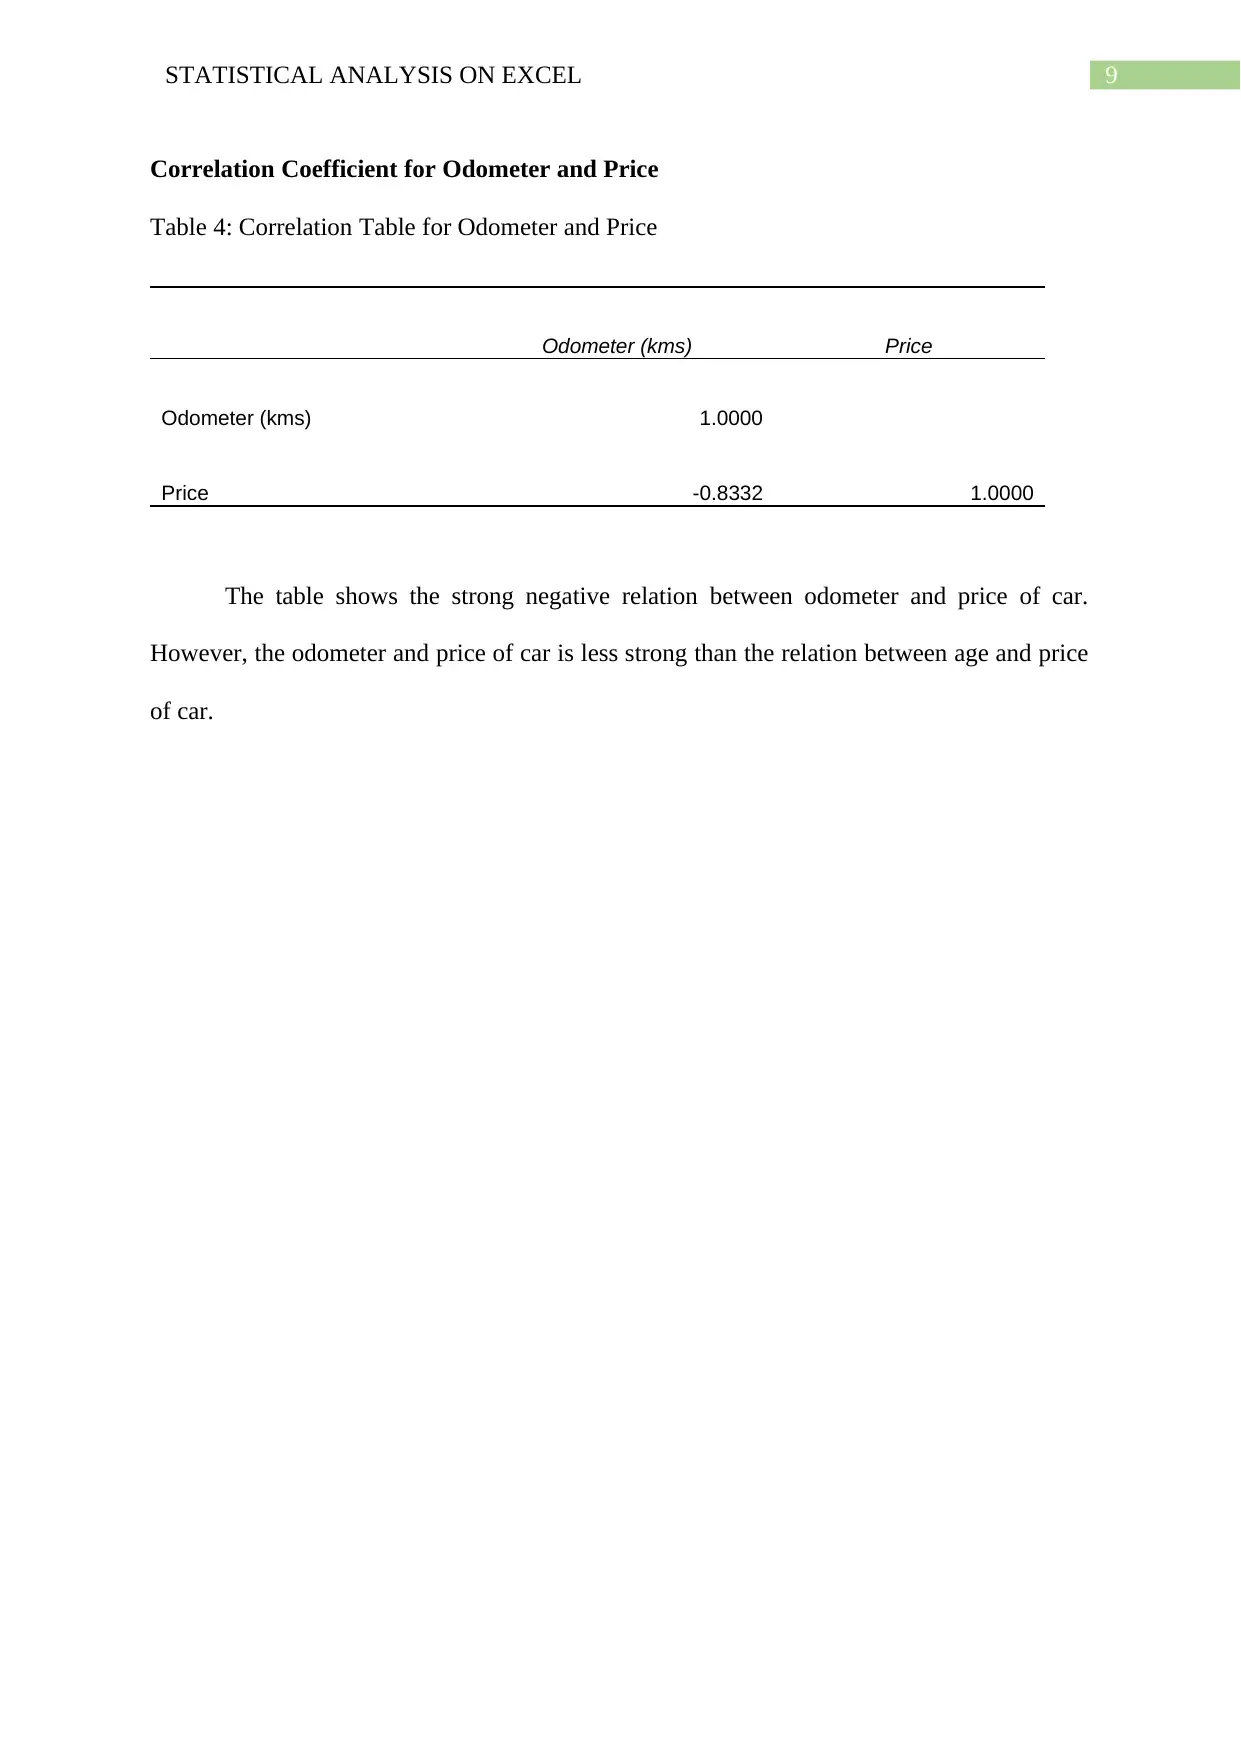
This assignment presents a comprehensive statistical analysis of car prices using Microsoft Excel. It begins with the construction of a frequency histogram to visualize the distribution of car prices, followed by the calculation of descriptive statistics such as mean, median, standard deviation, and skewness. The analysis then compares prices between two and three-year-old cars and investigates the difference between dealer and private seller prices using boxplots and further descriptive statistics. The core of the assignment explores the relationship between car price and age, as well as between price and odometer readings, through scatter plots and correlation coefficients. The findings reveal a negative correlation between price and both age and odometer readings, indicating that older cars and cars with higher mileage tend to have lower prices. The analysis provides valuable insights into the factors influencing car prices and demonstrates the application of statistical methods in real-world scenarios. This document is a solution contributed by a student and is available on Desklib, a platform offering AI-based study tools for students.
1 out of 10


Your All-in-One AI-Powered Toolkit for Academic Success.
+13062052269
info@desklib.com
Available 24*7 on WhatsApp / Email
![[object Object]](/_next/static/media/star-bottom.7253800d.svg)
Copyright © 2020–2026 A2Z Services. All Rights Reserved. Developed and managed by ZUCOL.