Statistical Analysis: Chi-Square Tests on Recoded Variables

Verified

Added on  2022/12/23

|5
|912
|35
Homework Assignment
AI Summary
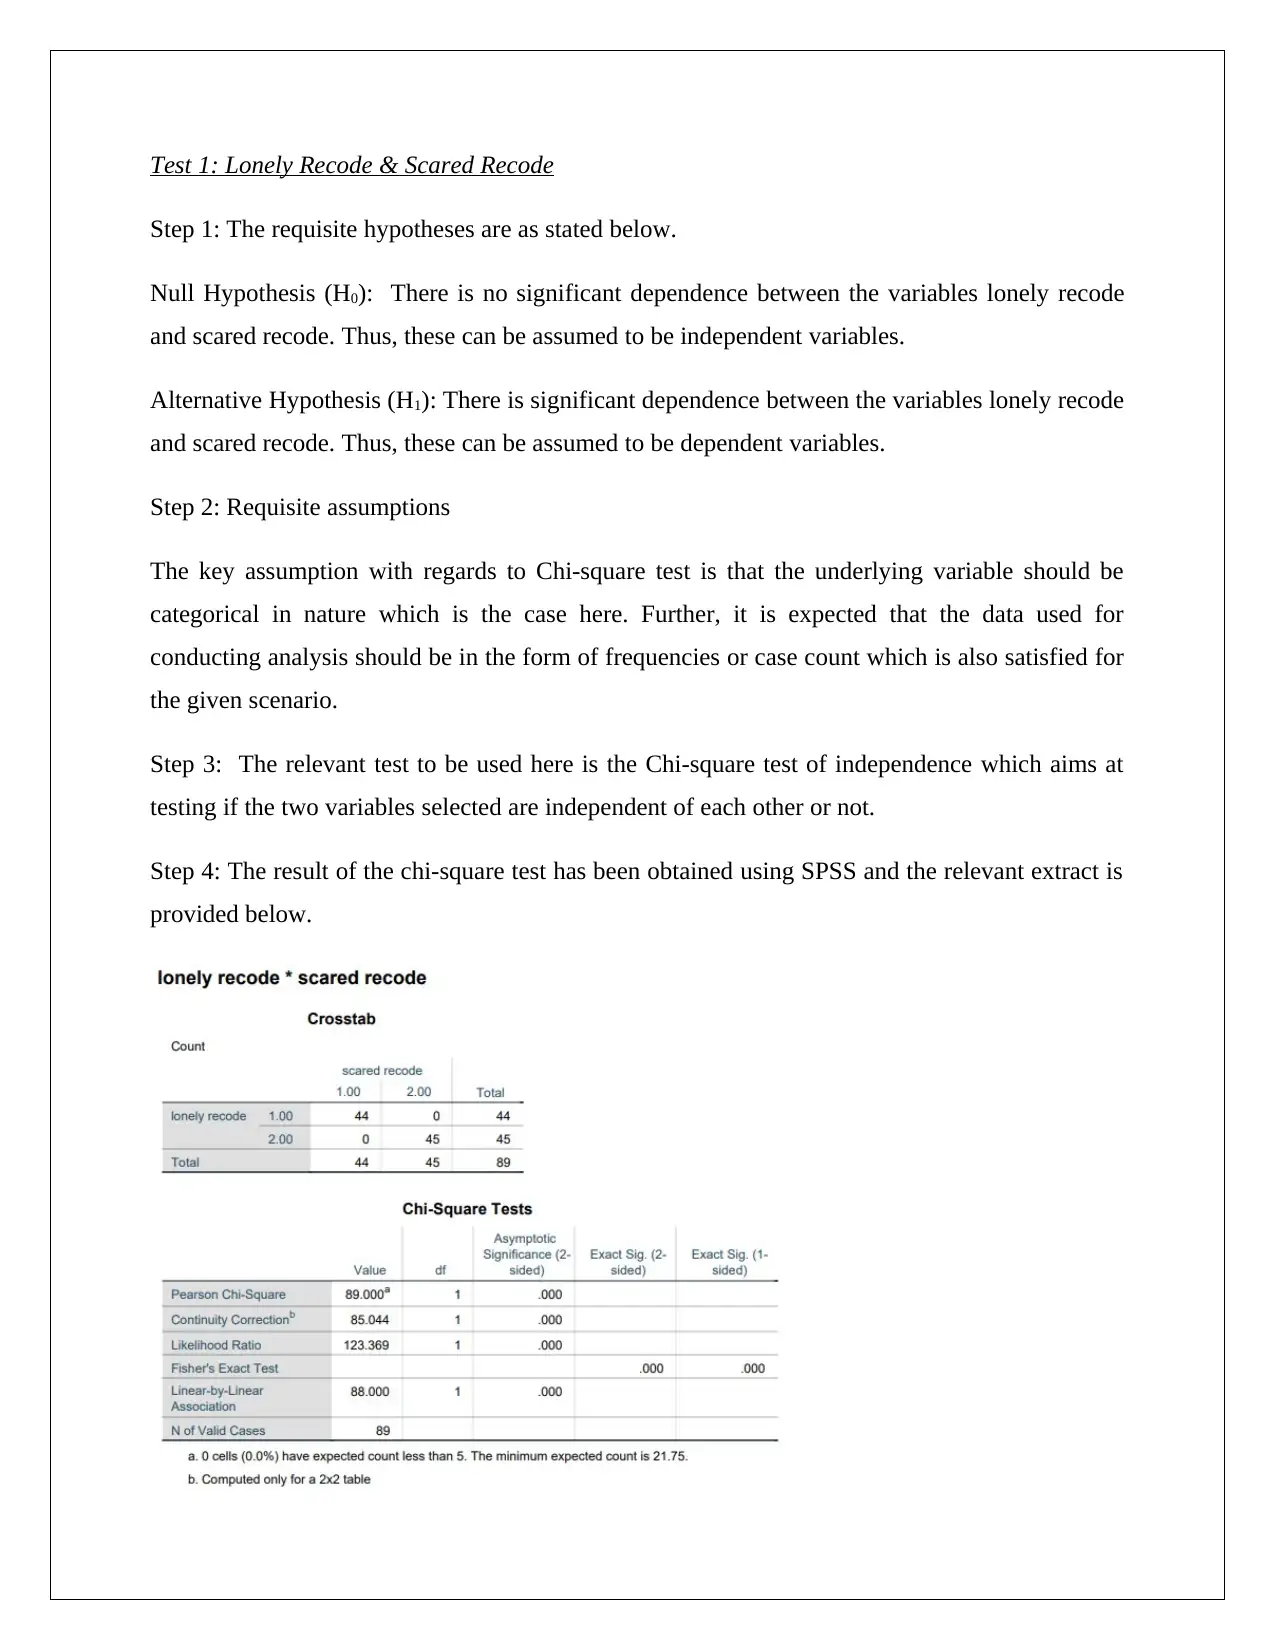
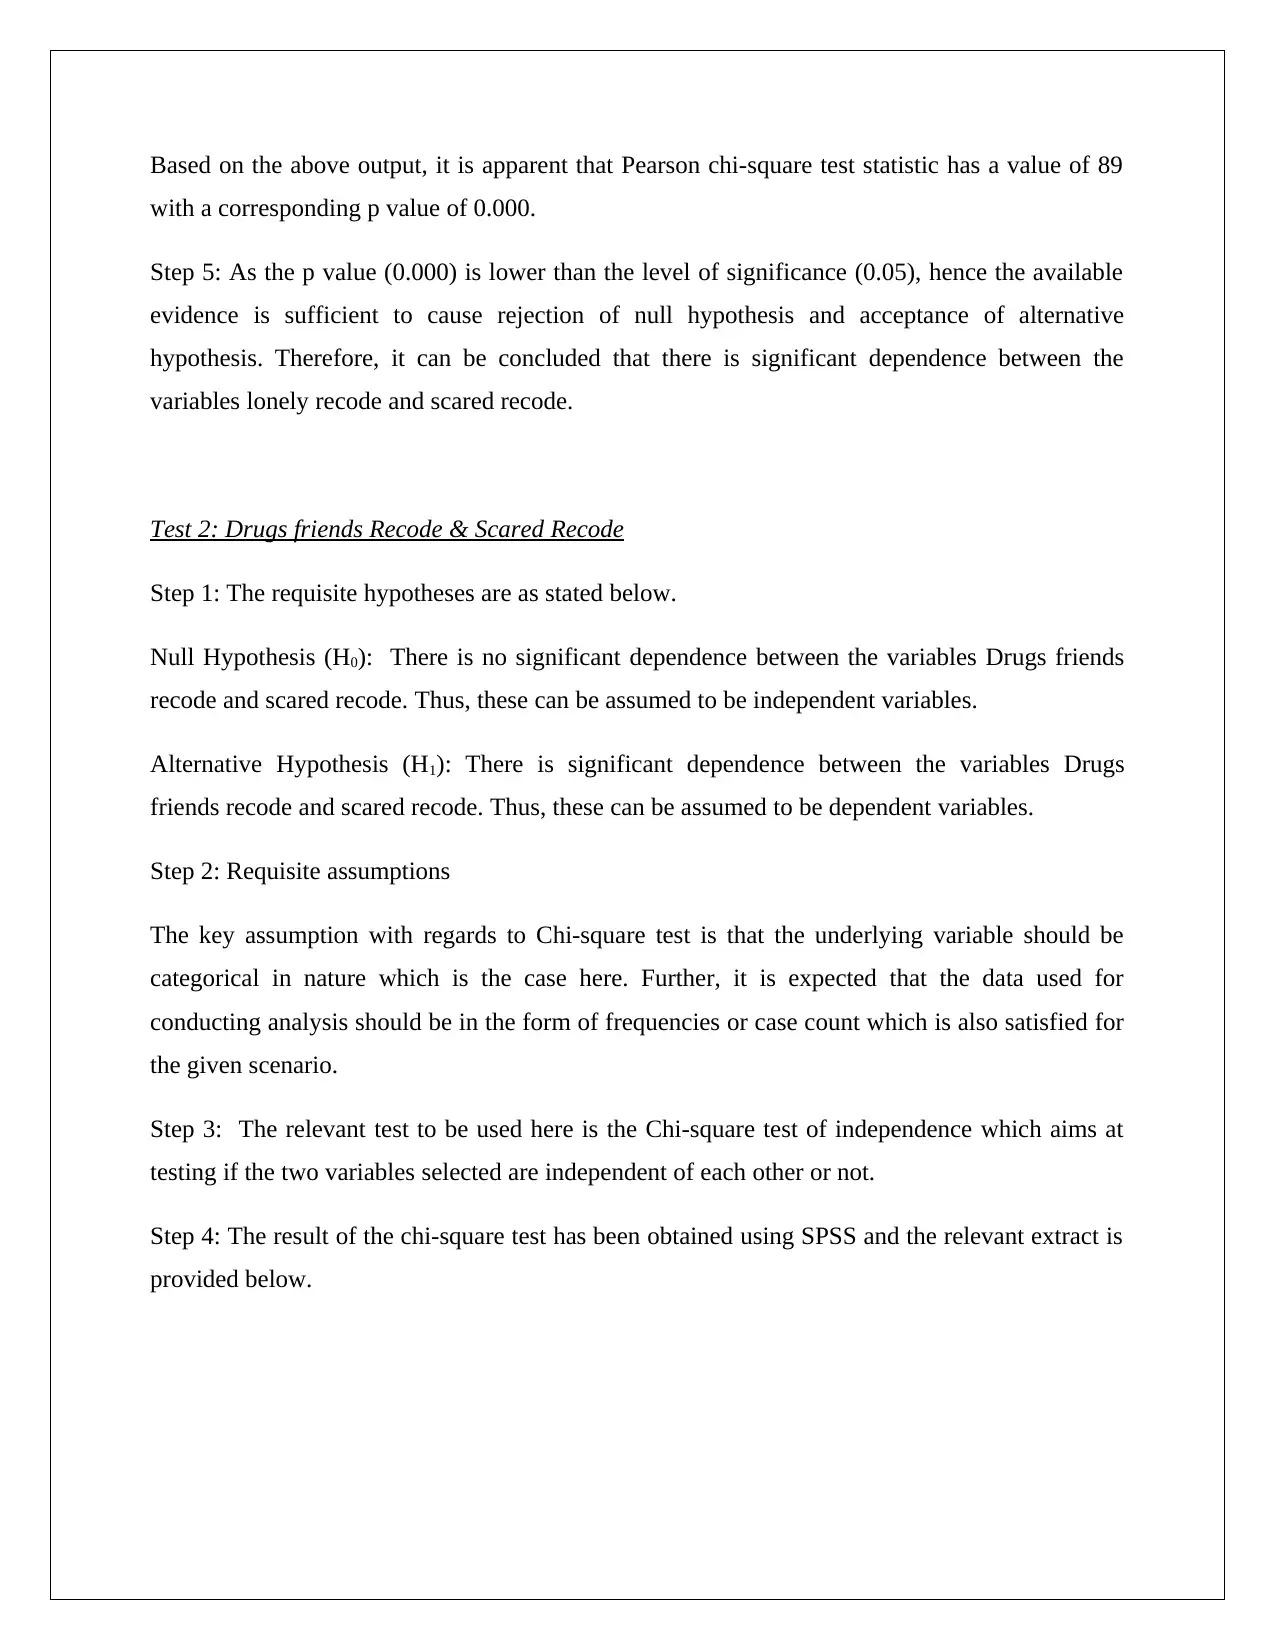
This assignment presents a Chi-square test analysis based on a given dataset and recoded variables. The solution involves conducting Chi-square tests of independence to determine the relationship between several pairs of categorical variables, including 'lonely recode' and 'scared recode', and 'drugs friends recode' and 'scared recode'. The analysis includes formulating null and alternative hypotheses, checking assumptions, selecting the appropriate test, and interpreting the results obtained from SPSS output, including p-values. The assignment also addresses a scenario where the test statistic cannot be computed due to a constant variable. The student concludes by either rejecting or failing to reject the null hypothesis based on the p-value and the level of significance, thereby determining whether the variables are independent or dependent. The assignment adheres to the provided problem/assignment brief, which includes variable recoding and frequency table generation.
Document Page
STATISTICS
CHI-SQUARE
STUDENT ID:
[Pick the date]
1
tabler-icon-diamond-filled.svg

Paraphrase This Document

Need a fresh take? Get an instant paraphrase of this document with our AI Paraphraser
Document Page
Test 1: Lonely Recode & Scared Recode
Step 1: The requisite hypotheses are as stated below.
Null Hypothesis (H0): There is no significant dependence between the variables lonely recode
and scared recode. Thus, these can be assumed to be independent variables.
Alternative Hypothesis (H1): There is significant dependence between the variables lonely recode
and scared recode. Thus, these can be assumed to be dependent variables.
Step 2: Requisite assumptions
The key assumption with regards to Chi-square test is that the underlying variable should be
categorical in nature which is the case here. Further, it is expected that the data used for
conducting analysis should be in the form of frequencies or case count which is also satisfied for
the given scenario.
Step 3: The relevant test to be used here is the Chi-square test of independence which aims at
testing if the two variables selected are independent of each other or not.
Step 4: The result of the chi-square test has been obtained using SPSS and the relevant extract is
provided below.
Document Page
Based on the above output, it is apparent that Pearson chi-square test statistic has a value of 89
with a corresponding p value of 0.000.
Step 5: As the p value (0.000) is lower than the level of significance (0.05), hence the available
evidence is sufficient to cause rejection of null hypothesis and acceptance of alternative
hypothesis. Therefore, it can be concluded that there is significant dependence between the
variables lonely recode and scared recode.
Test 2: Drugs friends Recode & Scared Recode
Step 1: The requisite hypotheses are as stated below.
Null Hypothesis (H0): There is no significant dependence between the variables Drugs friends
recode and scared recode. Thus, these can be assumed to be independent variables.
Alternative Hypothesis (H1): There is significant dependence between the variables Drugs
friends recode and scared recode. Thus, these can be assumed to be dependent variables.
Step 2: Requisite assumptions
The key assumption with regards to Chi-square test is that the underlying variable should be
categorical in nature which is the case here. Further, it is expected that the data used for
conducting analysis should be in the form of frequencies or case count which is also satisfied for
the given scenario.
Step 3: The relevant test to be used here is the Chi-square test of independence which aims at
testing if the two variables selected are independent of each other or not.
Step 4: The result of the chi-square test has been obtained using SPSS and the relevant extract is
provided below.
Document Page
Based on the above output, it is apparent that Pearson chi-square test statistic has a value of
4.449 with a corresponding p value of 0.035.
Step 5: As the p value (0.035) is lower than the level of significance (0.05), hence the available
evidence is sufficient to cause rejection of null hypothesis and acceptance of alternative
hypothesis. Therefore, it can be concluded that there is significant dependence between the
variables Drugs friends recode and scared recode.
Test 3: In past 6 months - coke: kept using even though it caused problems with family / others &
scared recode
Step 1: The requisite hypotheses are as stated below.
Null Hypothesis (H0): There is no significant dependence between the given variables and hence
these can be assumed to be independent variables.
Alternative Hypothesis (H1): There is significant dependence between the given variables and
hence these can be assumed to be dependent variables.
Step 2: Requisite assumptions
tabler-icon-diamond-filled.svg

Paraphrase This Document

Need a fresh take? Get an instant paraphrase of this document with our AI Paraphraser
Document Page
The key assumption with regards to Chi-square test is that the underlying variable should be
categorical in nature which is the case here. Further, it is expected that the data used for
conducting analysis should be in the form of frequencies or case count which is also satisfied for
the given scenario.
Step 3: The relevant test to be used here is the Chi-square test of independence which aims at
testing if the two variables selected are independent of each other or not.
Step 4: The result of the chi-square test has been obtained using SPSS and the relevant extract is
provided below.
From the above output, it is evident that the Pearson chi-square statistic cannot be computed as
one of the variables is constant and does not show any variation. As a result, the p value also
cannot be determined.
Step 5: No conclusion can be drawn as the test statistic cannot be computed for the given pair of
variables.
chevron_up_icon
1 out of 5
circle_padding
hide_on_mobile
zoom_out_icon
[object Object]