Statistical Concepts and Definitions with Examples
VerifiedAdded on 2021/06/17
|11
|1803
|23
Homework Assignment
AI Summary
This document presents a comprehensive solution to a statistics assignment, meticulously defining and illustrating key concepts. It begins with a fundamental understanding of statistical experiments, sample spaces, and the concept of estimators, including bias and consistency. The assignment then delves into probability, covering complements of events, conditional distributions, and the independence of events, along with composite and simple hypotheses. Furthermore, it explores measures of central tendency like mean and median, and dispersion such as covariance and mean square error. The solution also explains regression analysis, including ordinary least squares estimators, goodness of fit, and regression errors. Finally, it addresses hypothesis testing, including power of a test, p-values, significance levels, types of errors (I and II), and the trade-off between them. The assignment utilizes clear definitions, practical examples, and references to enhance understanding of these core statistical principles.

1
Statistical Concepts
Student Name: Student ID:
Unit Name: Unit ID:
Date Due: Professor Name:
Statistical Concepts
Student Name: Student ID:
Unit Name: Unit ID:
Date Due: Professor Name:
Secure Best Marks with AI Grader
Need help grading? Try our AI Grader for instant feedback on your assignments.

2
1. An experiment (give an example)
ANS: Experiment in statistical sense is an infinitely repeatable procedure where
outcomes are precisely defined. A collection of the outcomes is called the sample space.
Experiment with many outcomes is called a random experiment.
Example: Throwing of two coins is an experiment. The sample space for this experiment
is {HH, TT, HT, TH}, H stands for Head and T stands for Tail of a coin.
2. Bias of an estimator
ANS: Sample values are used to find the values of the statistic, which are mean and
standard deviation of the sample. These statistic estimates the population parameters
(mean and standard deviation of population) of the population. Bias of an estimator is the
error of the statistic in estimating the population parameter. For example, sample SD is a
biased estimator of population SD.
3. Complement of an event
ANS: Complement of an event is that part of an experiment which is not a part of that
event. Complement of an event is that part of the universal set which when combined
with the event forms the universal set. For example, in an experiment of tossing two
coins complement event of {HH} is {TT, HT, TH}.
4. Composite hypothesis
ANS: Composite hypothesis is that hypothesis where values of the parameters of the
population are not known for sure. In composite hypothesis the knowledge about the
values of the population parameters are not specific, but tentative in nature, that is, the

3
interval of the parameters is known. For example μ>64 is an interval estimate of the
population Mean, and the alternate hypothesis H A ( μ>64 ) is composite in nature.
5. Conditional distribution
ANS: Conditional probability distribution deals with a portion of the population but not
the entire population. If the entire population represents the students of the university,
then the conditional probability will be the study of history students (say) of the
university.
6. Consistent estimator
ANS: Consistent estimator is different from unbiased estimator. For a large sample it
becomes important that sample statistic not only estimates the population parameter in an
unbiased way, but also in a consistent way. This means that, for the sample size tending
to population size the sampling distribution, especially the population estimates should
tend to population parameters.
7. Covariance
ANS: covariance is the measure of variance of two variables, when measured together.
Effect of independent factor on the dependent factor, while both of them are varied
together is the covariance between the variables

4
8. Estimate
ANS: In statistical sense, estimate is the approximation of population parameters by
sample statistic. In hypothesis testing, probability distribution of the population is
assessed by the knowledge of sampling. This assessing power is known as estimation.
There are two types of estimation, point estimation and interval estimation.
9. Estimator
ANS: Sample statistic (mean or SD, for example), which can estimate or assess the
population parameters are called estimators.
10. Explained sum of squares
ANS: It is also known as MSS (model sum of squares) and is actually sum of squares of
the differences measured between mean value of a statistic and predicted value (using
appropriate probability distribution) of the statistic. In the regression analysis ESS
reflects the appropriateness of the model of regression.
11. Fitted value
ANS: Accuracy of a regression model is assessed through estimation of parameters. The
population parameters are estimated by predicting the estimator and the average values of
the statistic used for this purpose are called fitted values.
Secure Best Marks with AI Grader
Need help grading? Try our AI Grader for instant feedback on your assignments.

5
12. Inconsistent estimator
ANS: Inconsistent estimator is that sample statistic, which, for large sample size
generates error when estimating population parameters.
13. Independent events
ANS: Statistically independent events are those events, where occurrence of on event
does not influence the occurrence of other events. Statistically, if ‘A’ and ‘B’ are
independent events, then P ( A∩B ) =P ( A ) P ( B )
14. Intersection of events
ANS: Intersection of two events denotes the common portion of two events. This can be
well described by Venn-diagrammatic approach.
Figure 1: Venn diagram for A∩B
15. Mean and Median
ANS: Both are descriptive statistical values of a random variable. Mean represents
mathematical average whereas Median describes geometric middle position of a data set.

6
Mean is calculated by considering all the values of a given dataset whereas Median is the
middle most data and hence does not require all the values of the variable.
16. Mean square error
ANS: Mean square deviation or variance of a random variable is an important measure of
dispersion. Differences of all the data present in a data set are taken from the mean value.
The average of the square of the differences is taken. This is MSE or variance of a data
set.
17. Measure of goodness of fit
ANS: Goodness of fit is the measure of well-matched between the expected and observed
value of the sample. This statistical testing is measured by the adjusted R (correlation
coefficient) square, and the value represents the percentage of variation of the dependent
variable explained by the independent factors.
18. Median and Mode
ANS: Median is the geometrical measure of central tendency, which is the second quarter
of the data set, which marks the 50th percentile also. Mode is the data in the frequency
distribution with highest frequency. A data set may or may not possess a mode (if no
repetitive data are present) but always have a median.

7
19. Mutually exclusive events
ANS: Two events ‘A’ and ‘B’ are mutually exclusive if occurrence of event ‘A’ does
affect the occurrence of event ‘B’. Mathematically ‘A’ and ‘B’ are mutually exclusive
events if P ( A∩B ) =0 .
20. Ordinary Least Squares estimators
ANS: Linear regression method is used to design a predictive model for dependent factor.
The line of regression is constructed with lest square method by minimizing the
difference between observed and expected frequencies. This method is called ordinary
least square method (OLS) or OLS regression.
21. Power of a test
ANS: Power of a test is measured by the complementary probability of type II error,
which is α=1−Type−II error. Power of a test is proportional to level of significance of a
hypothesis, which reflects the probability of rejection of the null hypothesis.
22. p-value
ANS: The p-value of an independent factor in hypothesis testing is the probability of
rejection. Also known as level of significance, p-value reflects the size of the confidence
interval and critical region. If p-value less than 0.05 (for 5% level of significance) null
hypothesis gets rejected.
Paraphrase This Document
Need a fresh take? Get an instant paraphrase of this document with our AI Paraphraser

8
23. Regression error
ANS: Difference between the observed value and the predicted value in a linear
regression model is the regression error of the model. The error generated from the OLS
method of regression is the specifically the regression error of an independent factor.
24. Relative efficiency
ANS: Relative efficiency has different meaning in different situations. For two
estimators, relative efficiency is the ratio of their variances. It compares two population
or two samples.
25. Sample space
ANS: Sample space is the collection of all outcomes of an experiment. For example, in
tossing of two coins, sample space is S={HH , TT , HT ,TH } .
26. Significance level of a test
ANS: Significance level is the probability of rejection of null hypothesis. In testing of
hypothesis, population parameters are assessed by the sample statistic values. Now, this
estimate is done under a probability limit, which is called the level of confidence.
Significance is the complement of level of confidence. If significance level is 5%, then
there is 95% chance that the null hypothesis cannot be rejected (Marcoulides &
Hershberger, 2014).

9
27. Simple hypothesis
ANS: In Simple hypothesis all the parameters of the population have specific values. For
example H 0:( μ=32 ) , the population mean has a specific value of 32.
28. Size of a test
ANS: In hypothesis testing, size of the test is nothing but the probability of type-I error. It
reflects the probability of discarding a null hypothesis when the hypothesis is true.
29. Statistical independence
ANS: Two events of an experiment have statistical independence if occurrence of one of
the events does not have effect the occurrence of the other event in the experiment.
30. Trade-off between size of a test and power of a test
ANS: Size of a statistical test represents the probability of rejecting a null hypothesis,
when in reality the null hypothesis is true. Hence size of the test is type –I error of the
test. Power of a test is complementary probability of type-II error of a statistical test.
Type-I and type-II error are complementary in nature, and hence size of a test and power
of a test are directly comparable (Wasserman, 2013).
31. Type I error
ANS: Type-I error in testing of hypothesis is the probability of rejecting a null
hypothesis, when in reality the null hypothesis is true.

10
32. Type II error
ANS: Type-II error in hypothesis testing is the probability of acknowledging a null
hypothesis, when in reality it is false.
33. Unbiased estimator
ANS: Sample statistic values are used to estimate the population parameters. If the
expected value of the sample statistic is equal to the population parameter then the
estimator is said to be unbiased. For example, sample mean is an unbiased estimator of
population mean.
34. Union of events
ANS: Union of events is the accumulated set of all the events. All the data points are
collected in union of events. Union of events can be represented by Venn-Diagrammatic
approach.
Figure 2: Venn diagram for AUB
Secure Best Marks with AI Grader
Need help grading? Try our AI Grader for instant feedback on your assignments.

11
References
Wasserman, L., 2013. All of statistics: a concise course in statistical inference. Springer Science
& Business Media.
Marcoulides, G.A. and Hershberger, S.L., 2014. Multivariate statistical methods: A first course.
Psychology Press.
References
Wasserman, L., 2013. All of statistics: a concise course in statistical inference. Springer Science
& Business Media.
Marcoulides, G.A. and Hershberger, S.L., 2014. Multivariate statistical methods: A first course.
Psychology Press.
1 out of 11
Related Documents

Your All-in-One AI-Powered Toolkit for Academic Success.
+13062052269
info@desklib.com
Available 24*7 on WhatsApp / Email
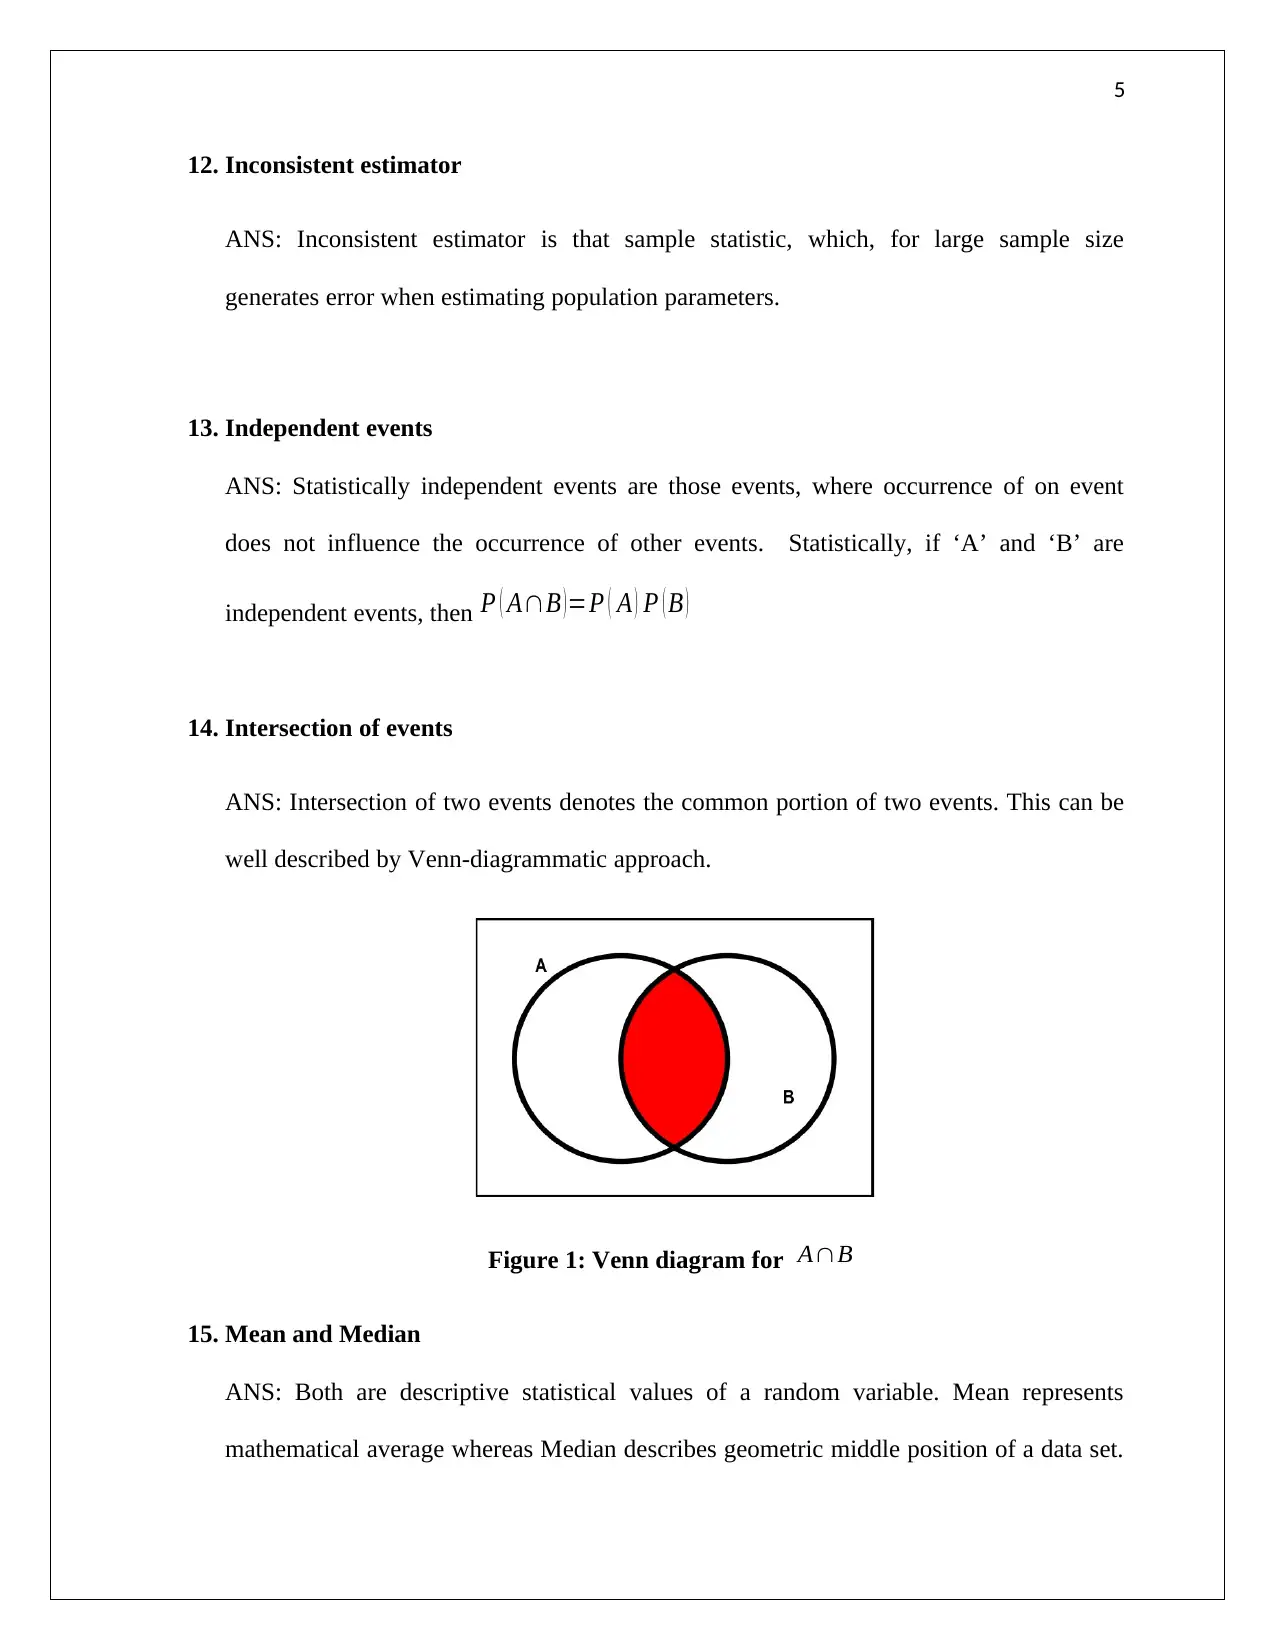
Unlock your academic potential
© 2024 | Zucol Services PVT LTD | All rights reserved.