Statistical Report: Correlation and Regression Analysis
VerifiedAdded on 2021/04/19
|9
|1100
|185
Report
AI Summary
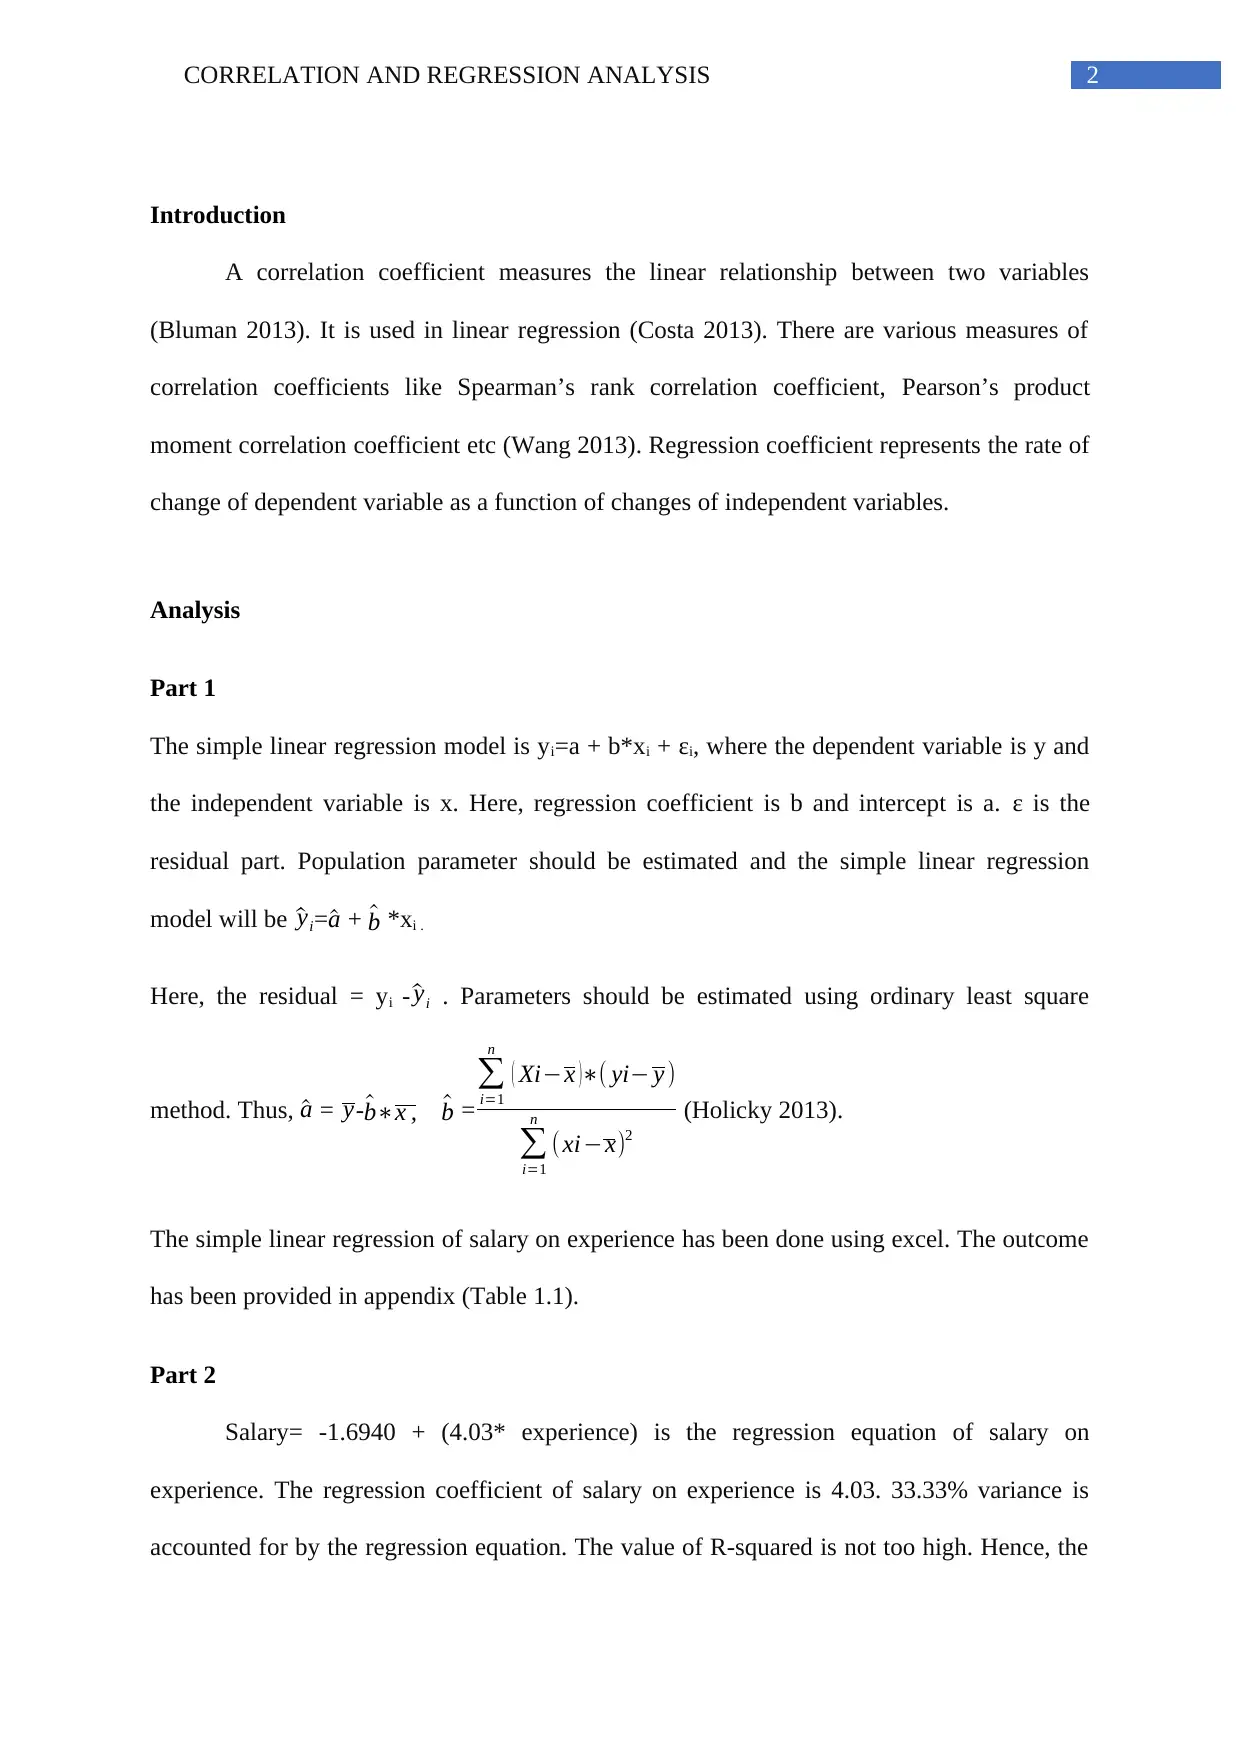
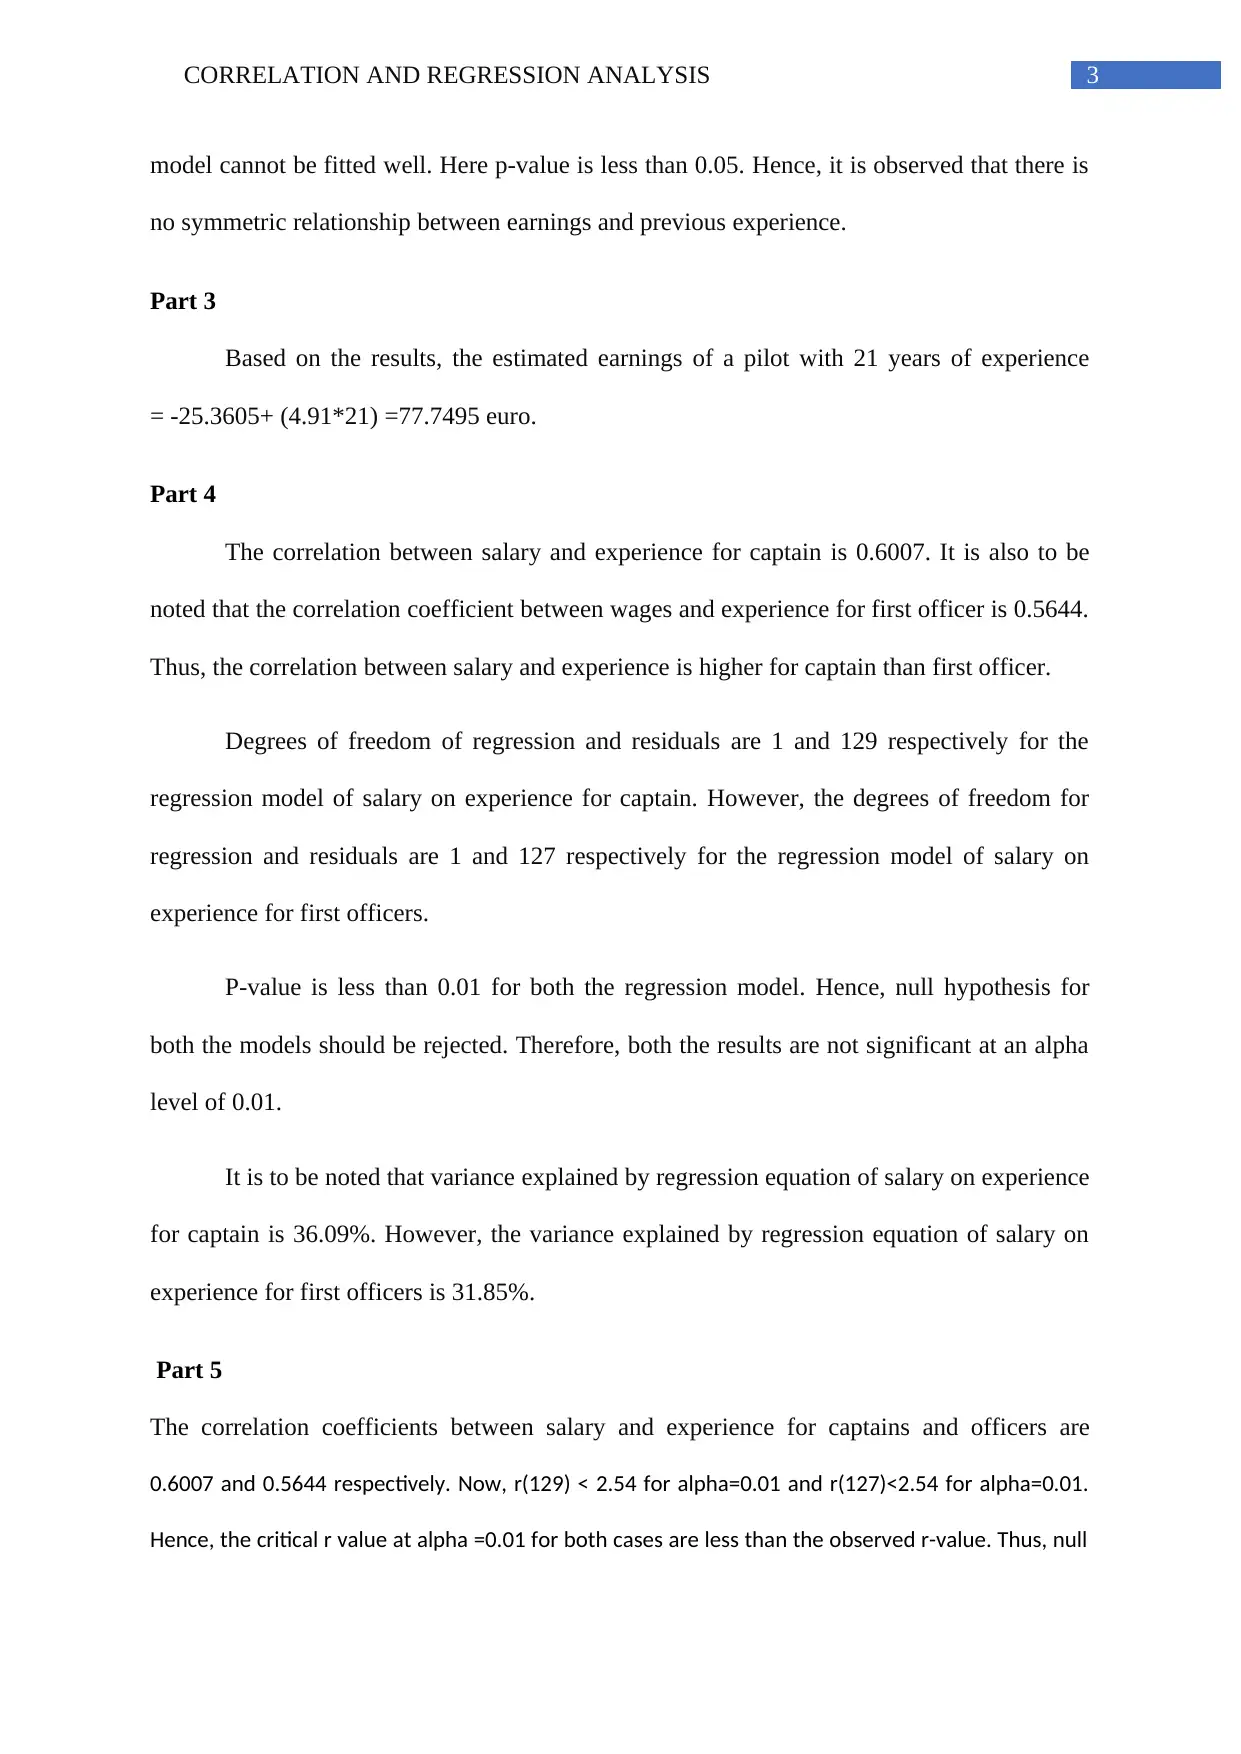
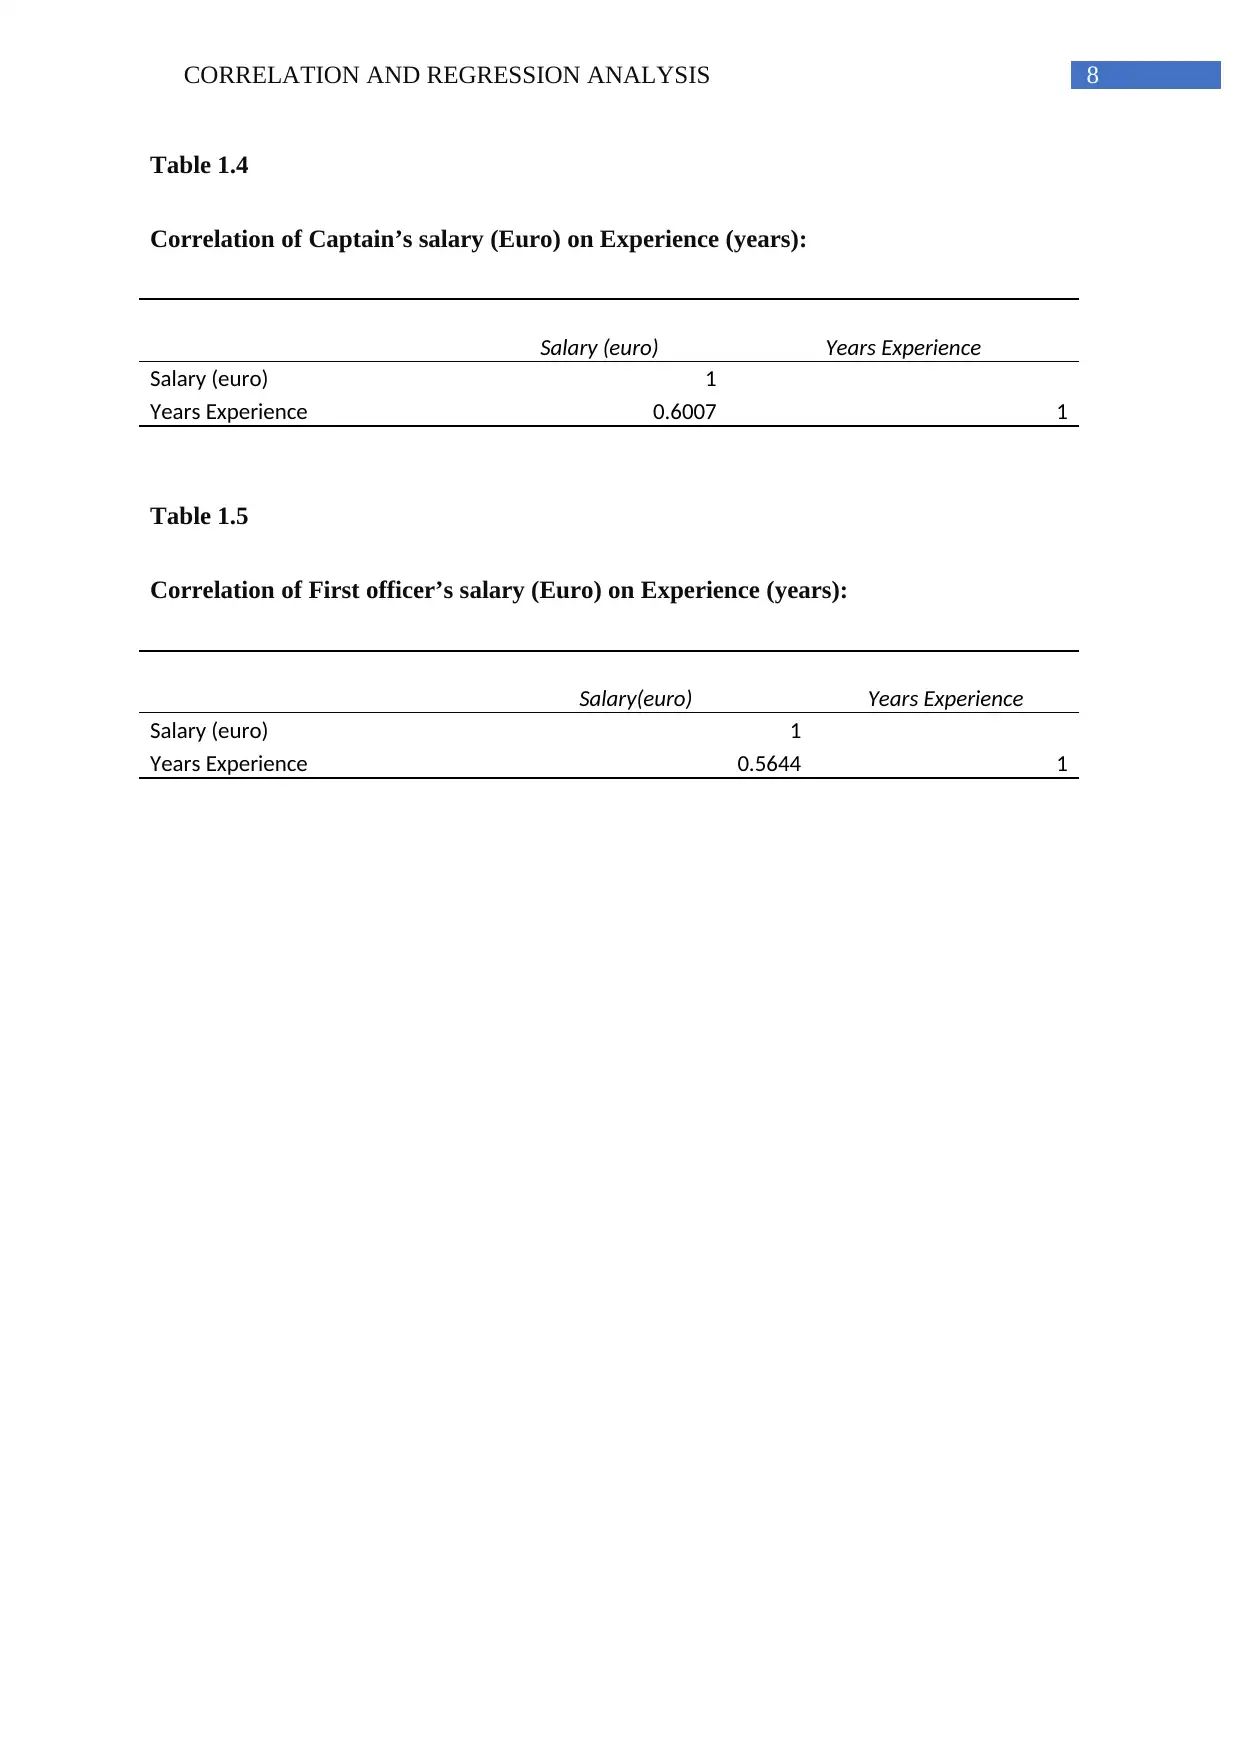
This report conducts a correlation and regression analysis to examine the relationship between salary and experience for pilots. The analysis begins with a simple linear regression model, establishing the regression equation for salary based on experience. The results indicate a positive correlation, but the model's fit is not strong, with a relatively low R-squared value. The study further investigates the correlation between salary and experience for captains and first officers separately, revealing a higher correlation for captains. The report calculates predicted earnings based on experience levels and compares correlation coefficients and degrees of freedom for different pilot roles. The findings suggest that the regression equations don't fit the data well for both captain and first officer roles. The analysis underscores the use of regression to show the relationship between variables and correlation to describe linear relationships. The report concludes by highlighting the limitations of the models and the need for more robust analysis.

Running head: CORRELATION AND REGRESSION ANALYSIS
Correlation and Regression Analysis
Name of the Student
Name of the University
Author Note
Correlation and Regression Analysis
Name of the Student
Name of the University
Author Note
Paraphrase This Document
Need a fresh take? Get an instant paraphrase of this document with our AI Paraphraser

1CORRELATION AND REGRESSION ANALYSIS
Table of Contents
Introduction................................................................................................................................2
Analysis......................................................................................................................................2
Part 1......................................................................................................................................2
Part 2......................................................................................................................................2
Part 3......................................................................................................................................3
Part 4......................................................................................................................................3
Part 5......................................................................................................................................3
Conclusion..................................................................................................................................4

2CORRELATION AND REGRESSION ANALYSIS
Introduction
A correlation coefficient measures the linear relationship between two variables
(Bluman 2013). It is used in linear regression (Costa 2013). There are various measures of
correlation coefficients like Spearman’s rank correlation coefficient, Pearson’s product
moment correlation coefficient etc (Wang 2013). Regression coefficient represents the rate of
change of dependent variable as a function of changes of independent variables.
Analysis
Part 1
The simple linear regression model is yi=a + b*xi + ɛi, where the dependent variable is y and
the independent variable is x. Here, regression coefficient is b and intercept is a. ɛ is the
residual part. Population parameter should be estimated and the simple linear regression
model will be ^yi= ^a + ^b *xi .
Here, the residual = yi - ^yi . Parameters should be estimated using ordinary least square
method. Thus, ^a = y- ^b∗x , ^b =
∑
i=1
n
( Xi−x )∗( yi− y )
∑
i=1
n
( xi−x)2
(Holicky 2013).
The simple linear regression of salary on experience has been done using excel. The outcome
has been provided in appendix (Table 1.1).
Part 2
Salary= -1.6940 + (4.03* experience) is the regression equation of salary on
experience. The regression coefficient of salary on experience is 4.03. 33.33% variance is
accounted for by the regression equation. The value of R-squared is not too high. Hence, the
⊘ This is a preview!⊘
Do you want full access?
Subscribe today to unlock all pages.

Trusted by 1+ million students worldwide

3CORRELATION AND REGRESSION ANALYSIS
model cannot be fitted well. Here p-value is less than 0.05. Hence, it is observed that there is
no symmetric relationship between earnings and previous experience.
Part 3
Based on the results, the estimated earnings of a pilot with 21 years of experience
= -25.3605+ (4.91*21) =77.7495 euro.
Part 4
The correlation between salary and experience for captain is 0.6007. It is also to be
noted that the correlation coefficient between wages and experience for first officer is 0.5644.
Thus, the correlation between salary and experience is higher for captain than first officer.
Degrees of freedom of regression and residuals are 1 and 129 respectively for the
regression model of salary on experience for captain. However, the degrees of freedom for
regression and residuals are 1 and 127 respectively for the regression model of salary on
experience for first officers.
P-value is less than 0.01 for both the regression model. Hence, null hypothesis for
both the models should be rejected. Therefore, both the results are not significant at an alpha
level of 0.01.
It is to be noted that variance explained by regression equation of salary on experience
for captain is 36.09%. However, the variance explained by regression equation of salary on
experience for first officers is 31.85%.
Part 5
The correlation coefficients between salary and experience for captains and officers are
0.6007 and 0.5644 respectively. Now, r(129) < 2.54 for alpha=0.01 and r(127)<2.54 for alpha=0.01.
Hence, the critical r value at alpha =0.01 for both cases are less than the observed r-value. Thus, null
Paraphrase This Document
Need a fresh take? Get an instant paraphrase of this document with our AI Paraphraser

4CORRELATION AND REGRESSION ANALYSIS
hypothesis of both the cases should be rejected. Therefore, it is said with 99% confidence that there
is no symmetric linear relationship between salary and experience for both captains and first
officers.
Conclusion
It is observed from the analysis that the regression equations of earnings on
experience are not fitted well for both captain and first manager. It is clear that regression is
used to show how independent variable is related to dependent variable and correlation
describes the linear relation between dependent and independent variables.

5CORRELATION AND REGRESSION ANALYSIS
References:
Bluman, A.G., 2013. Elementary statistics. Chennai: McGraw Hill.
Costa, V., 2017. Correlation and Regression. In Fundamentals of Statistical
Hydrology (pp. 391-440). Springer, Cham.
Holický, M., 2013. Correlation and Regression. In Introduction to Probability and
Statistics for Engineers (pp. 139-152). Springer, Berlin, Heidelberg.
Wang, J., 2013. Pearson correlation coefficient. In Encyclopedia of Systems
Biology (pp. 1671-1671). Springer New York.
⊘ This is a preview!⊘
Do you want full access?
Subscribe today to unlock all pages.

Trusted by 1+ million students worldwide

6CORRELATION AND REGRESSION ANALYSIS
Appendix
Table 1.1
Regression of salary (Euro) on Experience (years):
Regression Statistics
Multiple R 0.5773
R Square 0.3333
Adjusted R
Square 0.3307
Standard Error 39.3639
Observations 260
ANOVA
df SS MS F
Significance
F
Regression 1 199852.603
199852.
6
128.977
7 1.65376E-24
Residual 258 399774.3354
1549.51
3
Total 259 599626.9385
Coefficient
s
Standard
Error t Stat P-value Lower 95%
Upper
95%
Intercept -1.6940 9.2571 -0.1830 0.8549 -19.9230 16.5351
Years Experience 4.03 0.3551 11.3568 1.65E-24 3.3335 4.7321
Table 1.2
Regression of Captain’s salary (Euro) on Experience (years):
Regression Statistics
Multiple R 0.6007
R Square 0.3609
Adjusted R
Square 0.3559
Standard
Error
39.020
3
Observation
s 131
ANOVA
Paraphrase This Document
Need a fresh take? Get an instant paraphrase of this document with our AI Paraphraser

7CORRELATION AND REGRESSION ANALYSIS
df SS MS F
Significa
nce F
Regression 1
110900.8
02
11090
0.80 72.84
3.32589E
-14
Residual 129
196413.6
102
1522.5
86
Total 130
307314.4
122
Coeffici
ents
Standard
Error t Stat
P-
value
Lower
95%
Upper
95%
Lower
99.0%
Upper
99.0%
Intercept
-
25.360
5 15.3799
-
1.6489
0.101
6 -55.79 5.07 -65.57 14.85
Years
Experience 4.91 0.5753 8.5345
3.33E
-14 3.77 6.05 3.41 6.41
Table 1.3
Regression of First Officer’s salary (Euro) on Experience (years):
Regression Statistics
Multiple R 0.5644
R Square 0.3185
Adjusted R
Square 0.3131
Standard
Error 39.4526
Observation
s 129
ANOVA
df SS MS F
Significa
nce F
Regression 1 92387.37
92387
.37 59.36
3.27718E
-12
Residual 127 197676.7
1556.
51
Total 128 290064.1
Coeffici
ents
Standard
Error t Stat
P-
value
Lower
95%
Upper
95%
Lower
99.0%
Upper
99.0%
Intercept 11.5751 11.5887
0.998
8
0.319
8 -11.36 34.51 -18.73 41.88
X Variable 1 3.52 0.4567
7.704
3
3.28E
-12 2.61 4.42 2.32 4.71
df SS MS F
Significa
nce F
Regression 1
110900.8
02
11090
0.80 72.84
3.32589E
-14
Residual 129
196413.6
102
1522.5
86
Total 130
307314.4
122
Coeffici
ents
Standard
Error t Stat
P-
value
Lower
95%
Upper
95%
Lower
99.0%
Upper
99.0%
Intercept
-
25.360
5 15.3799
-
1.6489
0.101
6 -55.79 5.07 -65.57 14.85
Years
Experience 4.91 0.5753 8.5345
3.33E
-14 3.77 6.05 3.41 6.41
Table 1.3
Regression of First Officer’s salary (Euro) on Experience (years):
Regression Statistics
Multiple R 0.5644
R Square 0.3185
Adjusted R
Square 0.3131
Standard
Error 39.4526
Observation
s 129
ANOVA
df SS MS F
Significa
nce F
Regression 1 92387.37
92387
.37 59.36
3.27718E
-12
Residual 127 197676.7
1556.
51
Total 128 290064.1
Coeffici
ents
Standard
Error t Stat
P-
value
Lower
95%
Upper
95%
Lower
99.0%
Upper
99.0%
Intercept 11.5751 11.5887
0.998
8
0.319
8 -11.36 34.51 -18.73 41.88
X Variable 1 3.52 0.4567
7.704
3
3.28E
-12 2.61 4.42 2.32 4.71

8CORRELATION AND REGRESSION ANALYSIS
Table 1.4
Correlation of Captain’s salary (Euro) on Experience (years):
Salary (euro) Years Experience
Salary (euro) 1
Years Experience 0.6007 1
Table 1.5
Correlation of First officer’s salary (Euro) on Experience (years):
Salary(euro) Years Experience
Salary (euro) 1
Years Experience 0.5644 1
Table 1.4
Correlation of Captain’s salary (Euro) on Experience (years):
Salary (euro) Years Experience
Salary (euro) 1
Years Experience 0.6007 1
Table 1.5
Correlation of First officer’s salary (Euro) on Experience (years):
Salary(euro) Years Experience
Salary (euro) 1
Years Experience 0.5644 1
⊘ This is a preview!⊘
Do you want full access?
Subscribe today to unlock all pages.

Trusted by 1+ million students worldwide
1 out of 9
Related Documents

Your All-in-One AI-Powered Toolkit for Academic Success.
+13062052269
info@desklib.com
Available 24*7 on WhatsApp / Email
Unlock your academic potential
Copyright © 2020–2025 A2Z Services. All Rights Reserved. Developed and managed by ZUCOL.