Statistical Analysis of Startup Costs and Regression

Verified

Added on  2020/03/28

|11
|385
|115
Homework Assignment
AI Summary
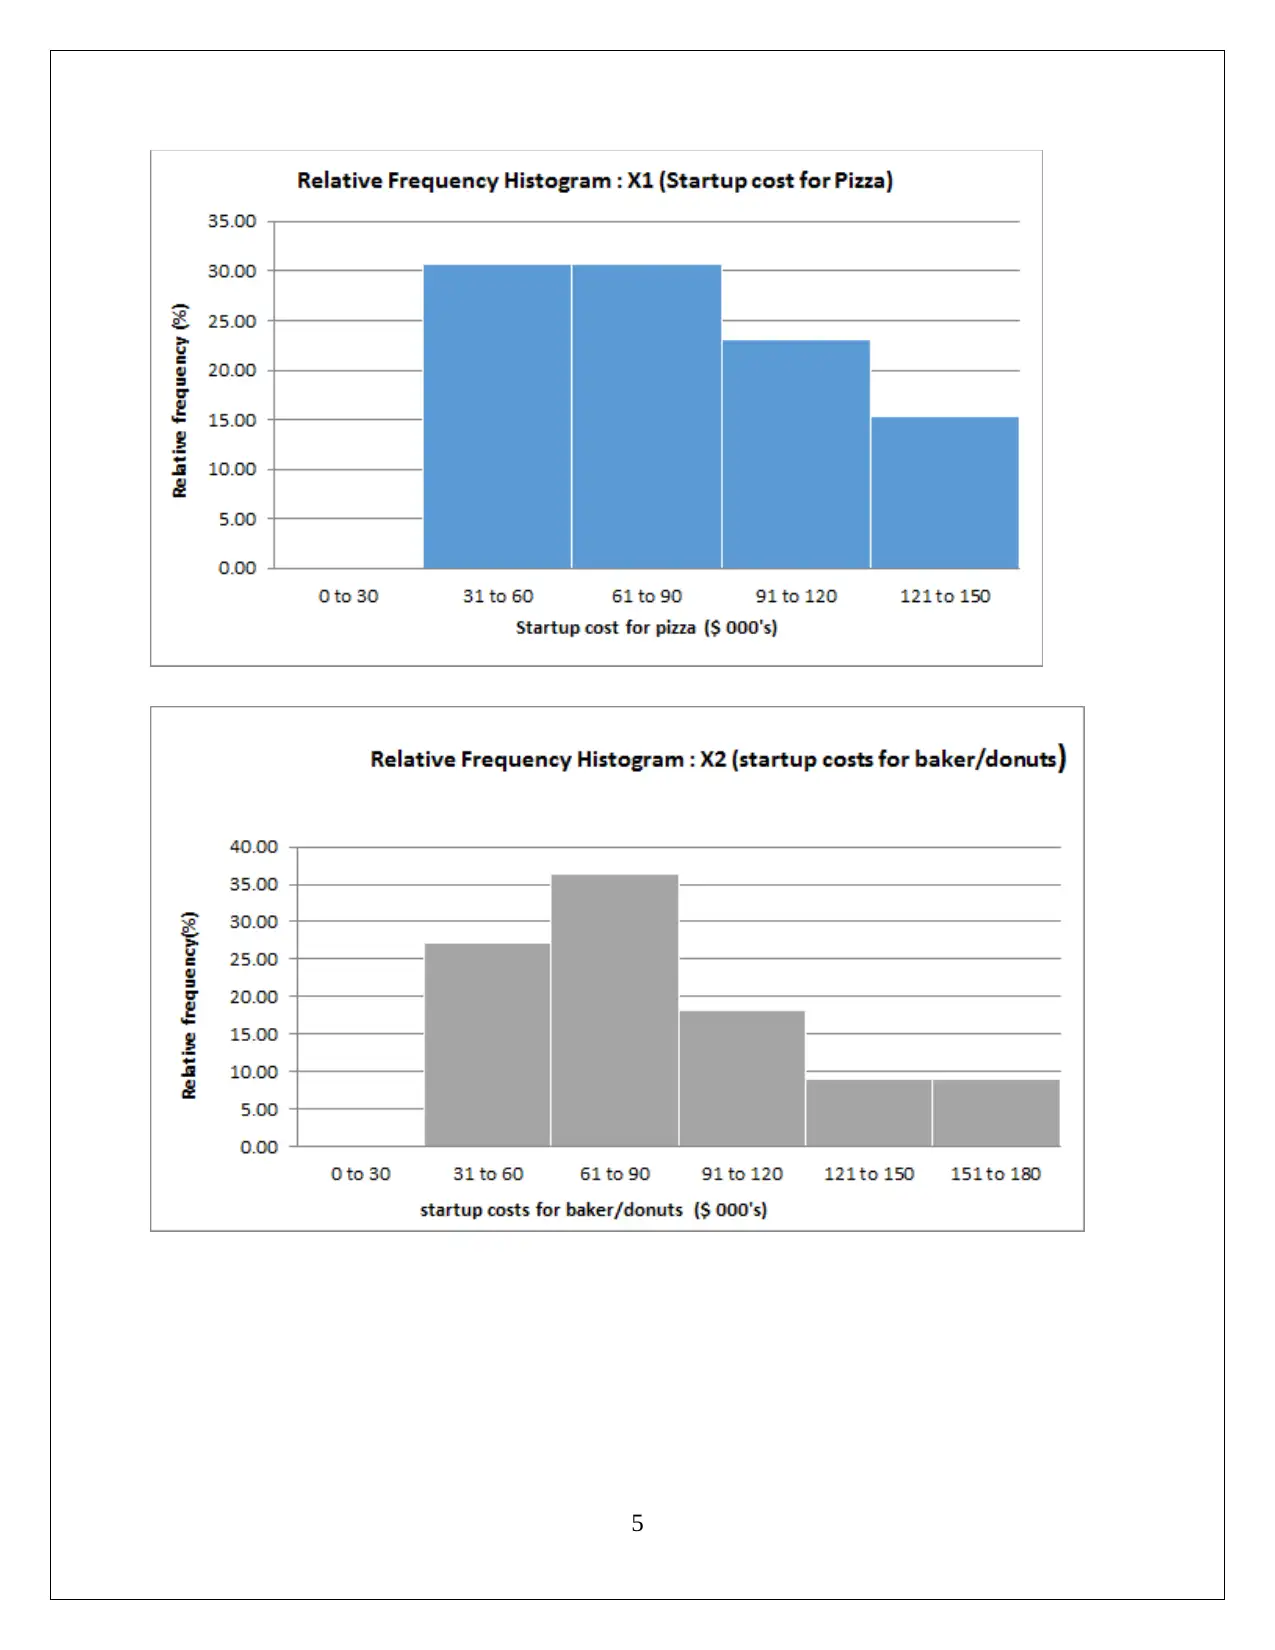
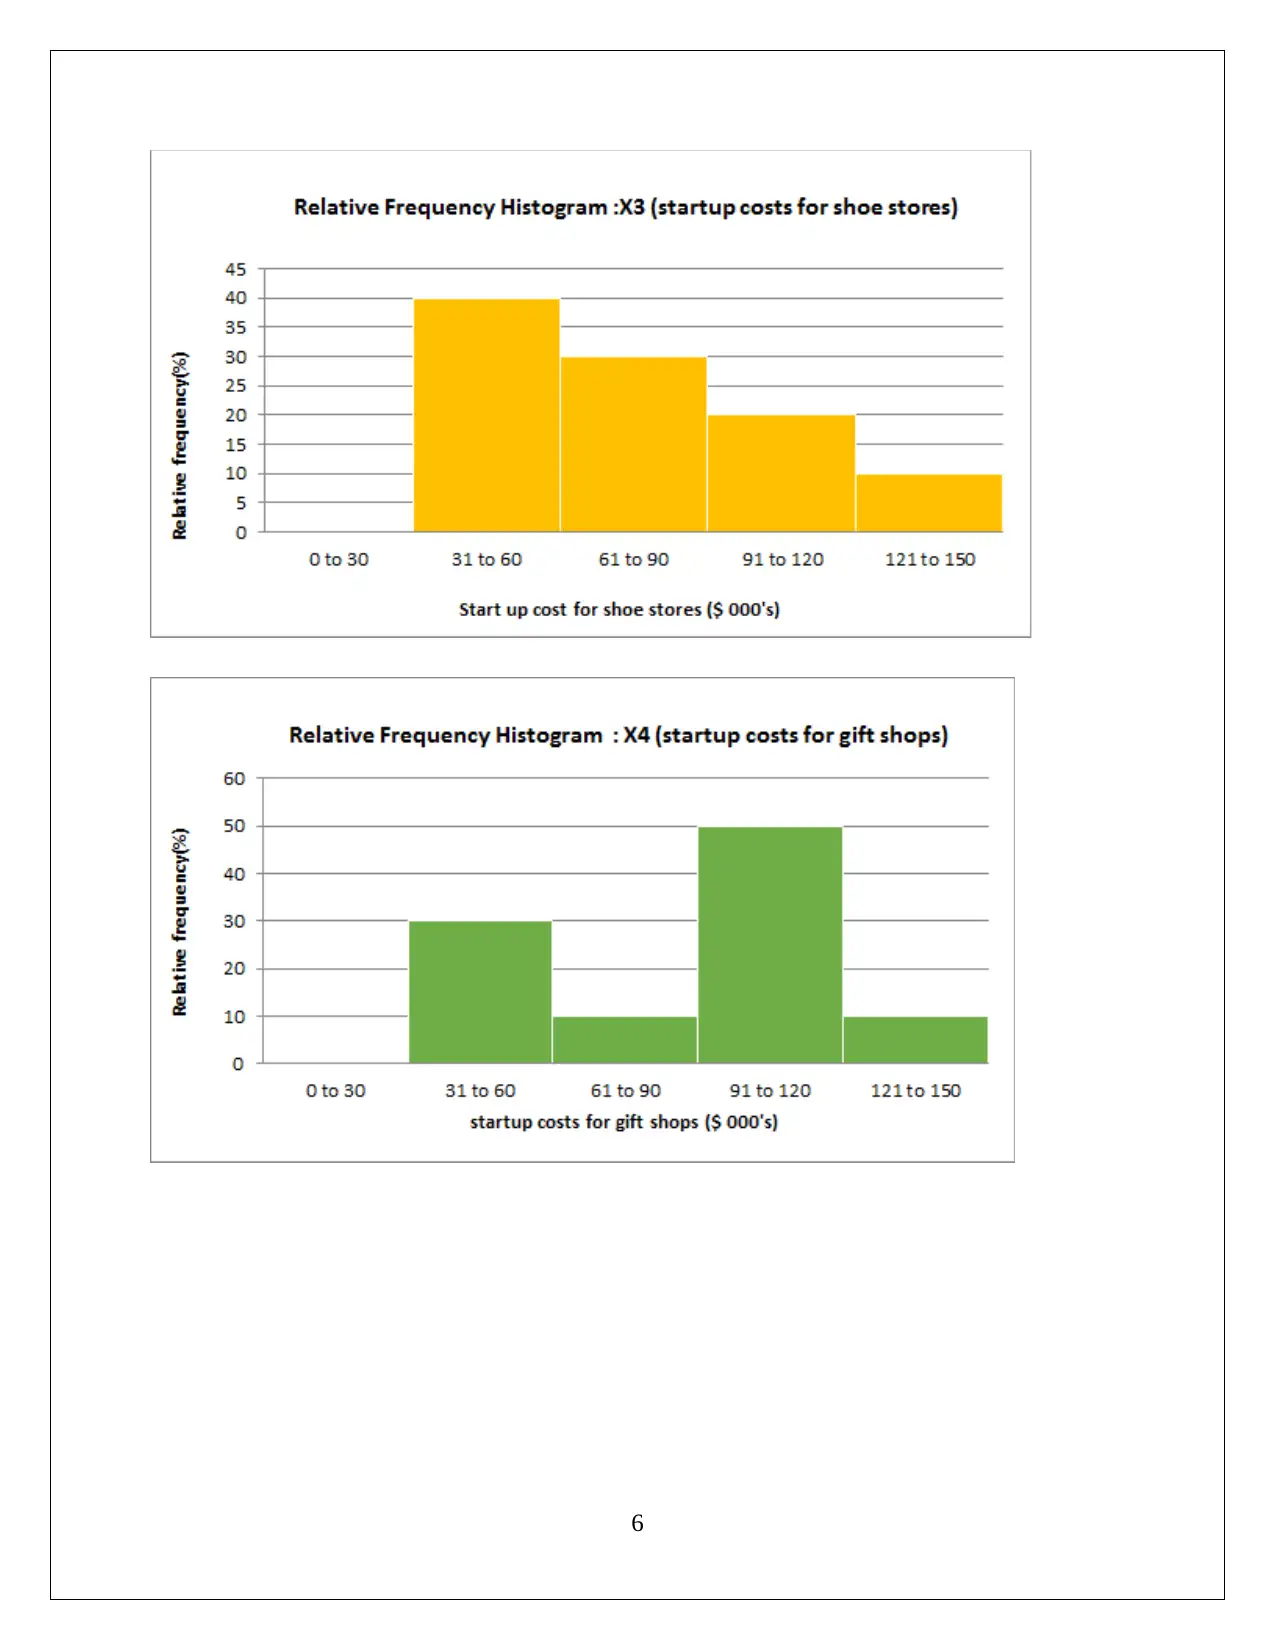
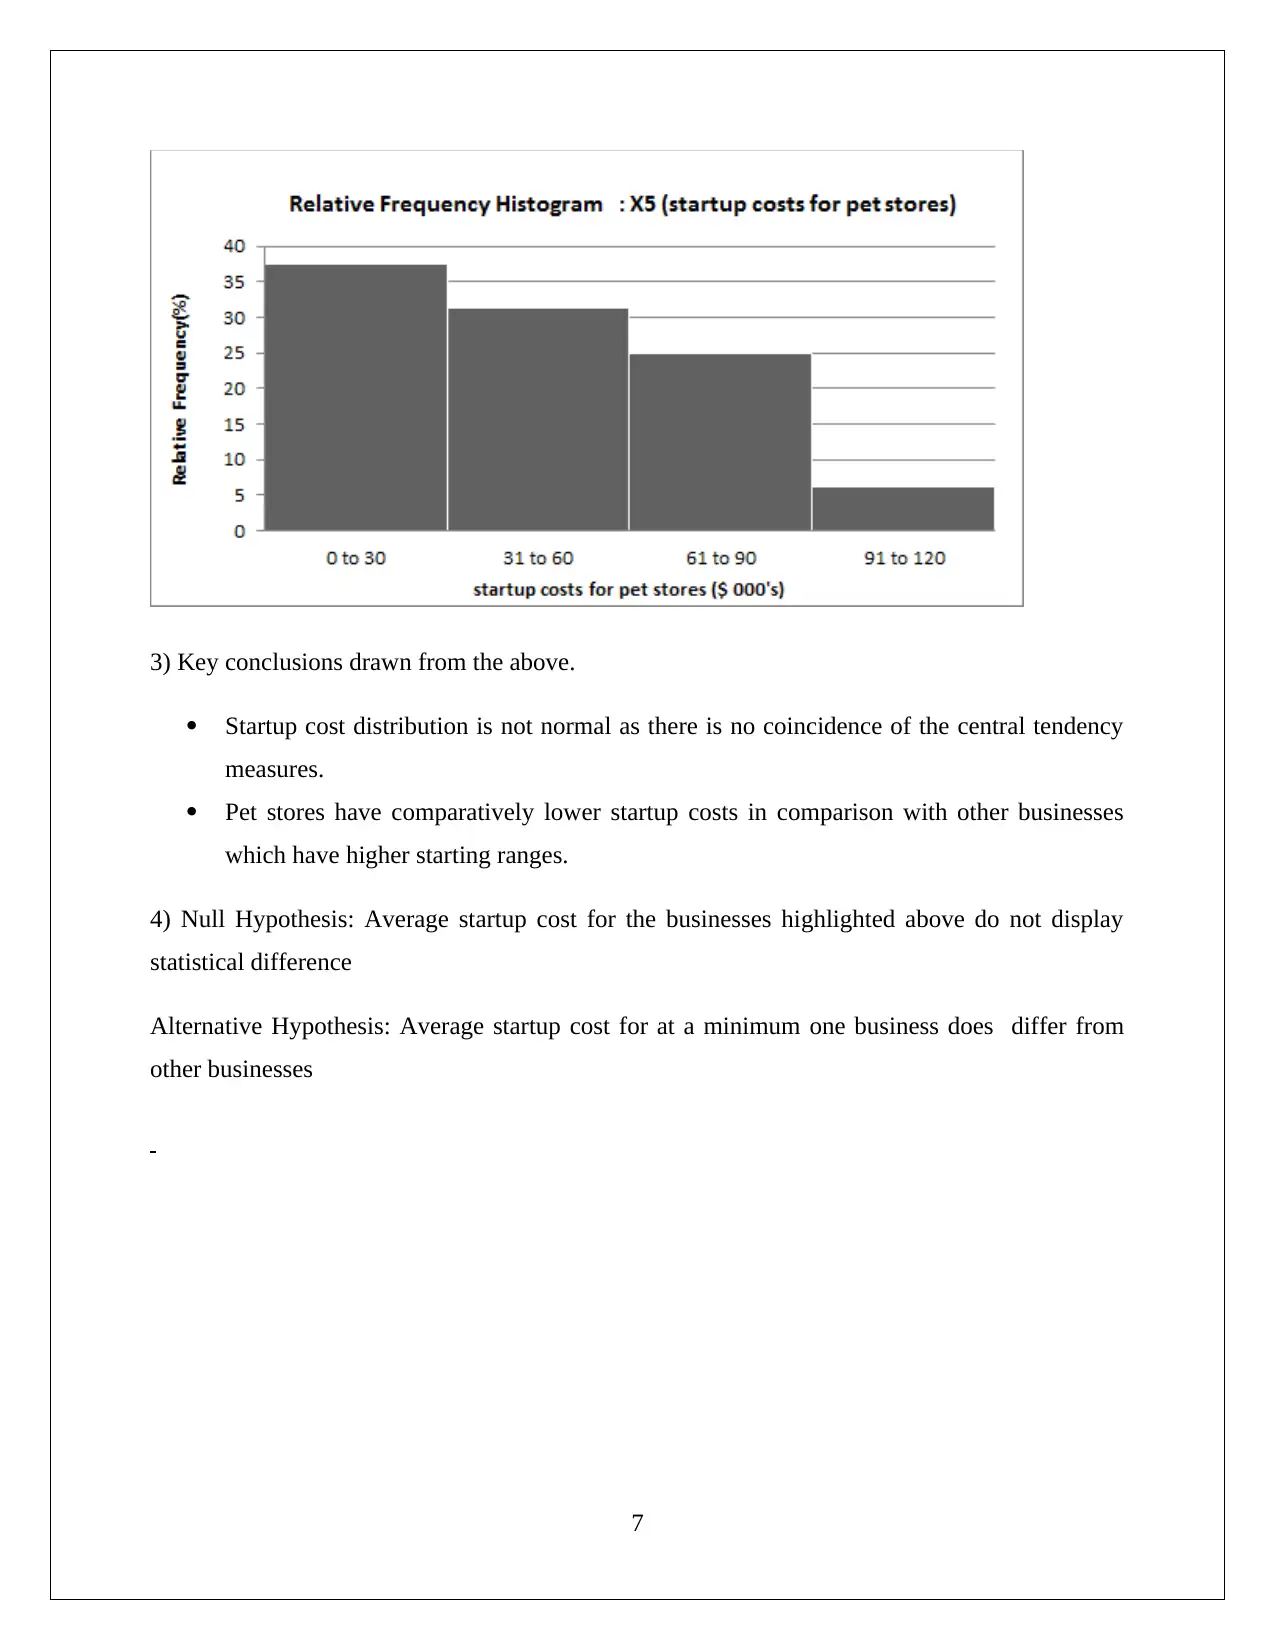
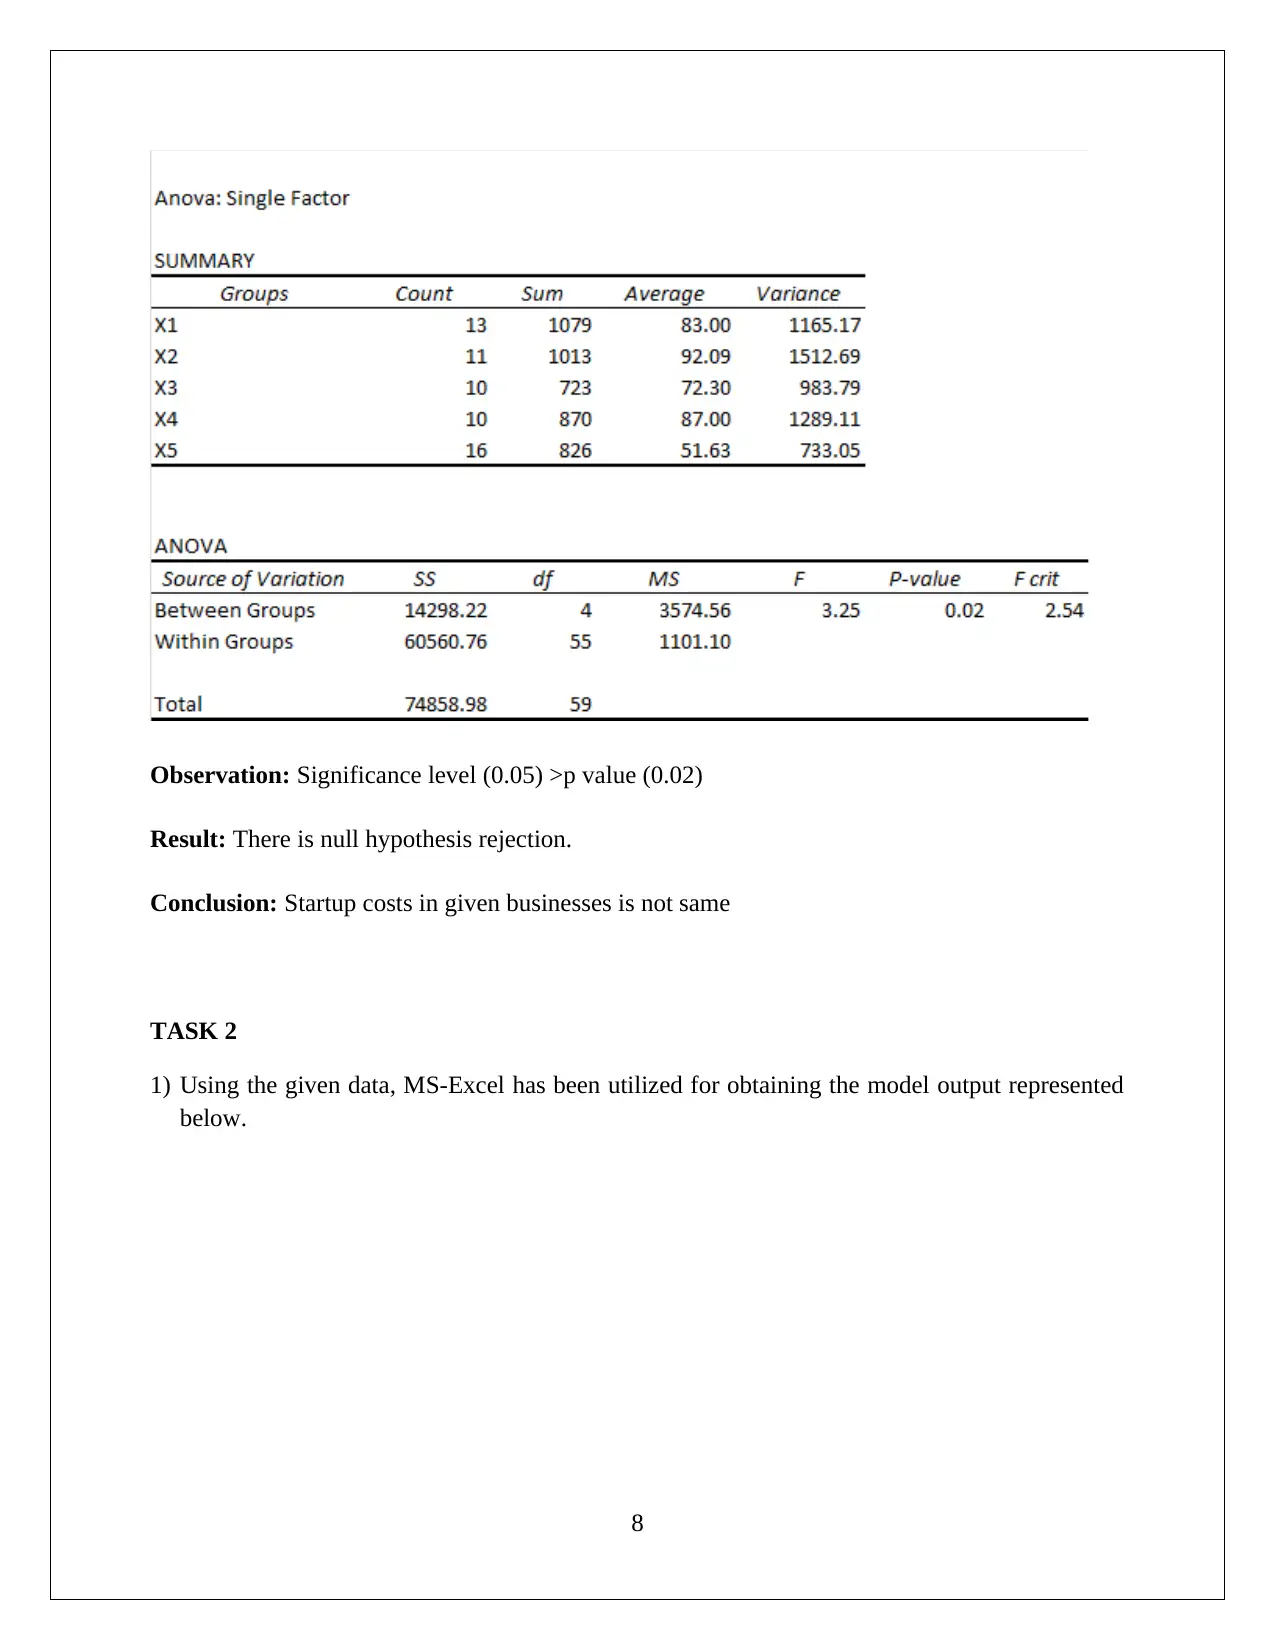
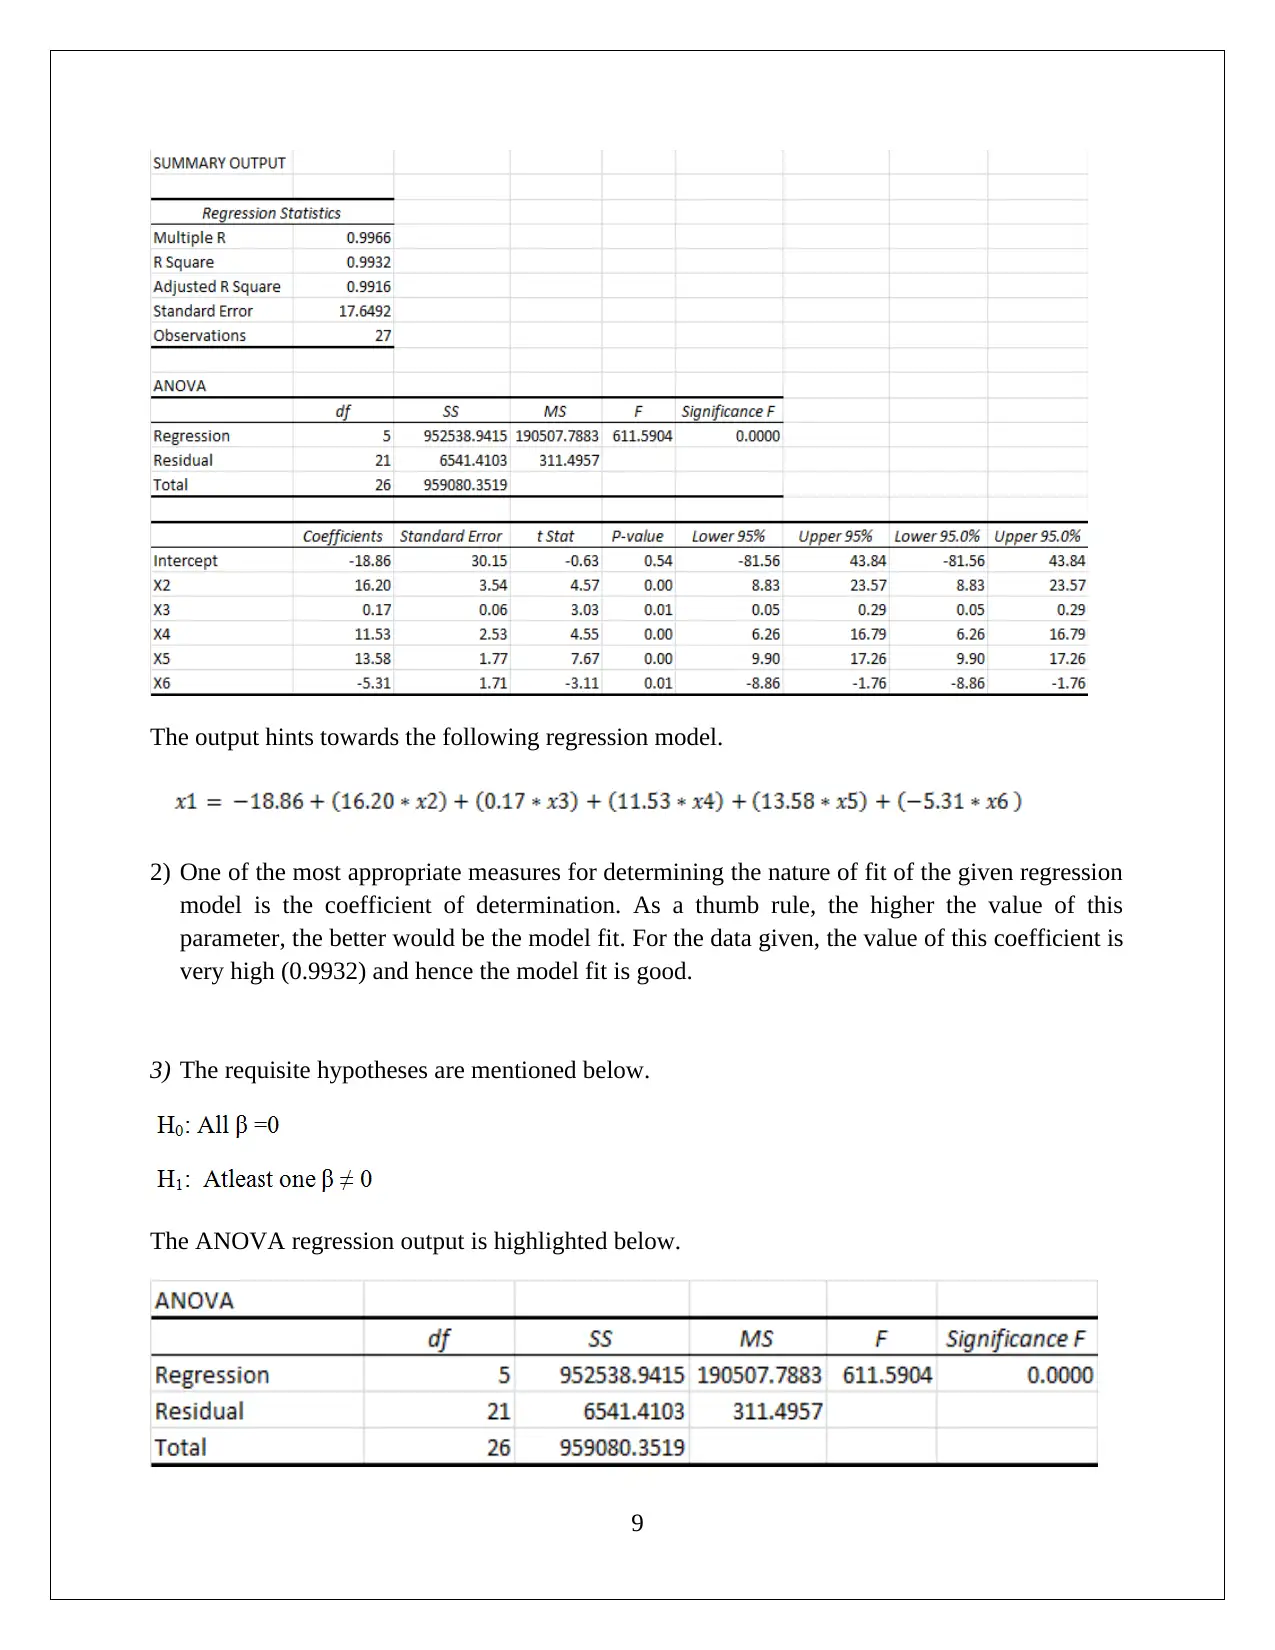
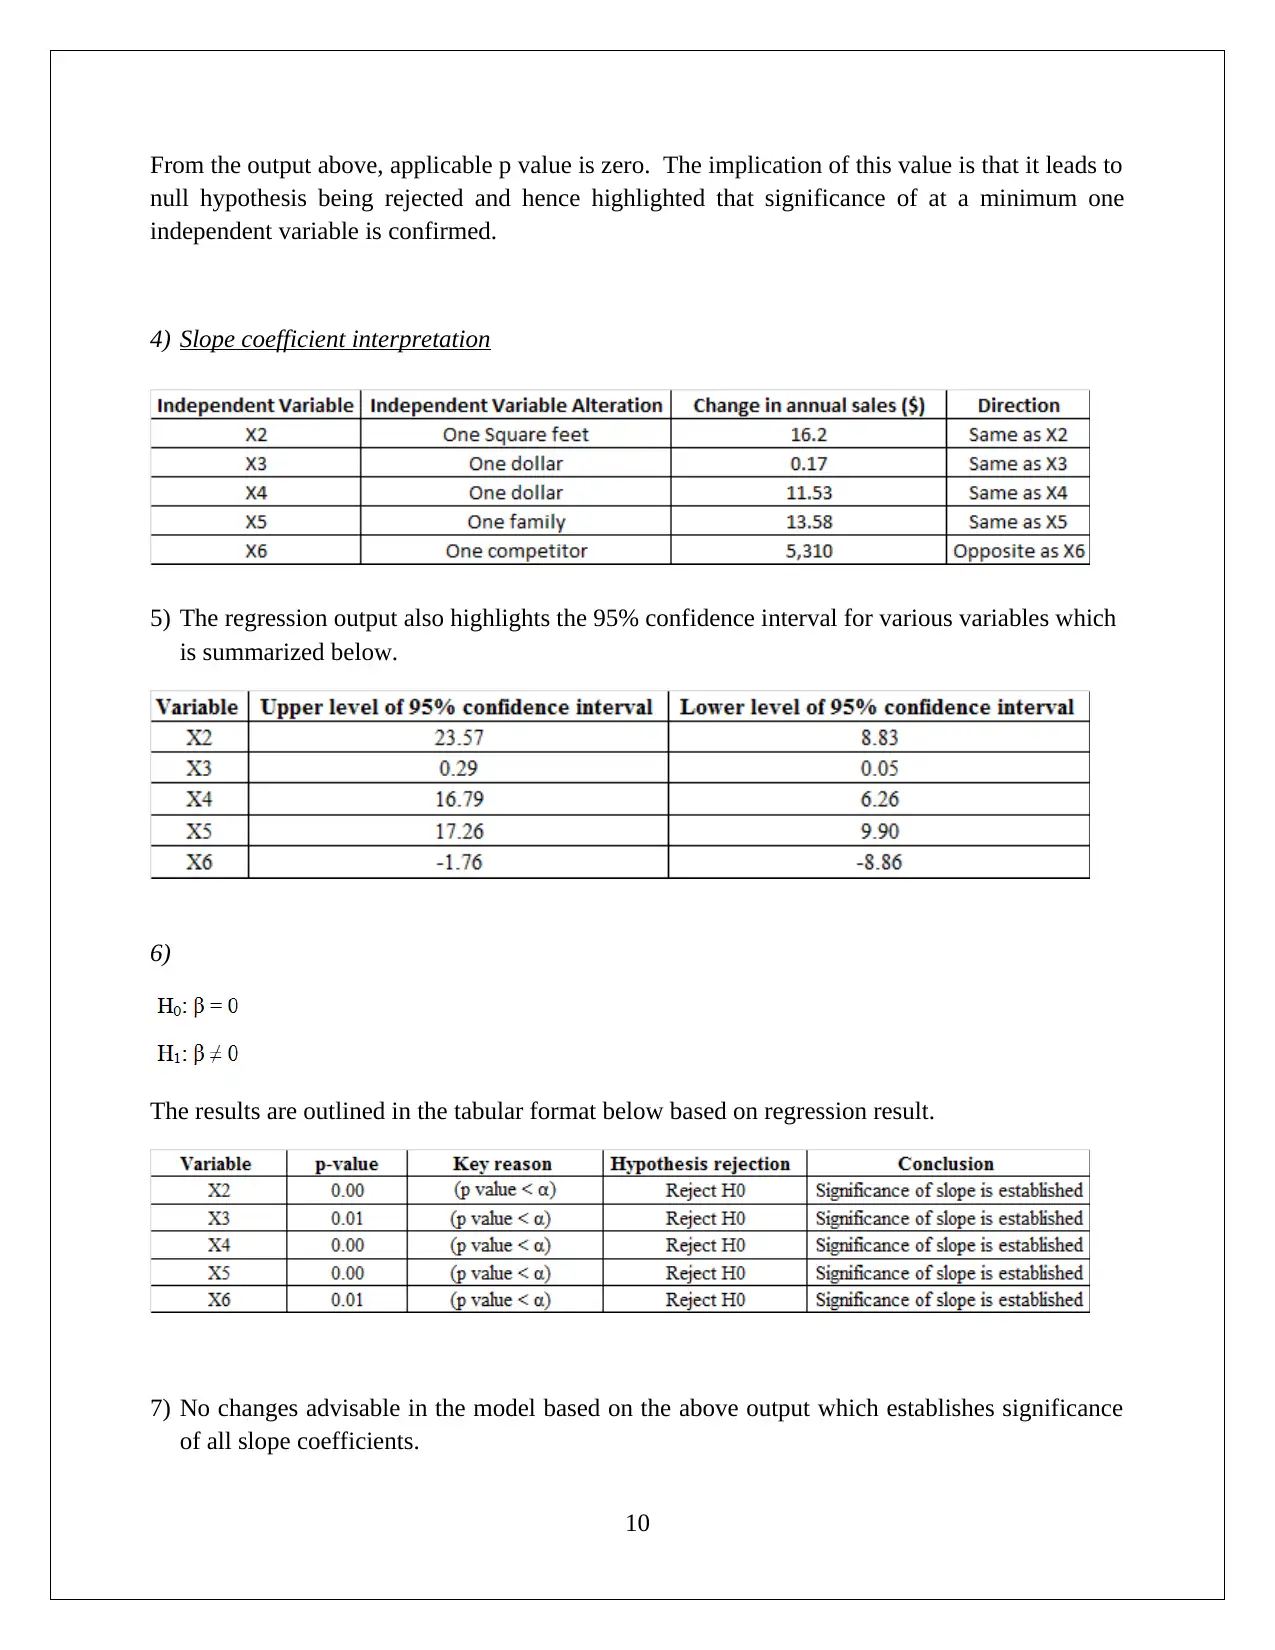
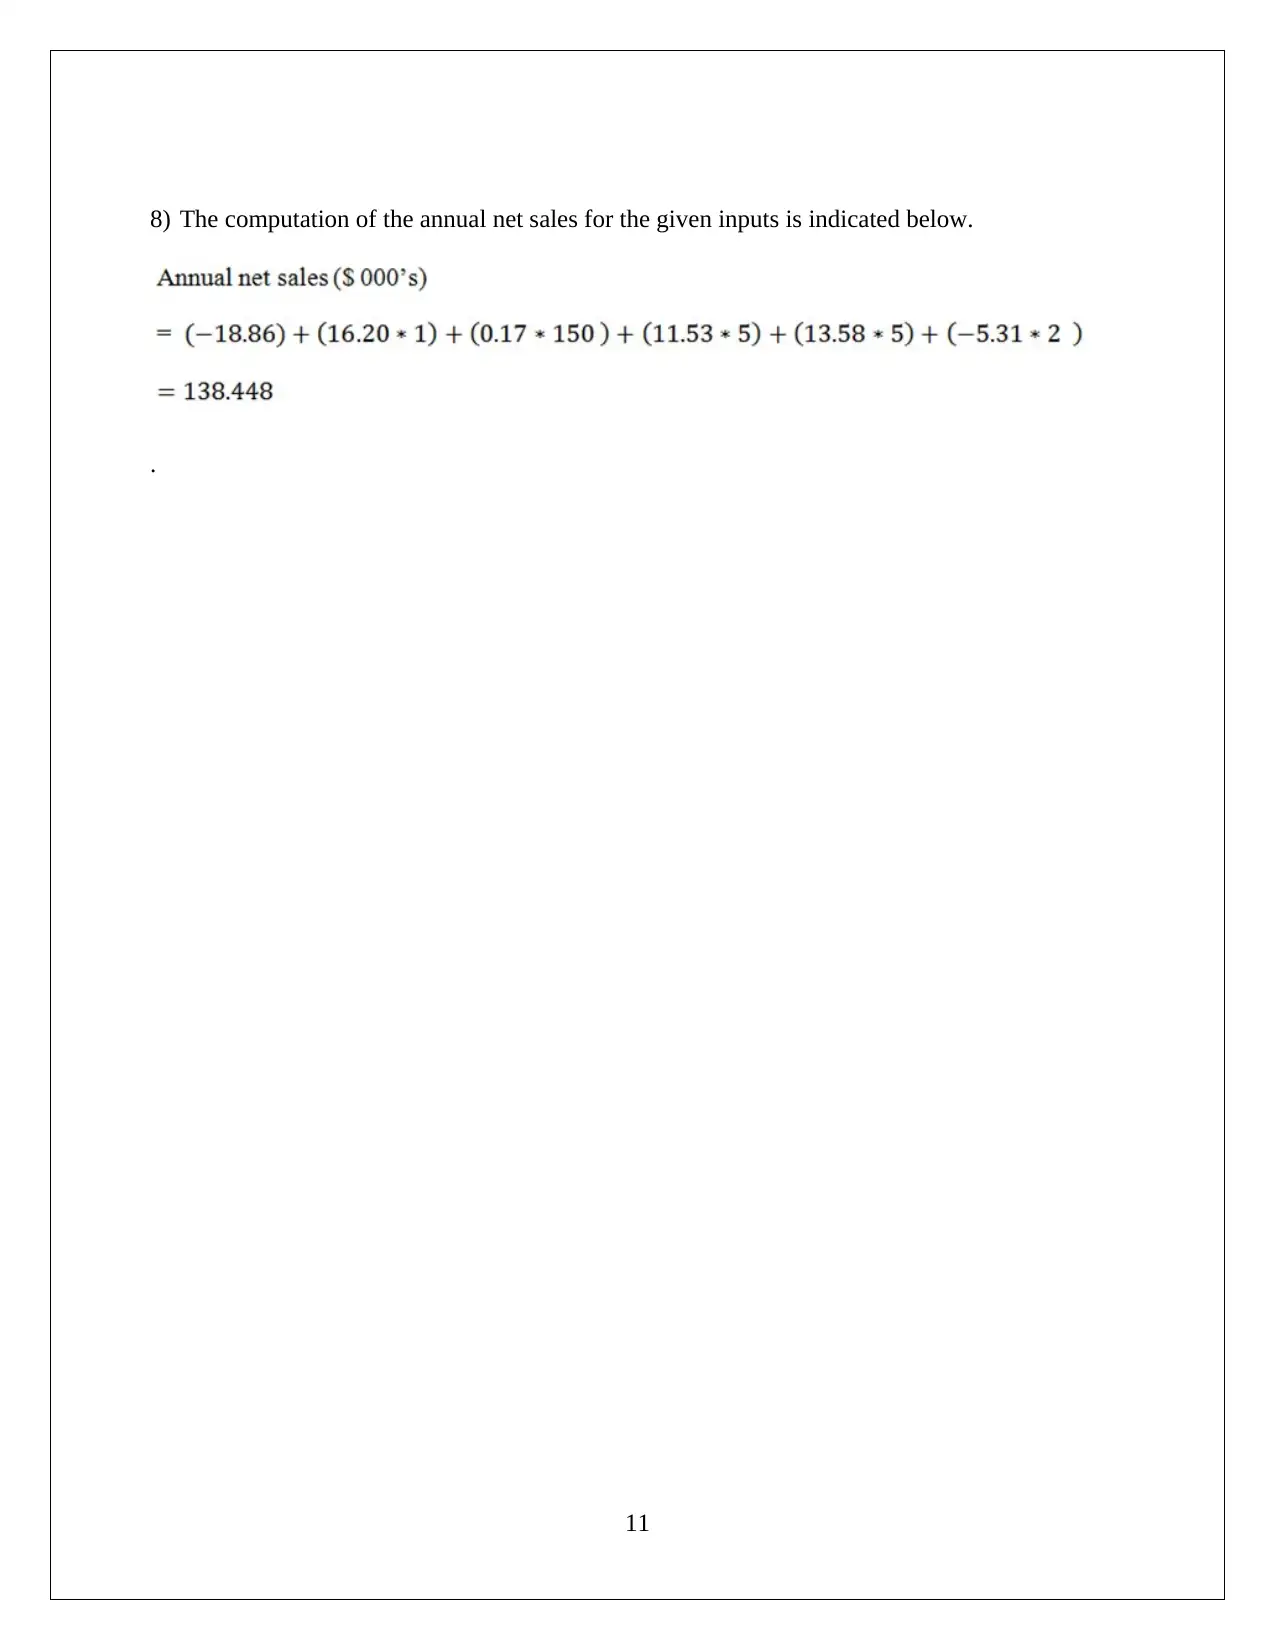
This assignment presents a statistical analysis of startup costs, encompassing frequency distribution, hypothesis testing, and regression modeling. The analysis begins with the construction of a frequency and relative frequency table, followed by a histogram, and key conclusions drawn from the data. The assignment also involves hypothesis testing, where the null hypothesis regarding average startup costs is rejected. Furthermore, the document utilizes MS-Excel to create a regression model, determining the coefficient of determination and interpreting slope coefficients. The ANOVA regression output is analyzed to assess the significance of independent variables and compute annual net sales. The analysis concludes with an assessment of the regression model's fit and significance of coefficients, providing insights into the statistical characteristics of startup costs.
Document Page
STATISTICS
Student Name and Number
[Pick the date]
Task 1
1
tabler-icon-diamond-filled.svg

Paraphrase This Document

Need a fresh take? Get an instant paraphrase of this document with our AI Paraphraser
Document Page
(1) The requisite parameters for various startup costs in 000’s are represented in tabular format.
2
Document Page
(2) (a) Frequency and relative frequency table for the given business
3
Document Page
(b) Histogram by taking relative frequency is shown below:
4
tabler-icon-diamond-filled.svg

Paraphrase This Document

Need a fresh take? Get an instant paraphrase of this document with our AI Paraphraser
Document Page
5
Document Page
6
Document Page
3) Key conclusions drawn from the above.
Startup cost distribution is not normal as there is no coincidence of the central tendency
measures.
Pet stores have comparatively lower startup costs in comparison with other businesses
which have higher starting ranges.
4) Null Hypothesis: Average startup cost for the businesses highlighted above do not display
statistical difference
Alternative Hypothesis: Average startup cost for at a minimum one business does differ from
other businesses
7
tabler-icon-diamond-filled.svg

Paraphrase This Document

Need a fresh take? Get an instant paraphrase of this document with our AI Paraphraser
Document Page
Observation: Significance level (0.05) >p value (0.02)
Result: There is null hypothesis rejection.
Conclusion: Startup costs in given businesses is not same
TASK 2
1) Using the given data, MS-Excel has been utilized for obtaining the model output represented
below.
8
Document Page
The output hints towards the following regression model.
2) One of the most appropriate measures for determining the nature of fit of the given regression
model is the coefficient of determination. As a thumb rule, the higher the value of this
parameter, the better would be the model fit. For the data given, the value of this coefficient is
very high (0.9932) and hence the model fit is good.
3) The requisite hypotheses are mentioned below.
The ANOVA regression output is highlighted below.
9
Document Page
From the output above, applicable p value is zero. The implication of this value is that it leads to
null hypothesis being rejected and hence highlighted that significance of at a minimum one
independent variable is confirmed.
4) Slope coefficient interpretation
5) The regression output also highlights the 95% confidence interval for various variables which
is summarized below.
6)
The results are outlined in the tabular format below based on regression result.
7) No changes advisable in the model based on the above output which establishes significance
of all slope coefficients.
10
tabler-icon-diamond-filled.svg

Paraphrase This Document

Need a fresh take? Get an instant paraphrase of this document with our AI Paraphraser
Document Page
8) The computation of the annual net sales for the given inputs is indicated below.
.
11
chevron_up_icon
1 out of 11
circle_padding
hide_on_mobile
zoom_out_icon
[object Object]