Statistical Analysis Homework: Descriptive Stats & Confidence Interval

Verified

Added on  2024/04/26

|3
|743
|260
Homework Assignment
AI Summary
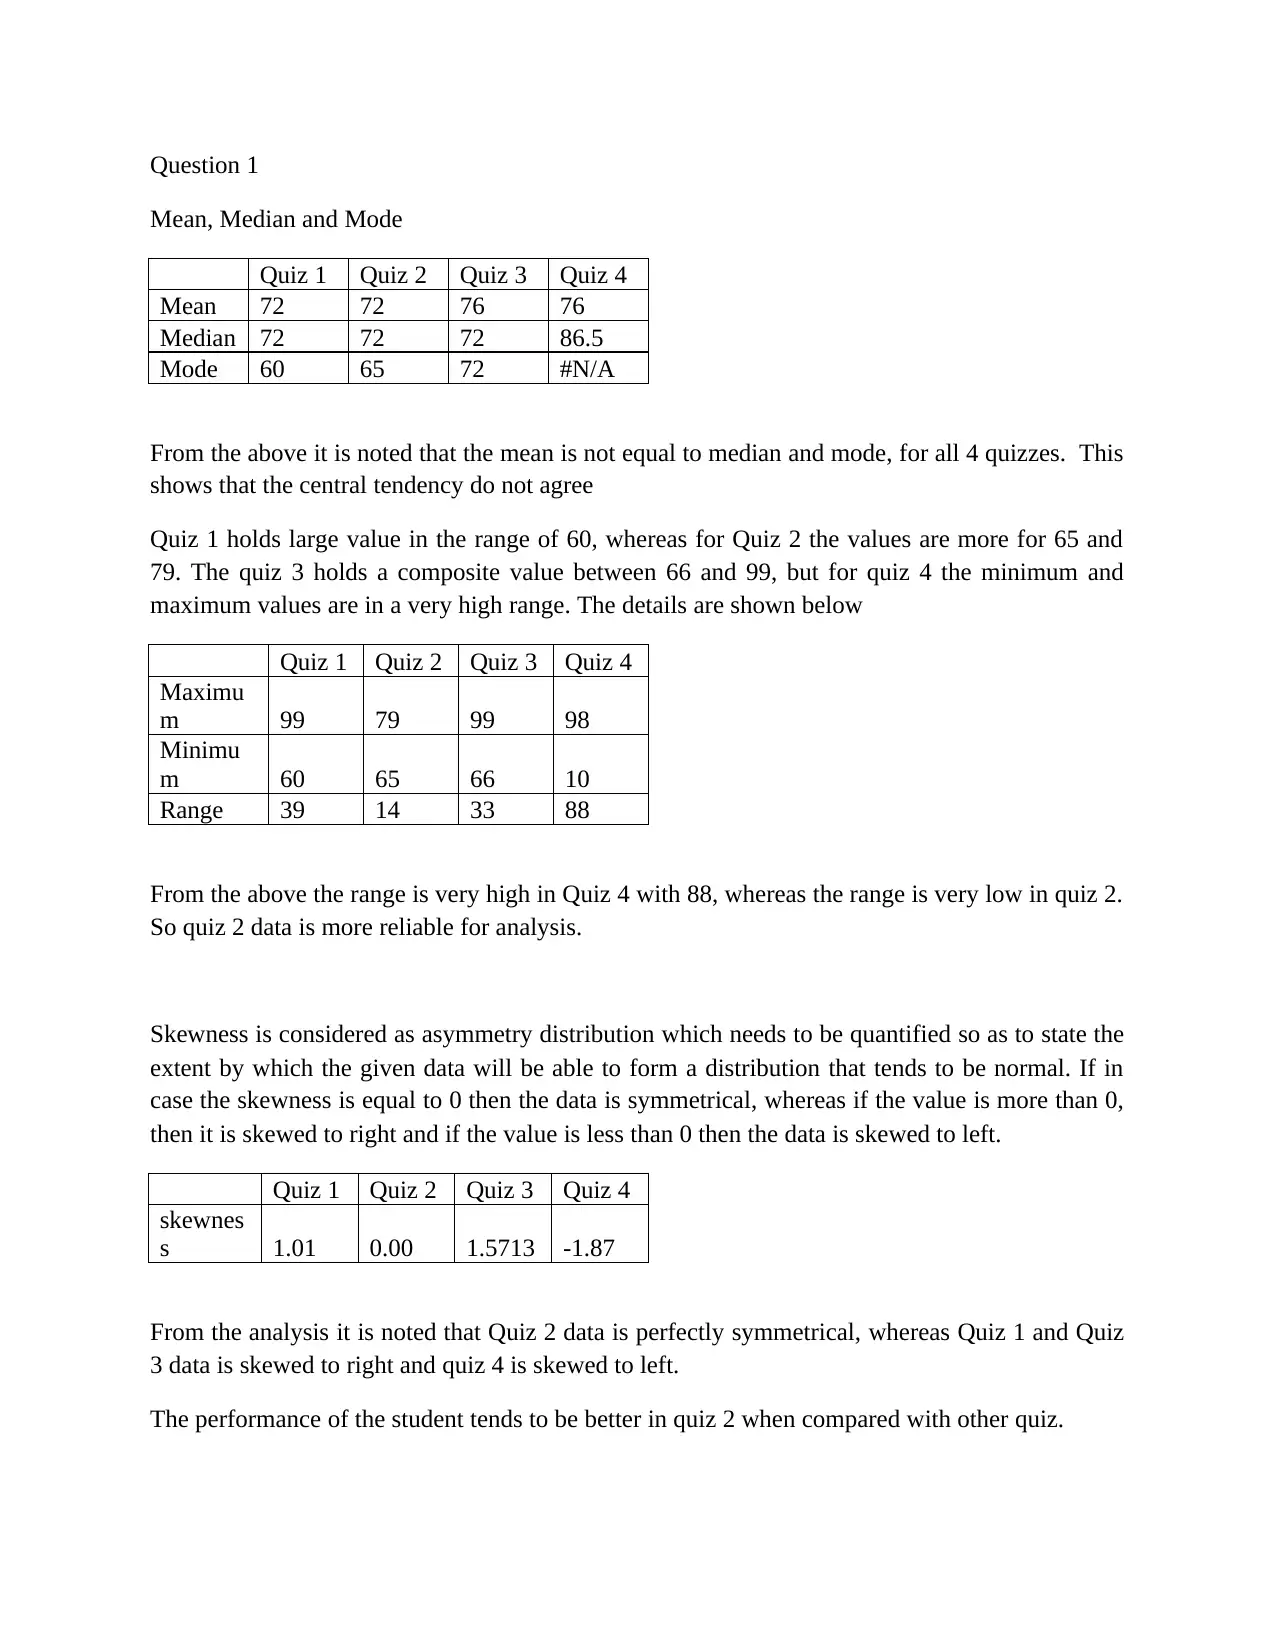
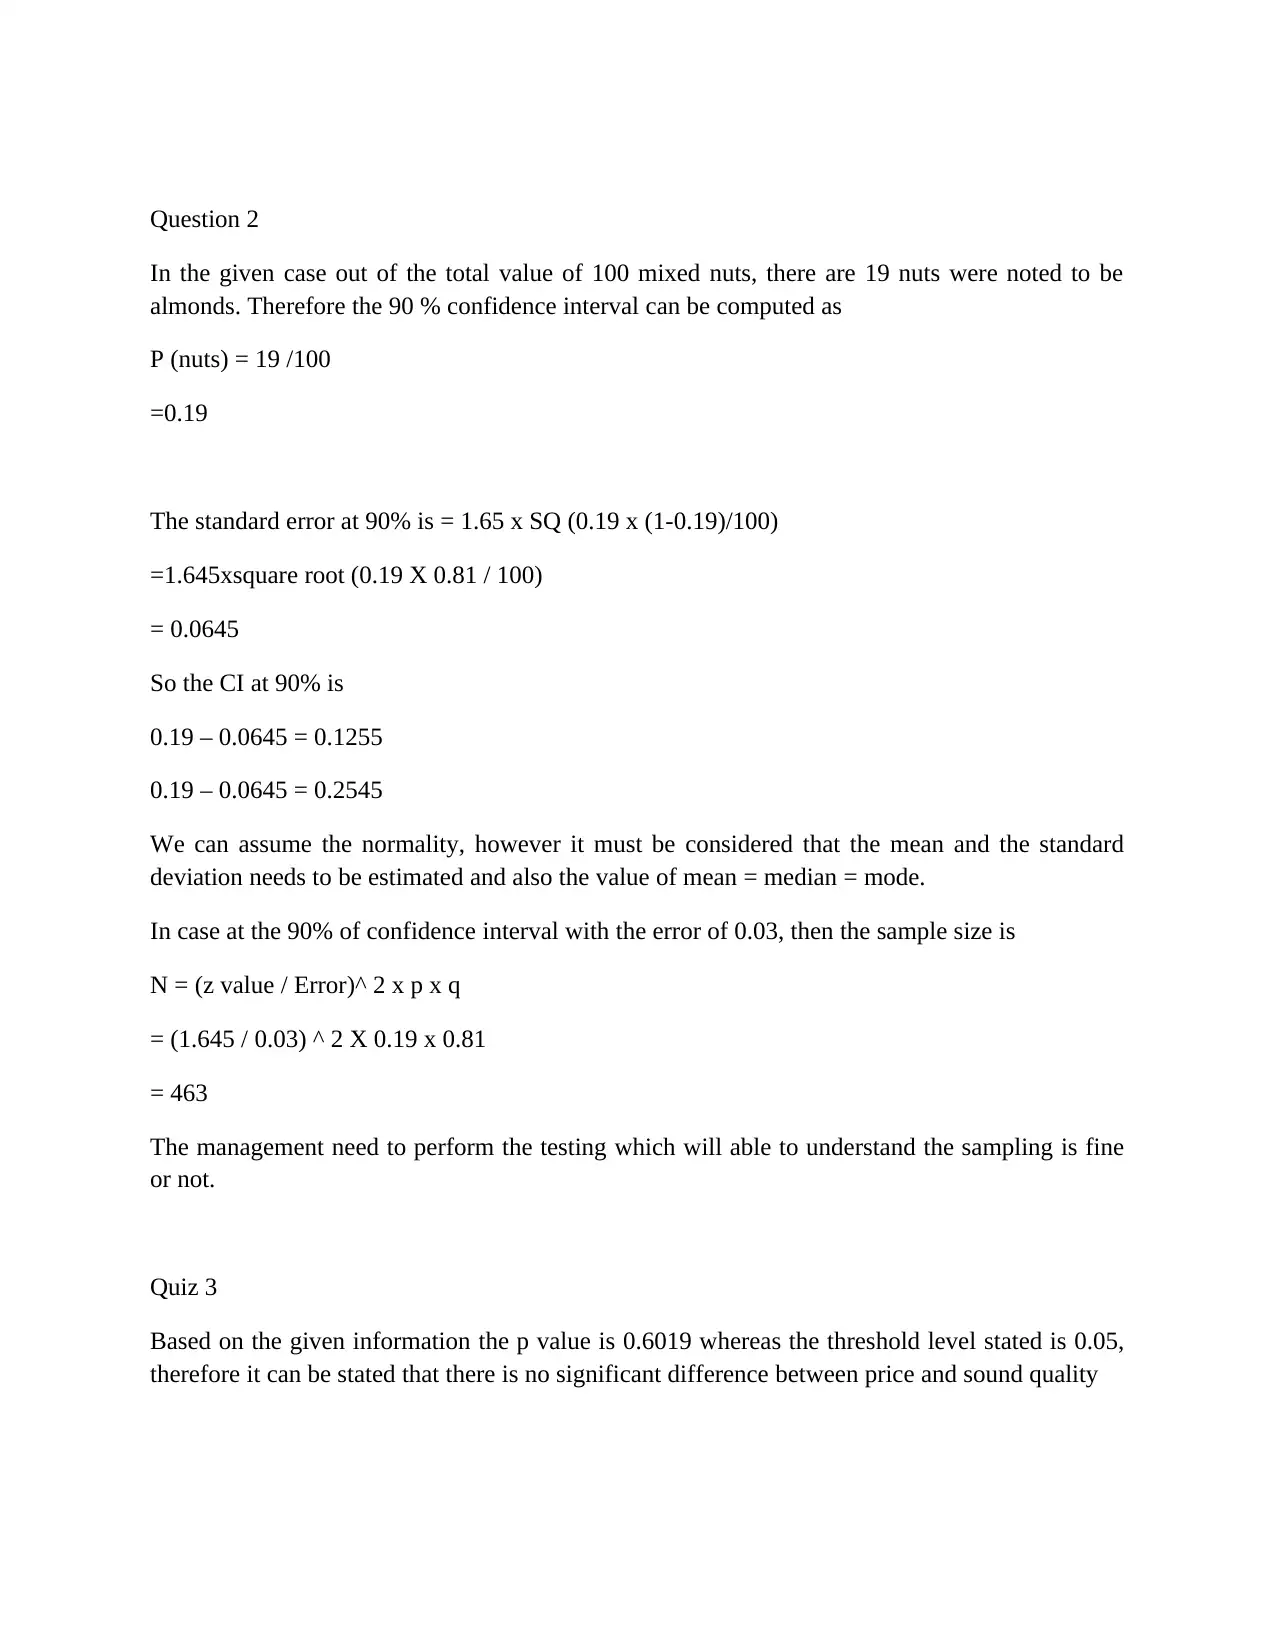
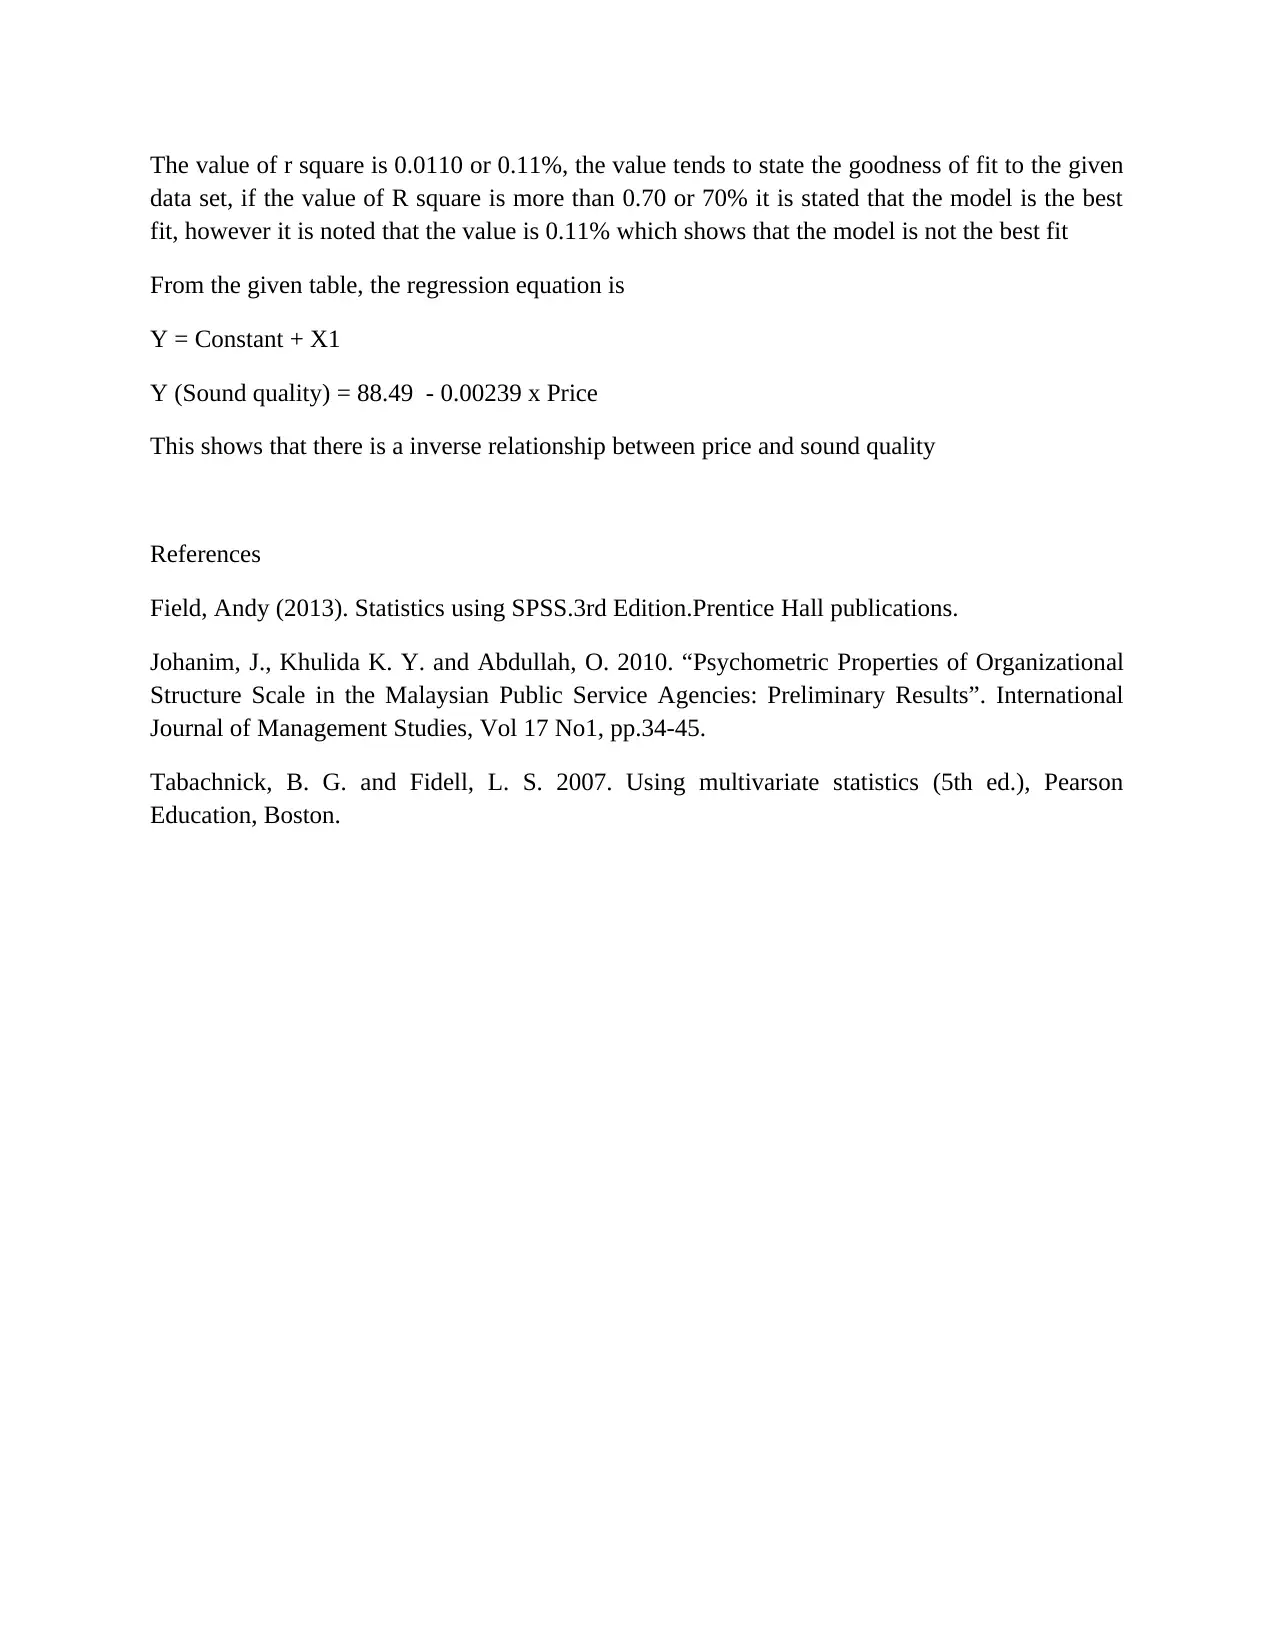
This assignment solution covers various statistical concepts, including the calculation and interpretation of mean, median, and mode for different quizzes. It analyzes the range and skewness of the data to determine the reliability and symmetry of the distributions. Furthermore, it demonstrates the computation of a 90% confidence interval for a proportion and determines the necessary sample size for a specified error margin. The assignment also evaluates the significance of the relationship between price and sound quality using p-values and R-squared, concluding with a regression equation illustrating the inverse relationship between these variables. Referencing statistical analysis techniques and resources, this solution provides a comprehensive understanding of the concepts and demonstrates practical application. Desklib is the perfect platform to explore more assignments and study resources.
tabler-icon-diamond-filled.svg

Contribute Materials

Your contribution can guide someone’s learning journey. Share your documents today.
Document Page
Question 1
Mean, Median and Mode
Quiz 1 Quiz 2 Quiz 3 Quiz 4
Mean 72 72 76 76
Median 72 72 72 86.5
Mode 60 65 72 #N/A
From the above it is noted that the mean is not equal to median and mode, for all 4 quizzes. This
shows that the central tendency do not agree
Quiz 1 holds large value in the range of 60, whereas for Quiz 2 the values are more for 65 and
79. The quiz 3 holds a composite value between 66 and 99, but for quiz 4 the minimum and
maximum values are in a very high range. The details are shown below
Quiz 1 Quiz 2 Quiz 3 Quiz 4
Maximu
m 99 79 99 98
Minimu
m 60 65 66 10
Range 39 14 33 88
From the above the range is very high in Quiz 4 with 88, whereas the range is very low in quiz 2.
So quiz 2 data is more reliable for analysis.
Skewness is considered as asymmetry distribution which needs to be quantified so as to state the
extent by which the given data will be able to form a distribution that tends to be normal. If in
case the skewness is equal to 0 then the data is symmetrical, whereas if the value is more than 0,
then it is skewed to right and if the value is less than 0 then the data is skewed to left.
Quiz 1 Quiz 2 Quiz 3 Quiz 4
skewnes
s 1.01 0.00 1.5713 -1.87
From the analysis it is noted that Quiz 2 data is perfectly symmetrical, whereas Quiz 1 and Quiz
3 data is skewed to right and quiz 4 is skewed to left.
The performance of the student tends to be better in quiz 2 when compared with other quiz.
tabler-icon-diamond-filled.svg

Secure Best Marks with AI Grader

Need help grading? Try our AI Grader for instant feedback on your assignments.
Document Page
Question 2
In the given case out of the total value of 100 mixed nuts, there are 19 nuts were noted to be
almonds. Therefore the 90 % confidence interval can be computed as
P (nuts) = 19 /100
=0.19
The standard error at 90% is = 1.65 x SQ (0.19 x (1-0.19)/100)
=1.645xsquare root (0.19 X 0.81 / 100)
= 0.0645
So the CI at 90% is
0.19 – 0.0645 = 0.1255
0.19 – 0.0645 = 0.2545
We can assume the normality, however it must be considered that the mean and the standard
deviation needs to be estimated and also the value of mean = median = mode.
In case at the 90% of confidence interval with the error of 0.03, then the sample size is
N = (z value / Error)^ 2 x p x q
= (1.645 / 0.03) ^ 2 X 0.19 x 0.81
= 463
The management need to perform the testing which will able to understand the sampling is fine
or not.
Quiz 3
Based on the given information the p value is 0.6019 whereas the threshold level stated is 0.05,
therefore it can be stated that there is no significant difference between price and sound quality
Document Page
The value of r square is 0.0110 or 0.11%, the value tends to state the goodness of fit to the given
data set, if the value of R square is more than 0.70 or 70% it is stated that the model is the best
fit, however it is noted that the value is 0.11% which shows that the model is not the best fit
From the given table, the regression equation is
Y = Constant + X1
Y (Sound quality) = 88.49 - 0.00239 x Price
This shows that there is a inverse relationship between price and sound quality
References
Field, Andy (2013). Statistics using SPSS.3rd Edition.Prentice Hall publications.
Johanim, J., Khulida K. Y. and Abdullah, O. 2010. “Psychometric Properties of Organizational
Structure Scale in the Malaysian Public Service Agencies: Preliminary Results”. International
Journal of Management Studies, Vol 17 No1, pp.34-45.
Tabachnick, B. G. and Fidell, L. S. 2007. Using multivariate statistics (5th ed.), Pearson
Education, Boston.
chevron_up_icon
1 out of 3
circle_padding
hide_on_mobile
zoom_out_icon
logo.png

Your All-in-One AI-Powered Toolkit for Academic Success.

Available 24*7 on WhatsApp / Email

[object Object]