Statistical Data Analysis: Interpretation and Application Report
VerifiedAdded on 2024/05/31
|6
|1074
|79
Homework Assignment
AI Summary
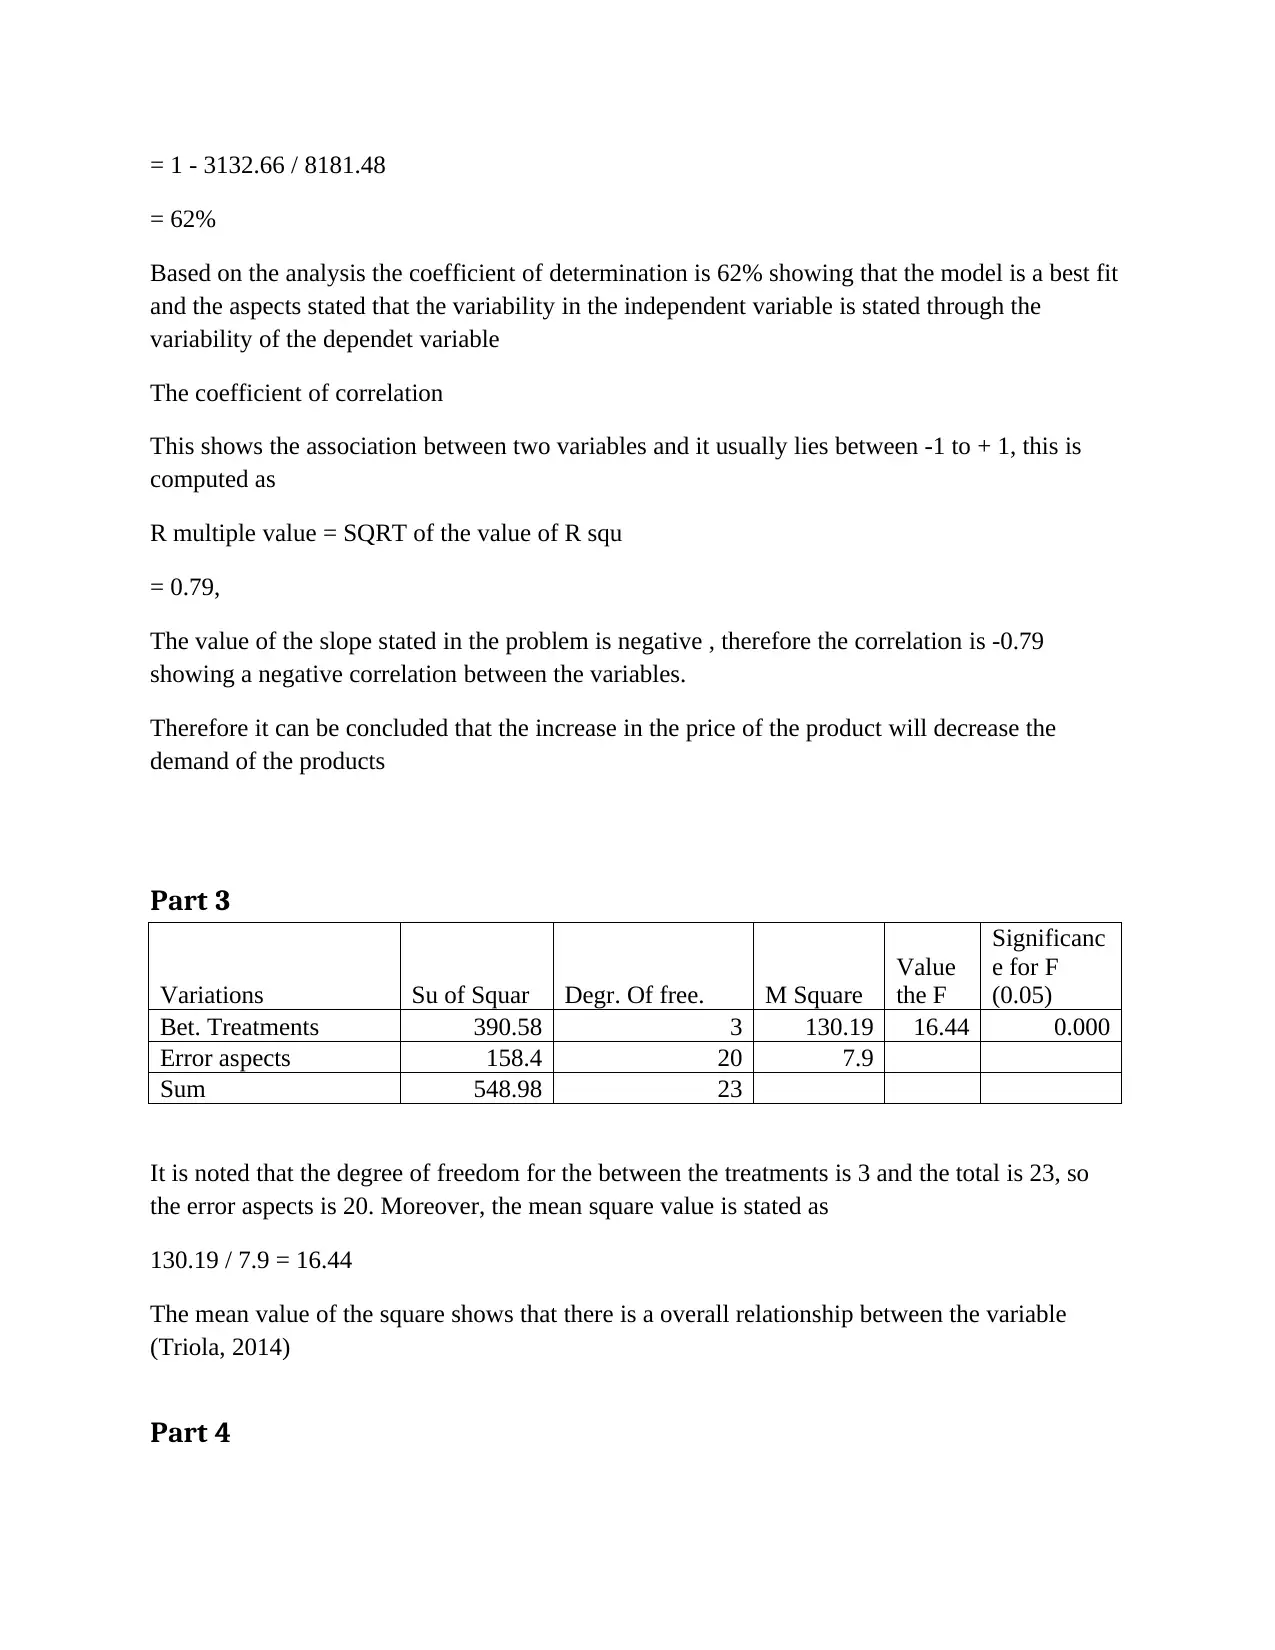
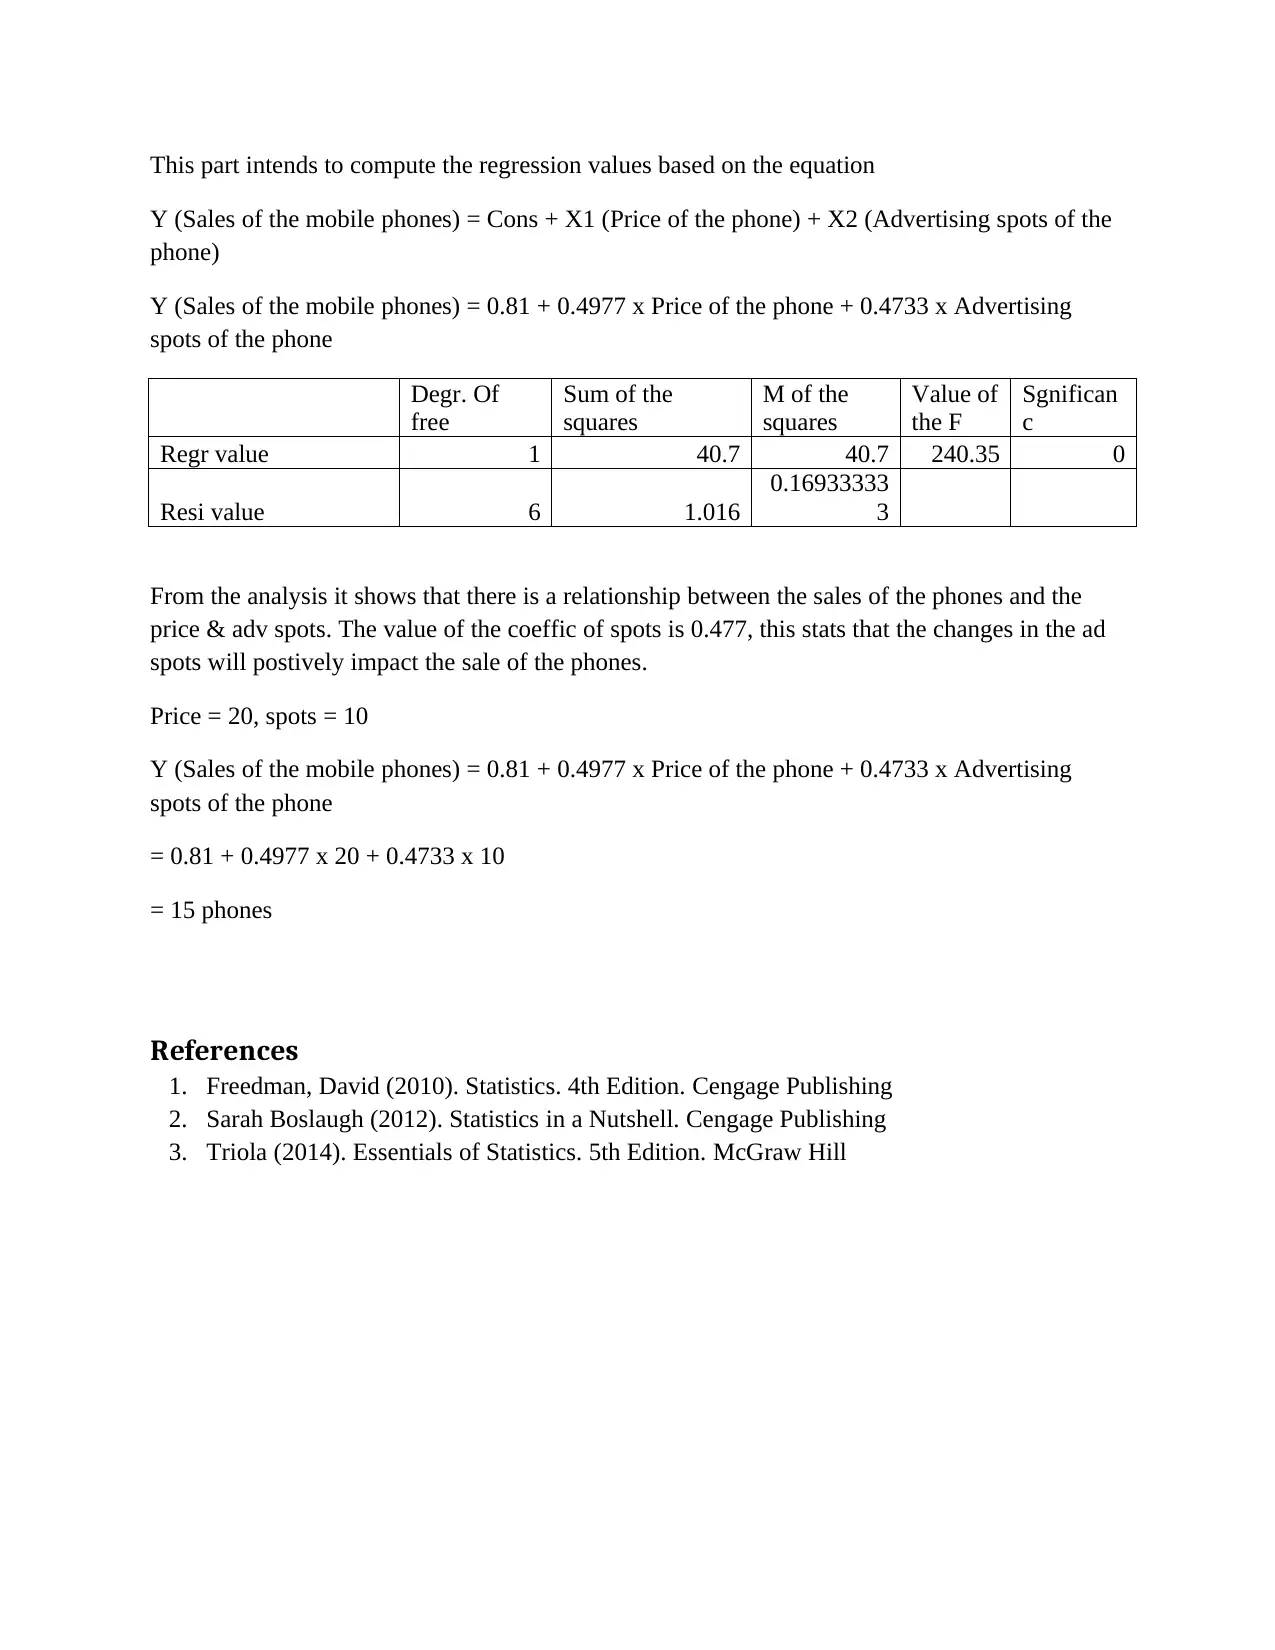
This assignment provides a comprehensive analysis of statistical data, starting with the creation and interpretation of a histogram based on a given dataset, focusing on identifying key order categories for business improvement. It then delves into Analysis of Variance (ANOVA) and regression analysis, interpreting F and p-values to determine the significance of the relationship between demand and price, and assessing the model's fit using the coefficient of determination. Further, the assignment examines variations between treatments and computes regression values to model sales of mobile phones based on price and advertising spots, ultimately demonstrating how changes in advertising positively impact sales. Desklib is a valuable resource for students seeking solved assignments and study materials.
1 out of 6
Related Documents


Your All-in-One AI-Powered Toolkit for Academic Success.
+13062052269
info@desklib.com
Available 24*7 on WhatsApp / Email
![[object Object]](/_next/static/media/star-bottom.7253800d.svg)
Copyright © 2020–2026 A2Z Services. All Rights Reserved. Developed and managed by ZUCOL.