Data Analysis: Applying Statistical Methods for Forecasting Trends

Verified

Added on  2023/06/14

|10
|1320
|123
Practical Assignment
AI Summary
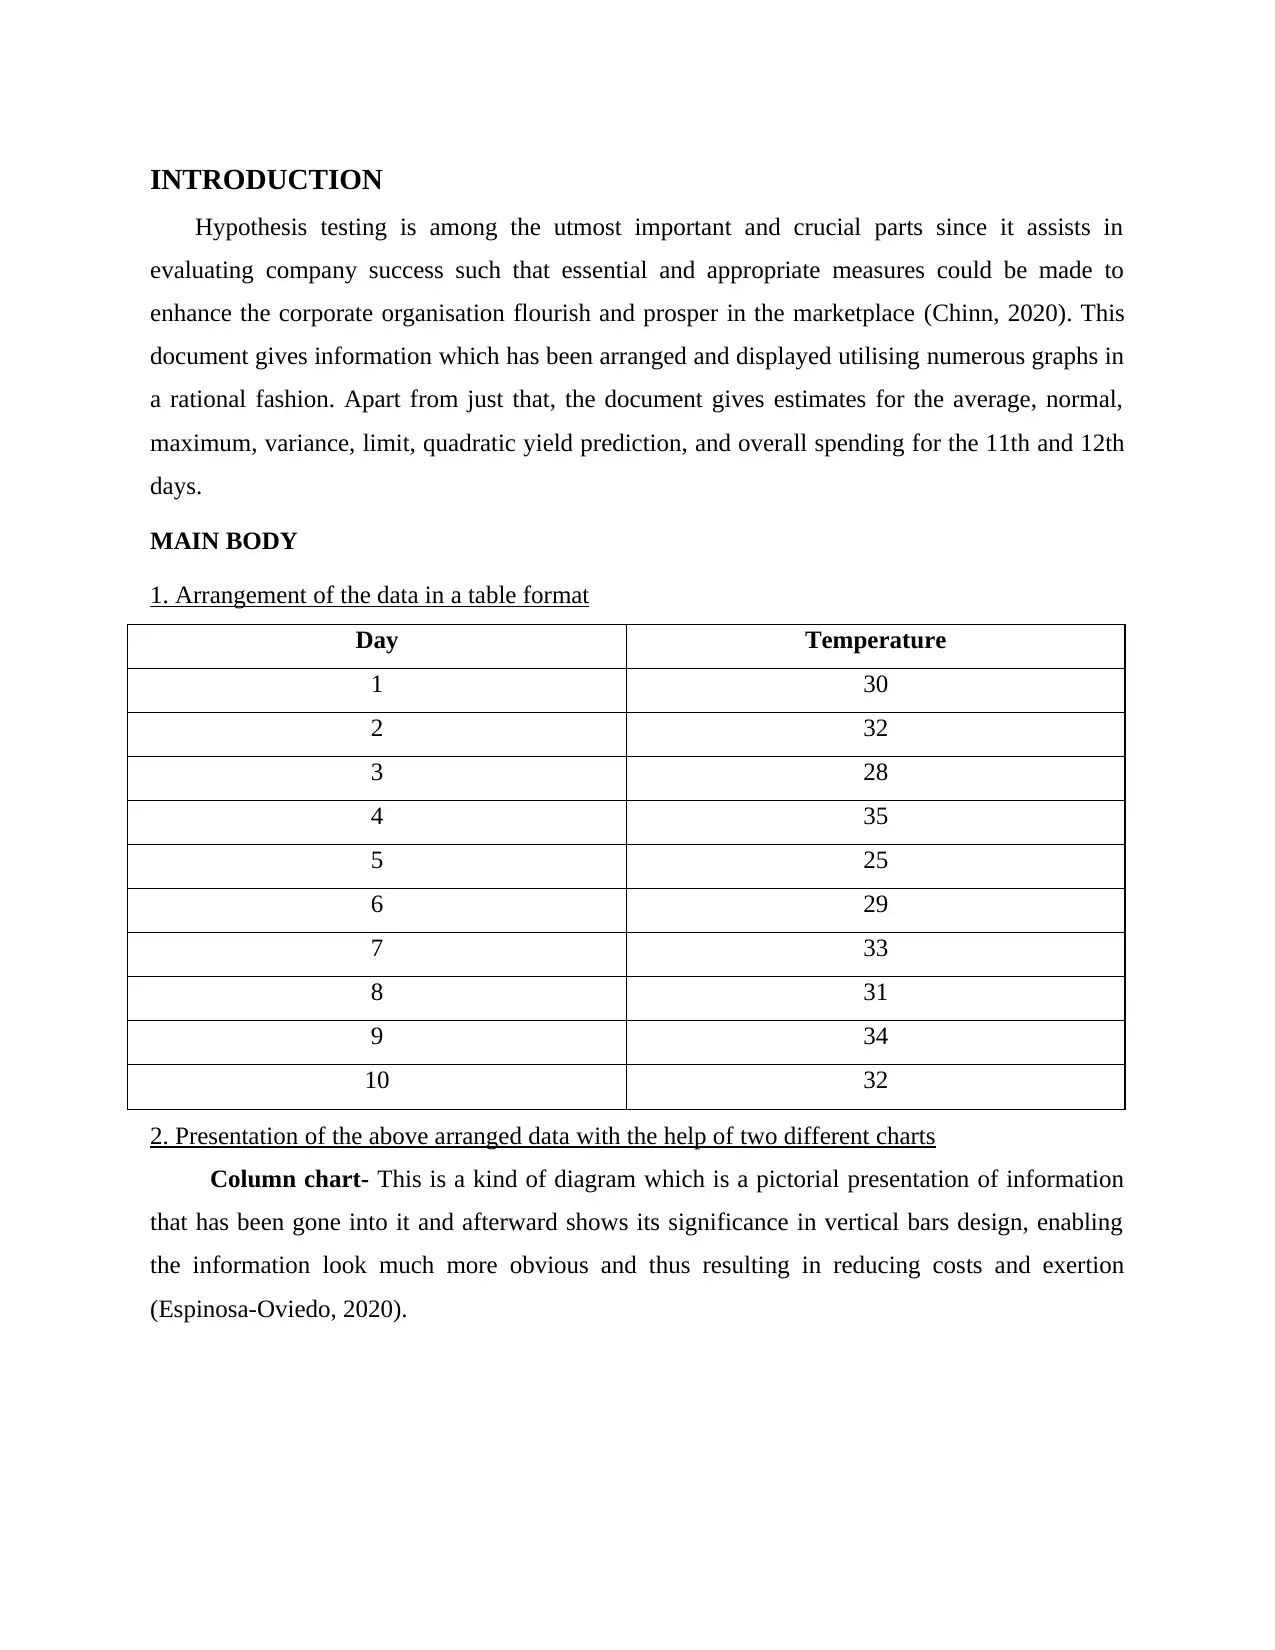
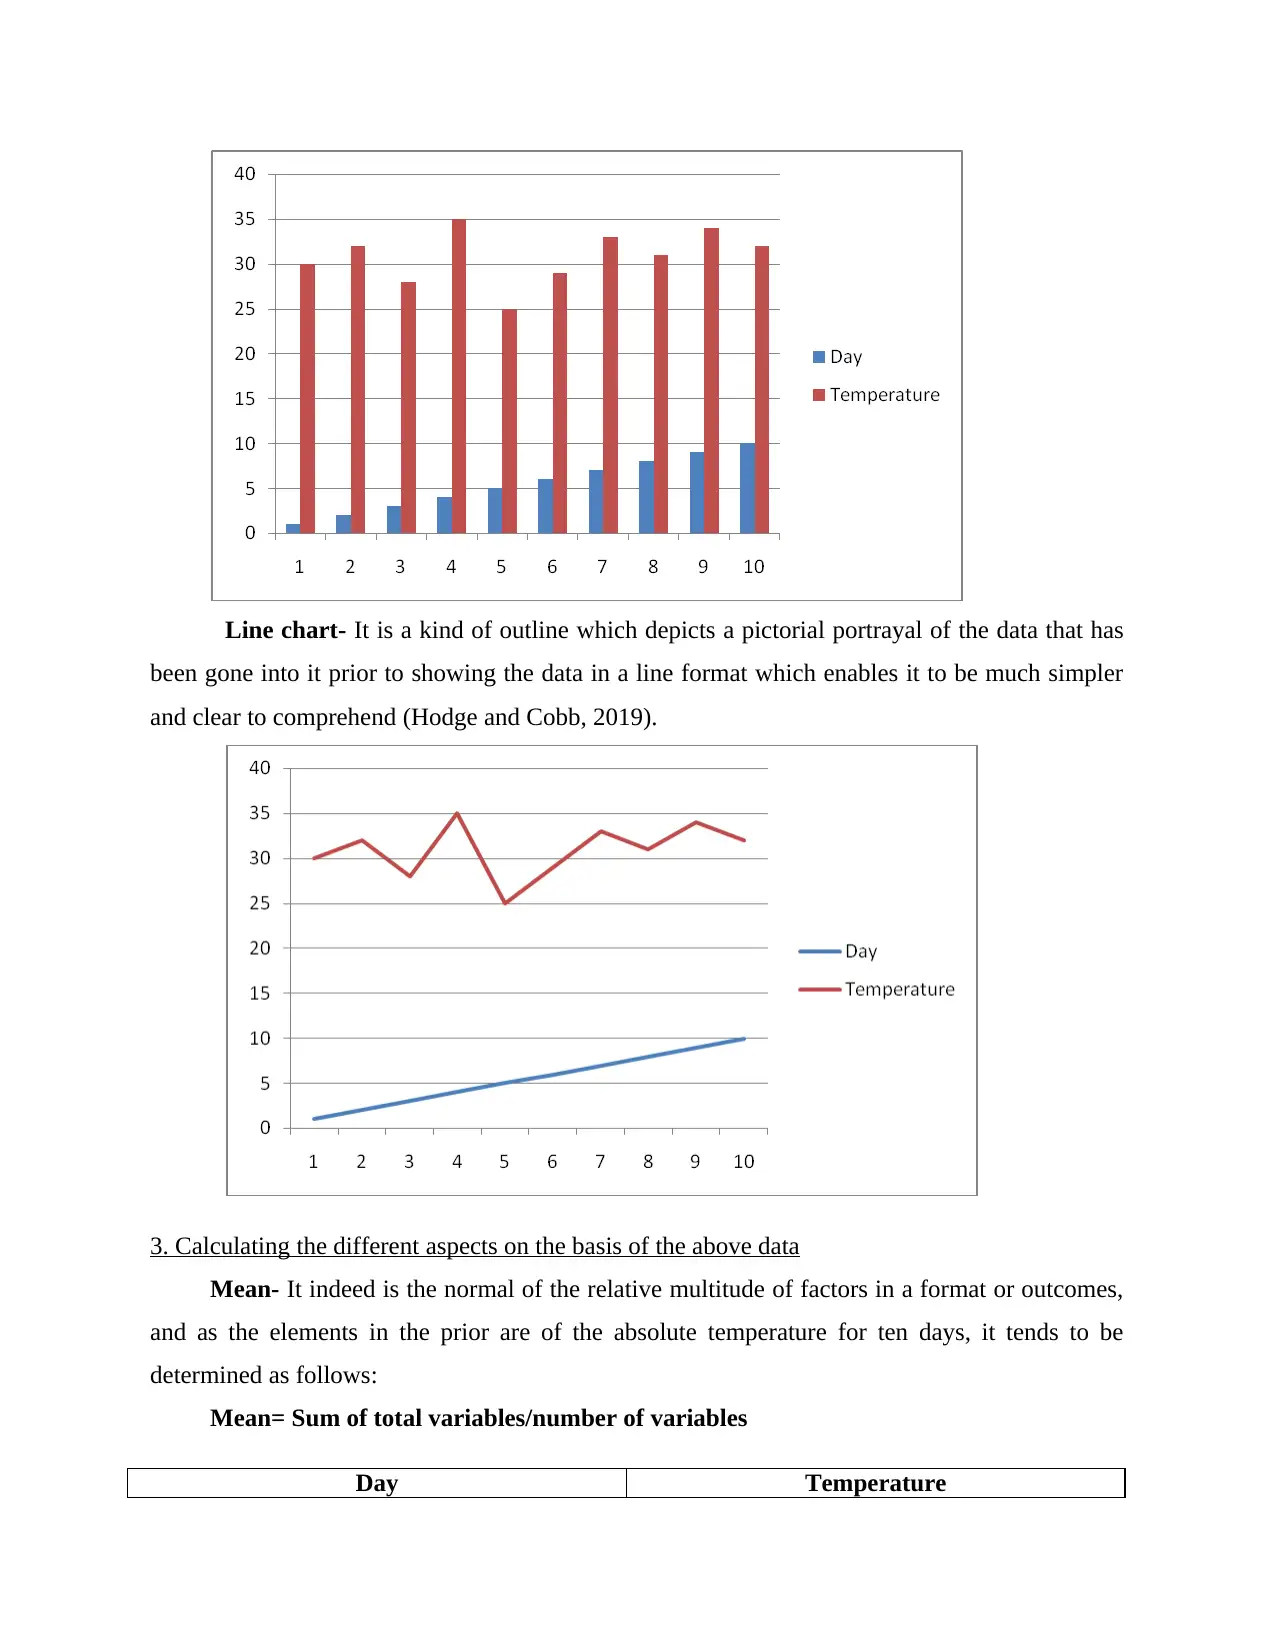
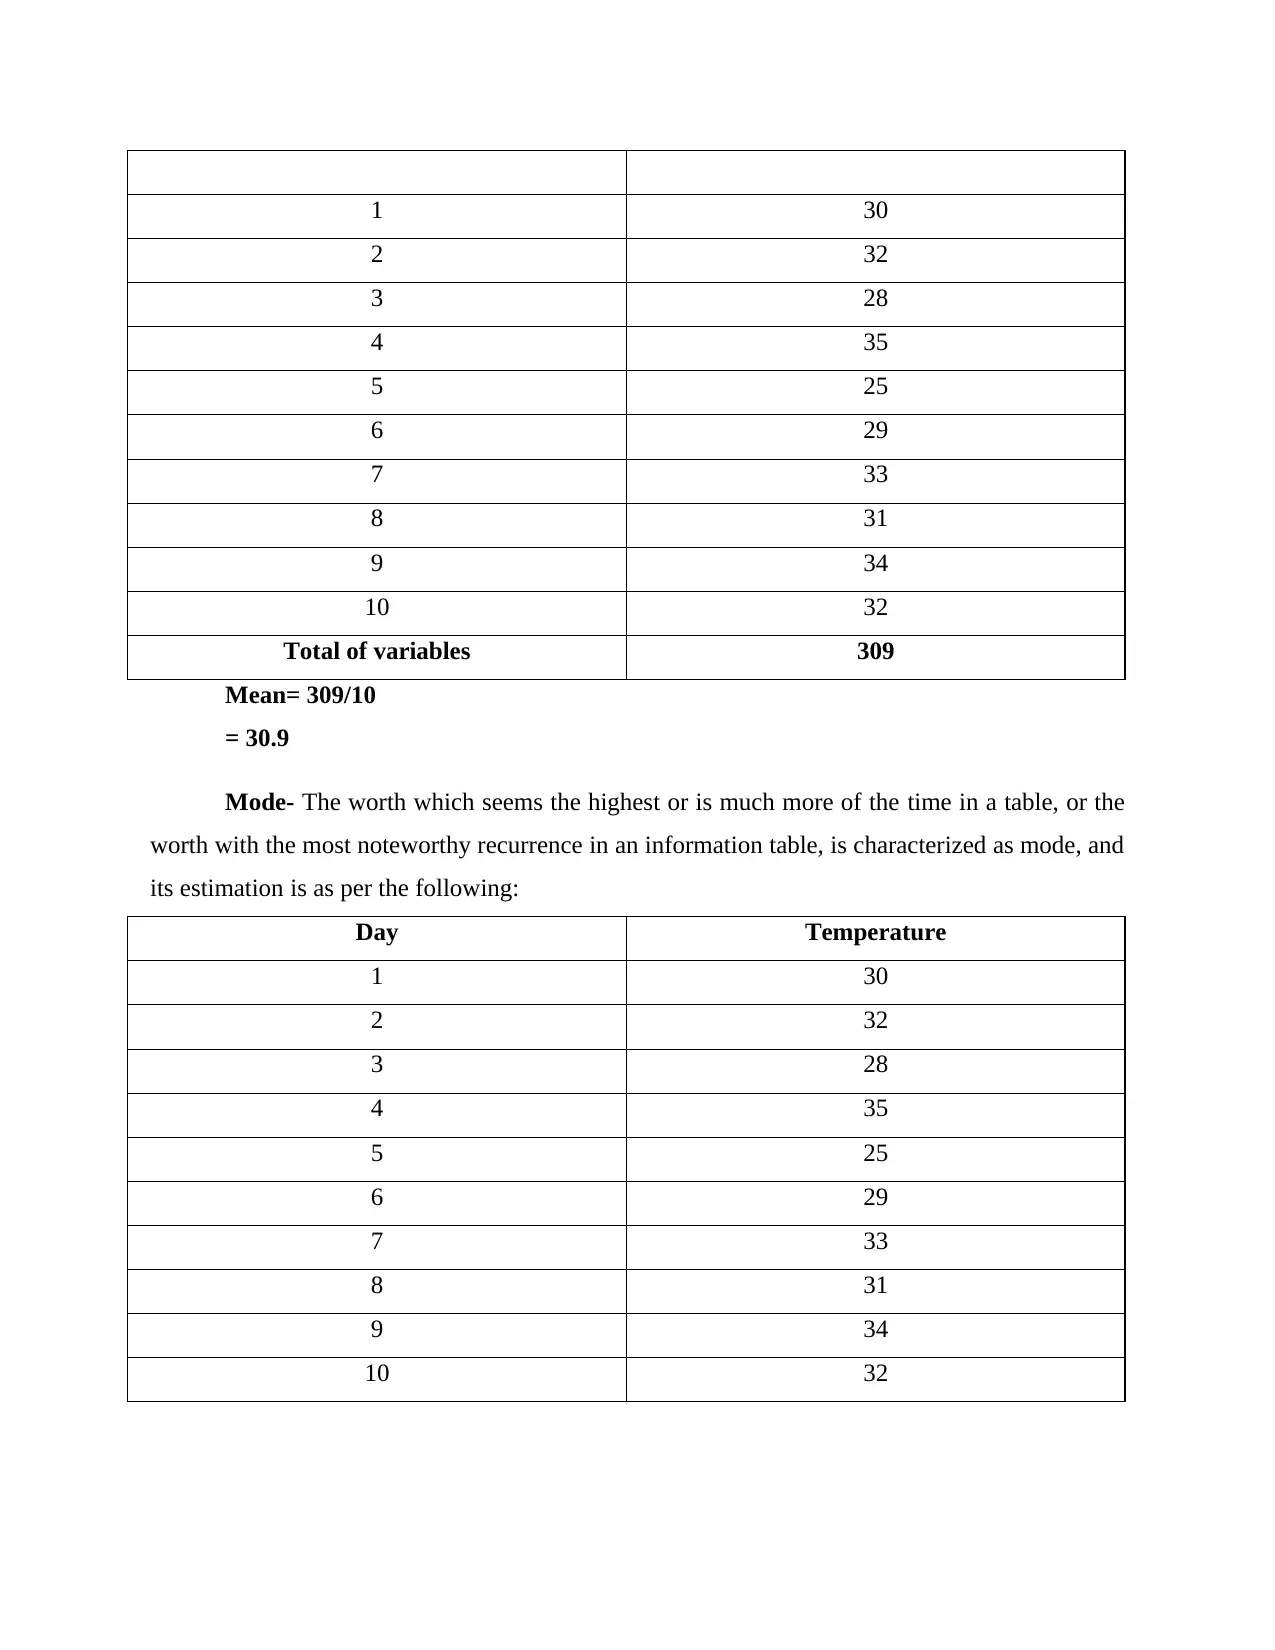
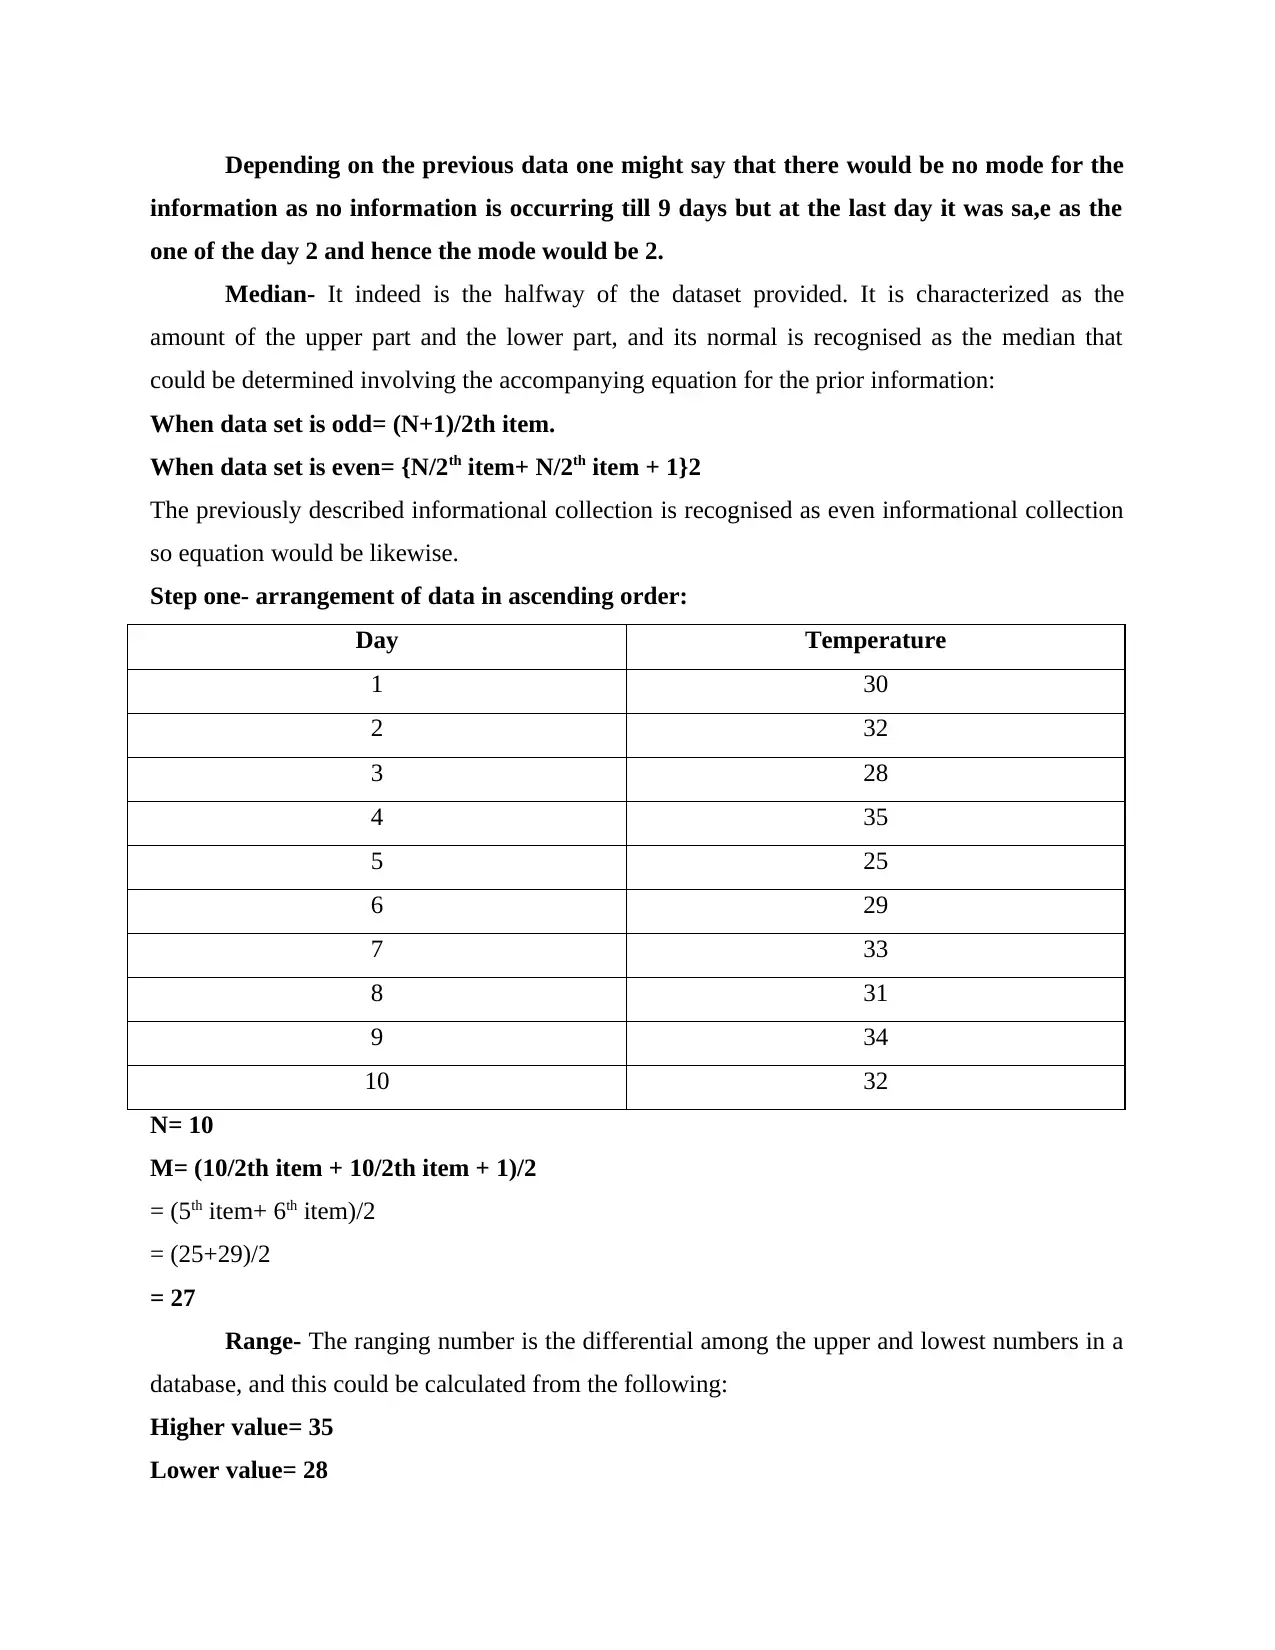
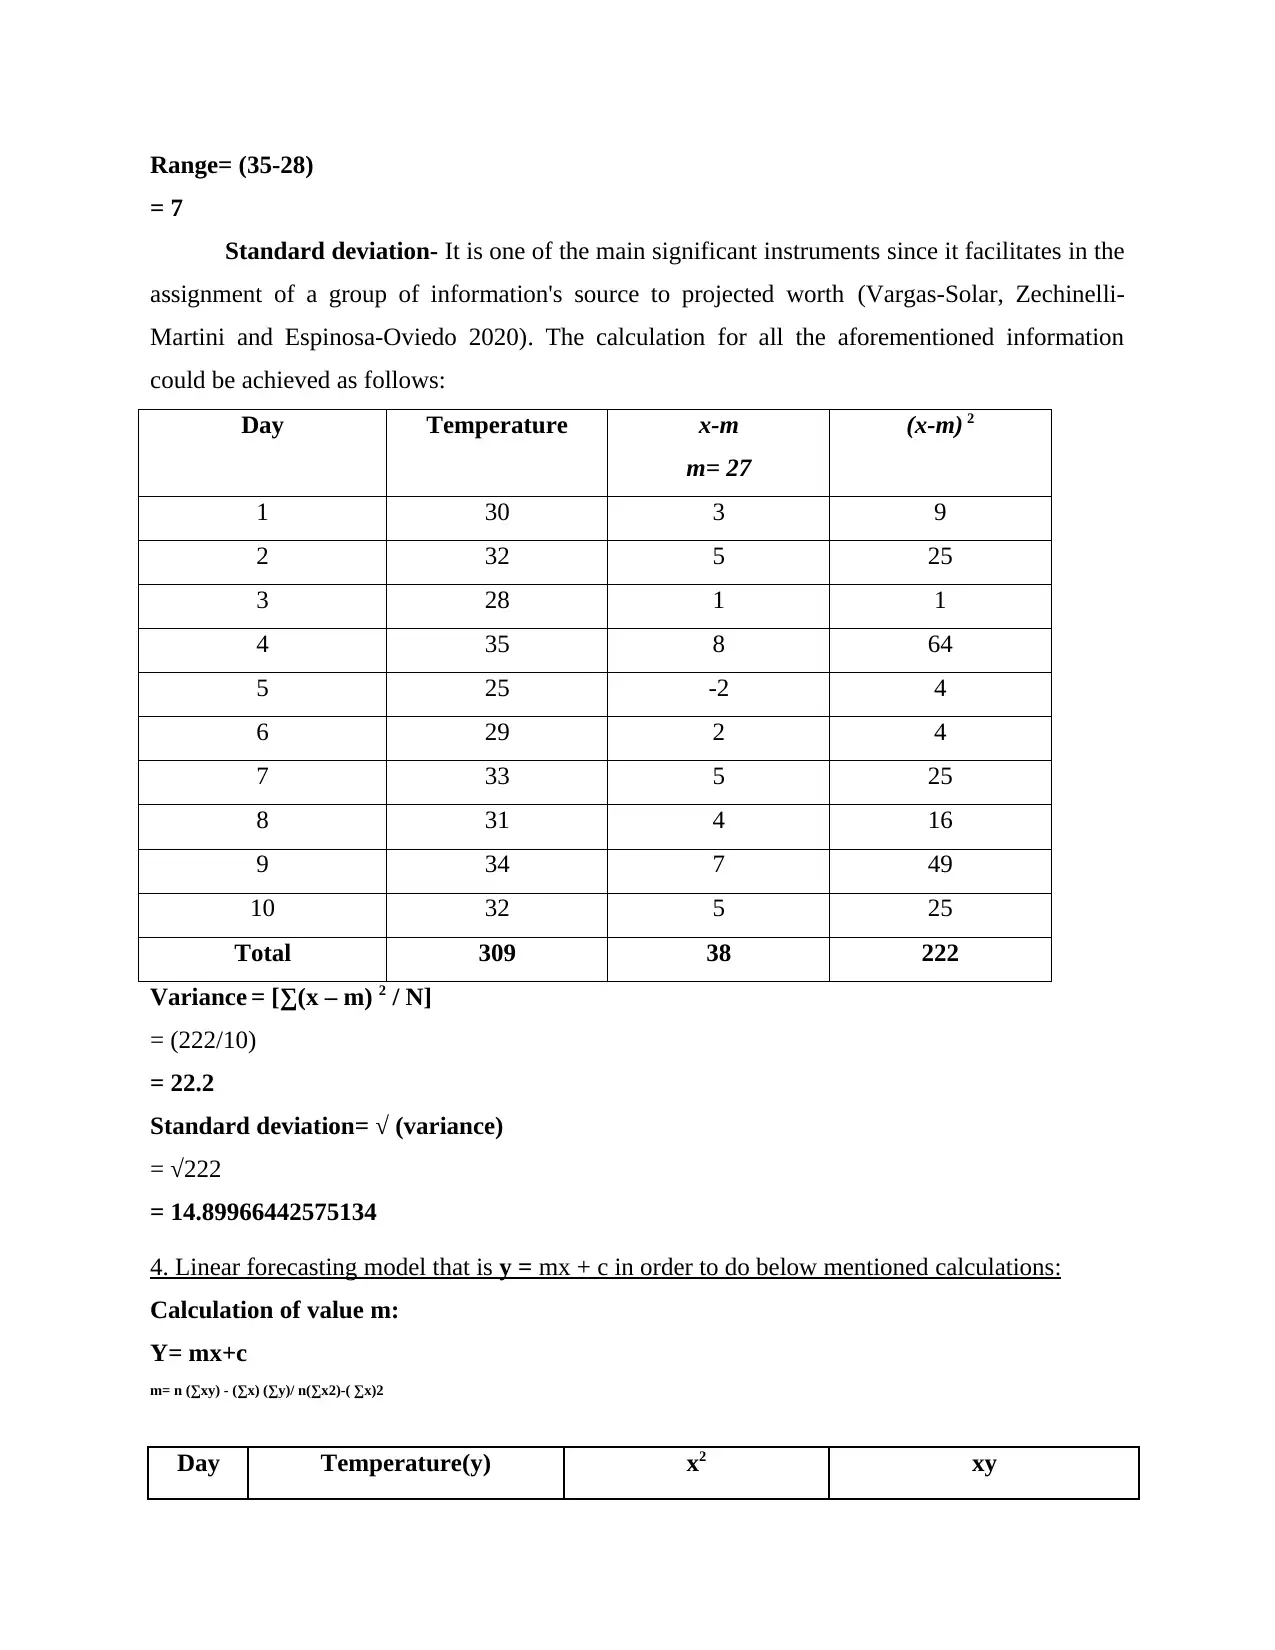
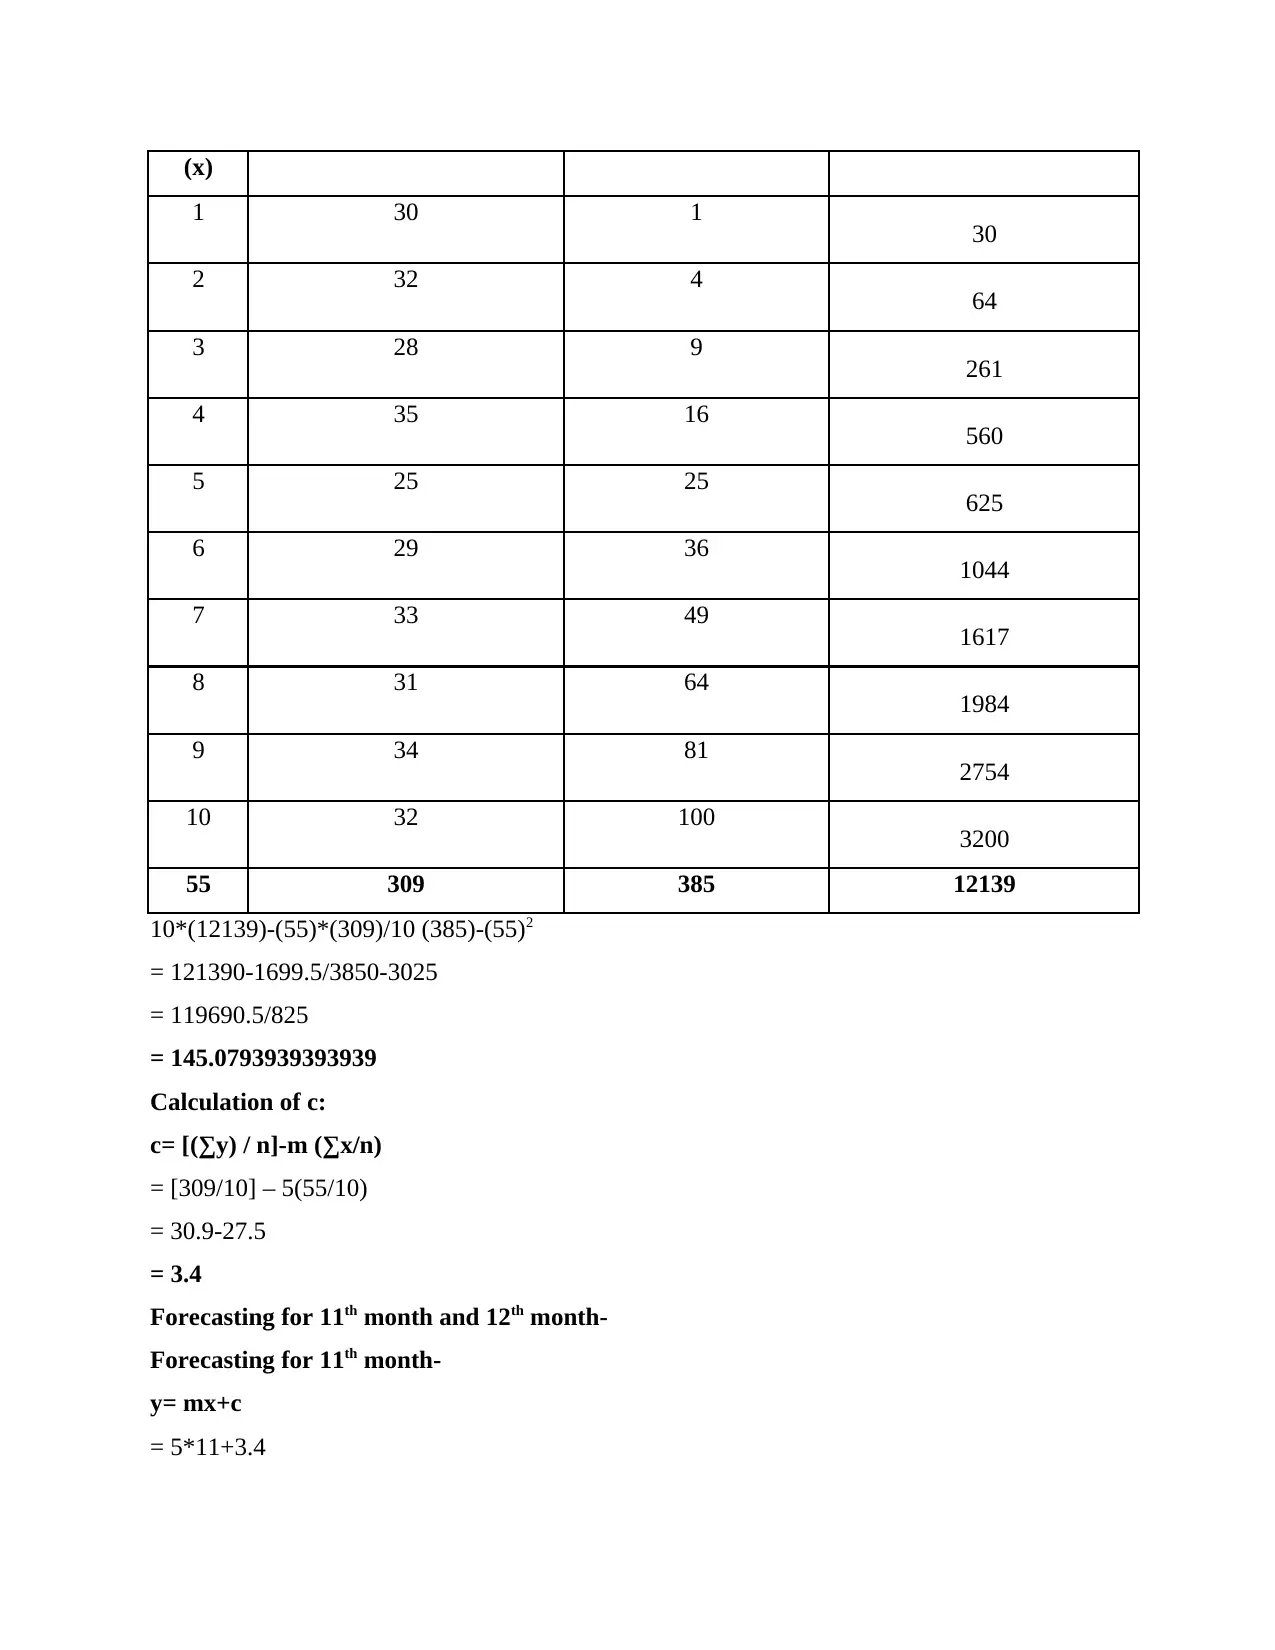
This assignment provides a comprehensive solution to a data analysis task, involving the arrangement of data, presentation through column and line charts, and calculation of statistical measures such as mean, mode, median, range, and standard deviation. It further applies a linear forecasting model (y = mx + c) to predict values for the 11th and 12th periods. The analysis includes detailed steps for calculating 'm' and 'c' in the linear equation and concludes by emphasizing the importance of statistical assessment in organizational decision-making. Desklib offers a variety of similar resources and study tools for students.
Document Page
Numeracy and data
analysis
tabler-icon-diamond-filled.svg

Paraphrase This Document

Need a fresh take? Get an instant paraphrase of this document with our AI Paraphraser
Document Page
Contents
Contents...........................................................................................................................................2
INTRODUCTION...........................................................................................................................1
MAIN BODY..................................................................................................................................1
1. Arrangement of the data in a table format...............................................................................1
2. Presentation of the above arranged data with the help of two different charts........................1
3. Calculating the different aspects on the basis of the above data.............................................2
4. Linear forecasting model that is y = mx + c in order to do below mentioned calculations:....5
CONCLUSION................................................................................................................................7
REFERENCES................................................................................................................................8
Document Page
INTRODUCTION
Hypothesis testing is among the utmost important and crucial parts since it assists in
evaluating company success such that essential and appropriate measures could be made to
enhance the corporate organisation flourish and prosper in the marketplace (Chinn, 2020). This
document gives information which has been arranged and displayed utilising numerous graphs in
a rational fashion. Apart from just that, the document gives estimates for the average, normal,
maximum, variance, limit, quadratic yield prediction, and overall spending for the 11th and 12th
days.
MAIN BODY
1. Arrangement of the data in a table format
Day Temperature
1 30
2 32
3 28
4 35
5 25
6 29
7 33
8 31
9 34
10 32
2. Presentation of the above arranged data with the help of two different charts
Column chart- This is a kind of diagram which is a pictorial presentation of information
that has been gone into it and afterward shows its significance in vertical bars design, enabling
the information look much more obvious and thus resulting in reducing costs and exertion
(Espinosa-Oviedo, 2020).
Document Page
Line chart- It is a kind of outline which depicts a pictorial portrayal of the data that has
been gone into it prior to showing the data in a line format which enables it to be much simpler
and clear to comprehend (Hodge and Cobb, 2019).
3. Calculating the different aspects on the basis of the above data
Mean- It indeed is the normal of the relative multitude of factors in a format or outcomes,
and as the elements in the prior are of the absolute temperature for ten days, it tends to be
determined as follows:
Mean= Sum of total variables/number of variables
Day Temperature
tabler-icon-diamond-filled.svg

Paraphrase This Document

Need a fresh take? Get an instant paraphrase of this document with our AI Paraphraser
Document Page
1 30
2 32
3 28
4 35
5 25
6 29
7 33
8 31
9 34
10 32
Total of variables 309
Mean= 309/10
= 30.9
Mode- The worth which seems the highest or is much more of the time in a table, or the
worth with the most noteworthy recurrence in an information table, is characterized as mode, and
its estimation is as per the following:
Day Temperature
1 30
2 32
3 28
4 35
5 25
6 29
7 33
8 31
9 34
10 32
Document Page
Depending on the previous data one might say that there would be no mode for the
information as no information is occurring till 9 days but at the last day it was sa,e as the
one of the day 2 and hence the mode would be 2.
Median- It indeed is the halfway of the dataset provided. It is characterized as the
amount of the upper part and the lower part, and its normal is recognised as the median that
could be determined involving the accompanying equation for the prior information:
When data set is odd= (N+1)/2th item.
When data set is even= {N/2th item+ N/2th item + 1}2
The previously described informational collection is recognised as even informational collection
so equation would be likewise.
Step one- arrangement of data in ascending order:
Day Temperature
1 30
2 32
3 28
4 35
5 25
6 29
7 33
8 31
9 34
10 32
N= 10
M= (10/2th item + 10/2th item + 1)/2
= (5th item+ 6th item)/2
= (25+29)/2
= 27
Range- The ranging number is the differential among the upper and lowest numbers in a
database, and this could be calculated from the following:
Higher value= 35
Lower value= 28
Document Page
Range= (35-28)
= 7
Standard deviation- It is one of the main significant instruments since it facilitates in the
assignment of a group of information's source to projected worth (Vargas-Solar, Zechinelli-
Martini and Espinosa-Oviedo 2020). The calculation for all the aforementioned information
could be achieved as follows:
Day Temperature x-m
m= 27
(x-m) 2
1 30 3 9
2 32 5 25
3 28 1 1
4 35 8 64
5 25 -2 4
6 29 2 4
7 33 5 25
8 31 4 16
9 34 7 49
10 32 5 25
Total 309 38 222
Variance = [∑(x – m) 2 / N]
= (222/10)
= 22.2
Standard deviation= √ (variance)
= √222
= 14.89966442575134
4. Linear forecasting model that is y = mx + c in order to do below mentioned calculations:
Calculation of value m:
Y= mx+c
m= n (∑xy) - (∑x) (∑y)/ n(∑x2)-( ∑x)2
Day Temperature(y) x2 xy
tabler-icon-diamond-filled.svg

Paraphrase This Document

Need a fresh take? Get an instant paraphrase of this document with our AI Paraphraser
Document Page
(x)
1 30 1 30
2 32 4 64
3 28 9 261
4 35 16 560
5 25 25 625
6 29 36 1044
7 33 49 1617
8 31 64 1984
9 34 81 2754
10 32 100 3200
55 309 385 12139
10*(12139)-(55)*(309)/10 (385)-(55)2
= 121390-1699.5/3850-3025
= 119690.5/825
= 145.0793939393939
Calculation of c:
c= [(∑y) / n]-m (∑x/n)
= [309/10] – 5(55/10)
= 30.9-27.5
= 3.4
Forecasting for 11th month and 12th month-
Forecasting for 11th month-
y= mx+c
= 5*11+3.4
Document Page
= 58.4
Forecasting for 12th month-
= 5*12+3.4
= 63.4
CONCLUSION
Statistical assessment is a critical aspect for just about any organization that works in the
marketplace, irrespective of the industry where it works, because it helps in thoroughly
reviewing all of the variables that impact the daily finances so that necessary measures may be
made fast. Besides that, every one of the computations conducted previously, like mean, mode,
median, range, and standard deviation, could be extrapolated to be crucial in assessing the
company's current genuine placement.
Document Page
REFERENCES
Books and journals
Chinn, S., 2020. The trouble with maths: A practical guide to helping learners with numeracy
difficulties. Routledge.
Espinosa-Oviedo, J.A., 2020. Enacting Data Science Pipelines for Exploring Graphs: From
Libraries to Studios. In ADBIS, TPDL and EDA 2020 Common Workshops and
Doctoral Consortium: International Workshops: DOING, MADEISD, SKG, BBIGAP,
SIMPDA, AIMinScience 2020 and Doctoral Consortium, Lyon, France, August 25-27,
2020, Proceedings (Vol. 1260, p. 271). Springer Nature.
Hodge, L. L. and Cobb, P., 2019. Two views of culture and their implications for mathematics
teaching and learning. Urban Education. 54(6). pp.860-884.
Vargas-Solar, G., Zechinelli-Martini, J.L. and Espinosa-Oviedo, J.A., 2020, August. Enacting
data science pipelines for exploring graphs: from libraries to studios. In ADBIS, TPDL
and EDA 2020 Common Workshops and Doctoral Consortium (pp. 271-280). Springer,
Cham.
chevron_up_icon
1 out of 10
circle_padding
hide_on_mobile
zoom_out_icon
[object Object]