Report on Data Analysis, Statistics, and Linear Forecasting

Verified

Added on  2022/11/24

|11
|1672
|184
Report
AI Summary
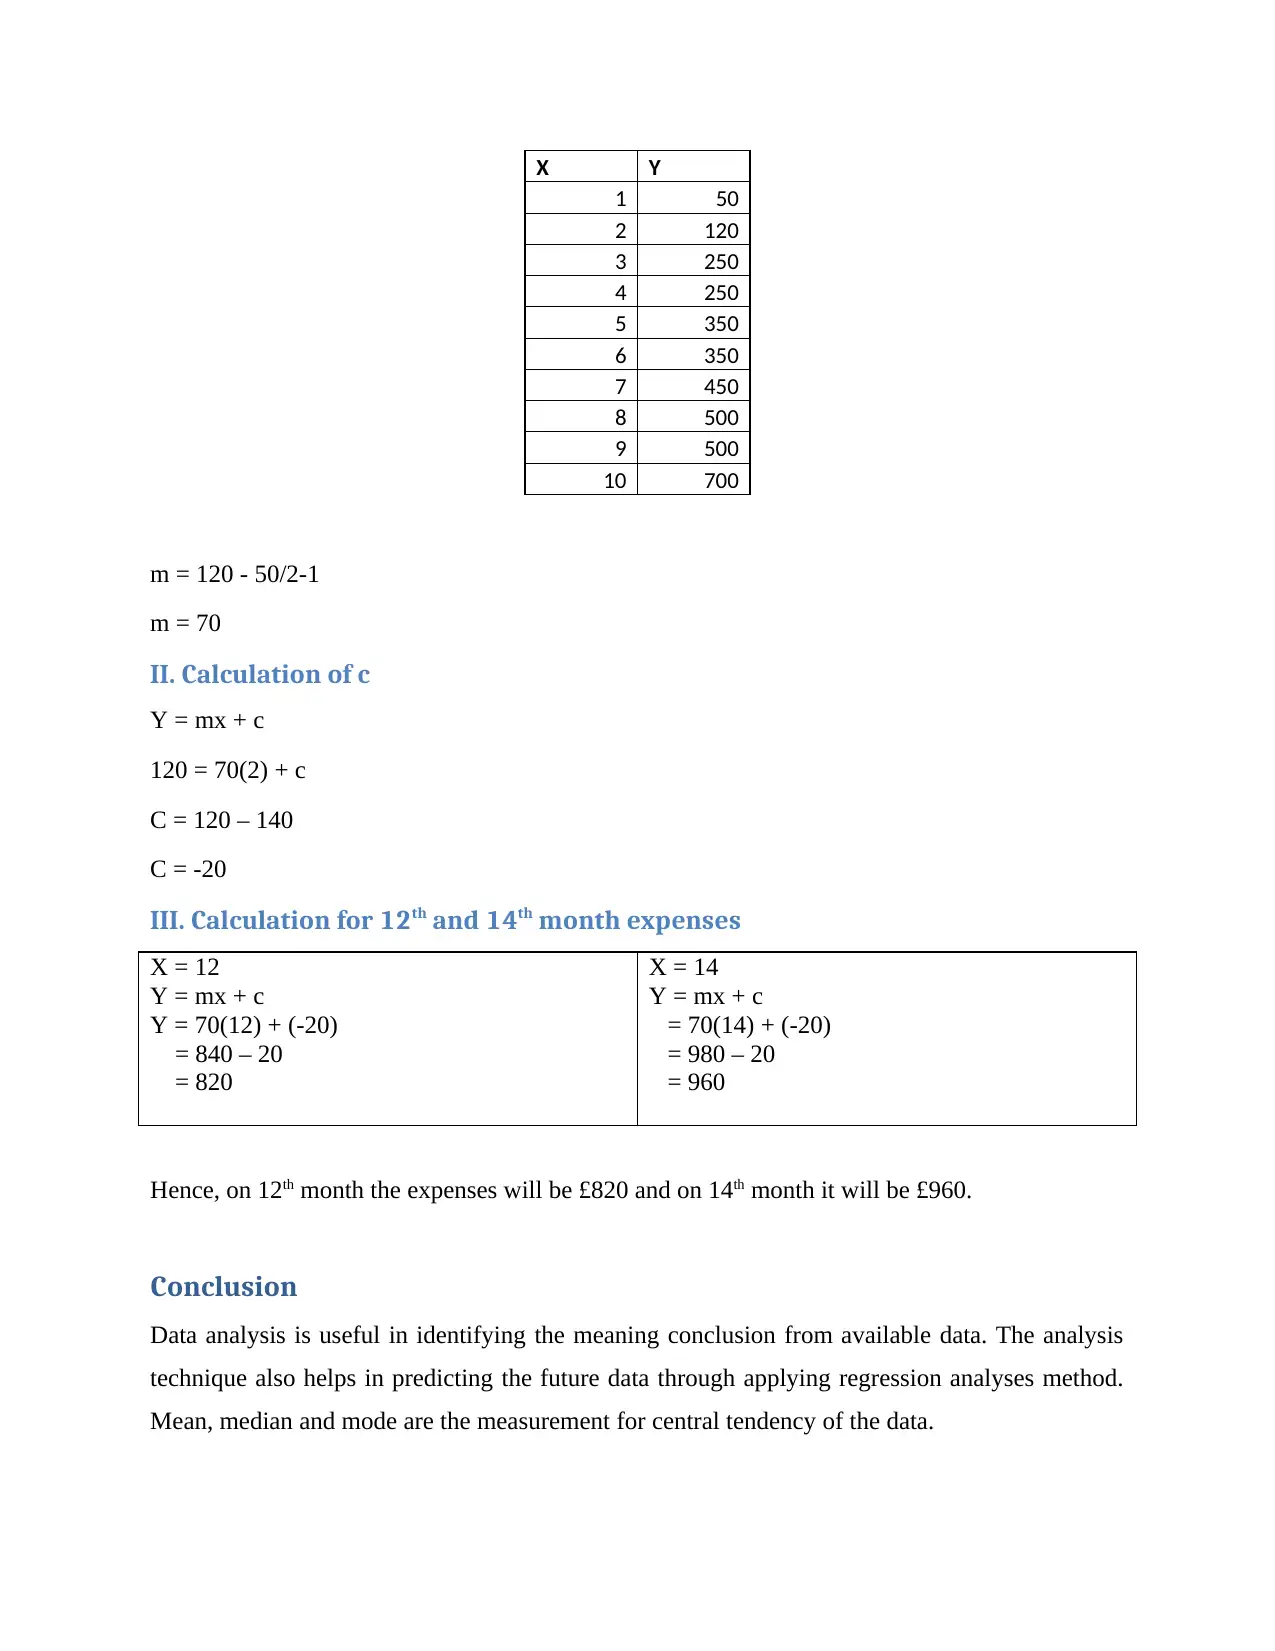
This report provides a comprehensive analysis of a dataset, encompassing various statistical methods and calculations. The data is first presented in a tabular format and visualized using column and line charts. The report then delves into the calculation of key statistical measures, including the mean, median, mode, range, and standard deviation, providing detailed explanations and formulas for each. Furthermore, the assignment explores linear forecasting using the y = mx + c model, calculating the slope (m) and y-intercept (c) to predict future expenses. The report concludes with predictions for expenses on the 12th and 14th days, demonstrating the practical application of the linear forecasting model. References from various academic sources support the analysis and methodology used throughout the report. This report is available on Desklib, a platform offering AI-based study tools.
Document Page
Numeracy
and
Data Analysis
tabler-icon-diamond-filled.svg

Paraphrase This Document

Need a fresh take? Get an instant paraphrase of this document with our AI Paraphraser
Document Page
Table of Contents
1. Arrange the data in table format..................................................................................................3
2. Present the data in column chart and line chart...........................................................................3
3. Calculation of mean, median, mode, range and standard deviation............................................4
I. Mean:........................................................................................................................................4
II. Median:...................................................................................................................................5
III. Mode:.....................................................................................................................................6
IV. Range:....................................................................................................................................6
V. Standard deviation:.................................................................................................................7
4. Calculation based on y = mx + c.................................................................................................8
I. Calculation of m.......................................................................................................................9
II. Calculation of c.......................................................................................................................9
III. Calculation for 12th and 14th day expenses.............................................................................9
REFERENCES..............................................................................................................................10
Document Page
1. Arrange the data in table format
Particulars
Amount
£
Electricity bill 250
Telephone bill 120
Water bill 50
Internet bill 500
Grocery shop bill 450
Room rent 500
EMI 350
Education fees 700
Petrol 350
2. Present the data in column chart and line chart
Column chart:
Electricity bill
Telephone bill
Water bill
Internet bill
Grocessory shop bill
Room rent
EMI
Eduction fees
Tutition fees
Petrol
0
100
200
300
400
500
600
700
800
Amount £
Amount £
Document Page
Line chart:
Electricity bill
Telephone bill
Water bill
Internet bill
Grocessory shop bill
Room rent
EMI
Eduction fees
Tutition fees
Petrol
0
100
200
300
400
500
600
700
800
Amount £
Amount £
3. Calculation of mean, median, mode, range and standard deviation
I. Mean:
The norm of the numbers provided is the mathematical meaning. That number in a group of
numbers is responsible for that tally of numbers. How about assuming that if we have a set
collection of numbers and we need to monitor the average of those numbers, we should add them
together and divide the result by the size of the number load (Daraganova, Edwards and
Sipthorp, 2013).
Particulars Amount £
Electricity bill 250
Telephone bill 120
Water bill 50
Internet bill 500
Grocery shop bill 450
Room rent 500
EMI 350
Education fees 700
tabler-icon-diamond-filled.svg

Paraphrase This Document

Need a fresh take? Get an instant paraphrase of this document with our AI Paraphraser
Document Page
Tuition fees 250
Petrol 350
Sum Ʃ 3520
Mean = Sum Ʃ / Number of items
Mean = 352
II. Median:
If we state it in simple terms, the centre is the number that lies exactly in the centre of the
supplied numbers. This is the number that divides the bigger portion of the collection from the
smaller portion. It is frequently mentioned as the focal point of a certain population. To get rid of
the medium, we need to arrange the numbers in an unusual way. For example, there's a chance
that we won't have to discover the average of specific values, or that we'll have to compensate
with an expanded request, or that we'll have to do it with a smaller request. At the stage where
we are going to arrange these numbers in such a way, then, at that level the number between
them will be half of these numbers (Groves, Mousley and Forgasz, 2006).
Particulars Amount £
Water bill 50
Telephone bill 120
Electricity bill 250
Tuition fees 250
EMI 350
Petrol 350
Grocery shop bill 450
Internet bill 500
Room rent 500
Education fees 700
Median = {(n + 1) ÷ 2}th value
Median = { (10 + 1) /2 }
Median = 5.5
Average = (middle value before + middle value after) ÷ 2
(5th + 6th value) /2
(350 + 350)/2
Document Page
Median = 350
III. Mode:
A polymer is a one-of-a-kind number among the ones supplied. Similarly, the polymer may be
defined as a value that is remade as many times as feasible in a series of observations. It may be
regarded as the greatest recycling rate. It's an important measurement instrument that provides us
with a variety of results. It's not always a number set; in some cases, it's even more than one
polymer. This indicates that two comparable numbers might have a similar event from time to
time (Kenny, Kashy and Cook, 2006).
Range (Amount £) Frequency
0 - 150 2
150 - 300 2
300 - 450 2
450 - 600 3
600 - 750 1
Mode = L + (fm−f1)h /(fm−f1)+(fm−f2)
L = Lower limit Mode of modal class
fm = Frequency of modal class
f1 = Frequency of class preceding the modal class
f2= Frequency of class succeeding the modal class
h = Size of class interval
Mode = 450 + {(3 - 2)150 / (3 -2) + (3 -1)}
Mode = 500
IV. Range:
It's a scattering measurement that's simple to understand and remember. It is defined as such
Range = Largest Observation - Smallest Observation (Agresti, 2003).
Particulars Amount £
Electricity bill 250
Telephone bill 120
Water bill 50
Document Page
Internet bill 500
Grocery shop bill 450
Room rent 500
EMI 350
Education fees 700
Tuition fees 250
Petrol 350
Range = maximum value – minimum value
Maximum Value = 700
Minimum value = 50
Range = 700 - 50
650
V. Standard deviation:
The standard deviation (SD) is a measure of reality that deals with instrument instability or risk.
This illustrates how different the asset return plan is from the standard reported return. The more
significant the SD, the more significant the result. Add the performance measurements for the
time it takes to measure and subtract based on the speed of the entire information to get the usual
performance bias on a shared asset. Similarly, subtract your procedure from each information
point to get the difference between the actual and ordinary worlds. Place all of these numbers in
a row and then add them together (Kenny, Kashy and Cook, 2006).
X ( - X ) ( - X ) 2
250 102 10404
120 232 53824
50 302 91204
500 -148 21904
450 -98 9604
500 -148 21904
350 2 4
700 -348 121104
250 102 10404
350 2 4
3520 340360
Mean = 352
tabler-icon-diamond-filled.svg

Paraphrase This Document

Need a fresh take? Get an instant paraphrase of this document with our AI Paraphraser
Document Page
Standard deviation = 184.48
4. Calculation based on y = mx + c
LINEAR FORECASTING MODEL: A connection is established between a dependent variable
and at least one free component in linear regression analysis. There is just one independent
variable in Fallout. You should anticipate the dependent variable to be the same as the
independent variable. After determining the increments of An and B, any future value of X may
be reduced to forecast the relative value of Y (Gelman et.al., 2013).
Exponential adjustment: It also creates a link between a dependent variable and at least one free
component as a dramatic variable. The consistent (dramatic) rotation allows for a desired straight
line position (Hair et.al., 1998).
y = mx + c
y = how far up
x = how far along
m = Slope or Gradient (how steep the line is)
c = value of y when x=0
I. Calculation of m
m = Change in Y/ Change in X
Document Page
X Y
1 50
2 120
3 250
4 250
5 350
6 350
7 450
8 500
9 500
10 700
m = 120 - 50/2-1
m = 70
II. Calculation of c
Y = mx + c
120 = 70(2) + c
C = 120 – 140
C = -20
III. Calculation for 12th and 14th month expenses
X = 12
Y = mx + c
Y = 70(12) + (-20)
= 840 – 20
= 820
X = 14
Y = mx + c
= 70(14) + (-20)
= 980 – 20
= 960
Hence, on 12th month the expenses will be £820 and on 14th month it will be £960.
Conclusion
Data analysis is useful in identifying the meaning conclusion from available data. The analysis
technique also helps in predicting the future data through applying regression analyses method.
Mean, median and mode are the measurement for central tendency of the data.
Document Page
tabler-icon-diamond-filled.svg

Paraphrase This Document

Need a fresh take? Get an instant paraphrase of this document with our AI Paraphraser
Document Page
REFERENCES
Books
Agresti, A., 2003. Categorical data analysis (Vol. 482). John Wiley & Sons.
Daraganova, G., Edwards, B. and Sipthorp, M., 2013. Using National Assessment Program
Literacy and Numeracy (NAPLAN) Data in the Longitudinal Study of Australian Children
(LSAC). Department of Families, Housing, Community Services and Indigenous Affairs.
Gelman, A., and et.al., 2013. Bayesian data analysis. CRC press.
Groves, S., Mousley, J. and Forgasz, H., 2006. A primary numeracy: a mapping review and
analysis of Australian research in numeracy learning at the primary school level: report.
Centre for Studies in Mathematics, Science and Environmental Education, Deakin
University.
Hair, J.F., and et.al., 1998. Multivariate data analysis (Vol. 5, No. 3, pp. 207-219). Upper Saddle
River, NJ: Prentice hall.
Kenny, D.A., Kashy, D.A. and Cook, W.L., 2006. Dyadic data analysis. Guilford press.
chevron_up_icon
1 out of 11
circle_padding
hide_on_mobile
zoom_out_icon
[object Object]