Statistical Analysis: Understanding and Managing Data Effectively

Verified

Added on  2023/06/18

|11
|1539
|71
Practical Assignment
AI Summary
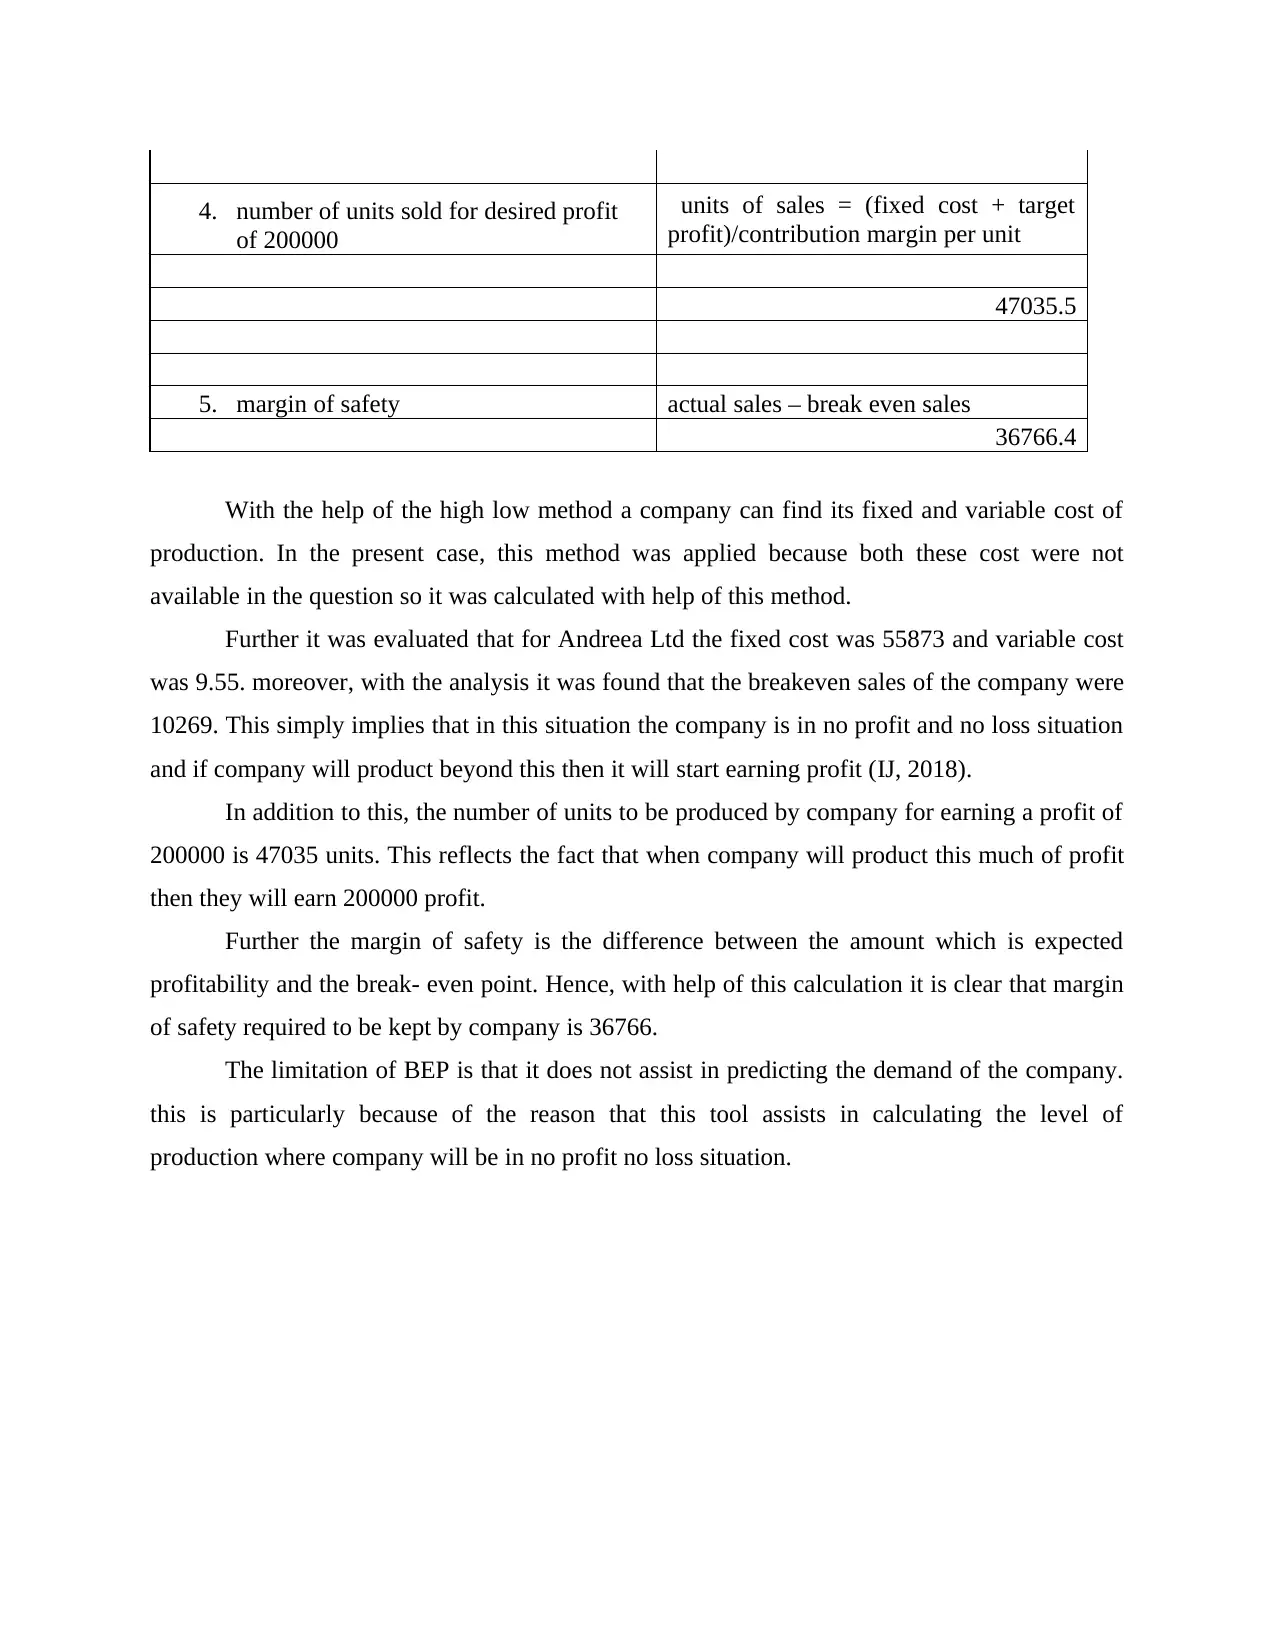
This assignment focuses on understanding and managing data through the application of various statistical tools and techniques. It covers topics such as calculating descriptive statistics (mean, standard deviation, etc.), analyzing frequency distributions, differentiating between time series and cross-sectional data, constructing and interpreting project schedules using critical path analysis, developing and interpreting correlation matrices and regression equations, and applying the high-low method for cost analysis, including break-even point calculations and margin of safety analysis. The assignment also reflects on the learning process, emphasizing the importance of theoretical knowledge, time management, and confidence in statistical analysis. The high-low method is used to determine fixed and variable costs, and the breakeven point is calculated to assess profitability.
tabler-icon-diamond-filled.svg

Contribute Materials

Your contribution can guide someone’s learning journey. Share your documents today.
Document Page
Understanding and Managing
Data
tabler-icon-diamond-filled.svg

Secure Best Marks with AI Grader

Need help grading? Try our AI Grader for instant feedback on your assignments.
Document Page
TABLE OF CONTENTS
PART 1............................................................................................................................................3
Task 1..........................................................................................................................................3
Task 2..........................................................................................................................................3
Task 3..........................................................................................................................................5
Task 4..........................................................................................................................................5
Task 5..........................................................................................................................................7
Task 6..........................................................................................................................................8
Task 7..........................................................................................................................................9
PART 2............................................................................................................................................9
REFERENCES..............................................................................................................................11
Document Page
PART 1
Task 1
Expenditure (£) on Stand
Mixers
Mean 224.00
Standard Error 6.58
Median 224.00
Mode 224.00
Standard Deviation 75.00
Sample Variance 5625.09
Kurtosis -0.49
Skewness -0.32
Range 301.00
Minimum 68.00
Maximum 369.00
Sum 29120.00
Count 130.00
Coefficient of
Variation 33.5%
The mean highlights the fact that average number of people who are willing to pay the prices for
stand mixer is 224. This simply means that on an average the price which is liked by consumer is
224. Further the standard deviation outlines the fact that from every value the mean difference
will be of 75 that is every value will vary from 75 from all the values being entered.
Task 2
Table 1
Expenditure (£) Frequency Frequency (%)
Under 100 15 11.54
100 and under 200 34 26.15
200 and under 300 64 49.23
300 and over 17 13.08
Total: 130 100
Table 2
Expenditure (£) Frequency
Cumulative
Frequency
Cumulative
Frequency (%)
Under 100 15 15 4.89
Document Page
Under 200 34 49 15.96
Under 300 64 113 36.81
Under 400 17 130 42.35
Total: 130 307 100
Expenditure
(£)
class
interval
Frequency
(f)
midpoint
(x)
fx (x-mean) (x-mean)2 f(x-mean)2
Under 100 0-100 15 50 750 17.5 306.25 4593.75
100 and
under 200
100-200 34 150 5100 117.5 13806.25 469412.5
200 and
under 300
200-300 64 250 16000 217.5 47306.25 3027600
300 and over 300-400 17 350 5950 317.5 100806.25 1713706.25
Total: 130
Mean 32.5
Variance 385.25
Standard
Deviation
19.62778643
tabler-icon-diamond-filled.svg

Secure Best Marks with AI Grader

Need help grading? Try our AI Grader for instant feedback on your assignments.
Document Page
With the help of ogive, it is clear that estimated minimum amount which a consumer need to
spend on stand mixer is approximately 224 as per the mean value.
Task 3
The major difference between time series data and cross sectional data is that time series
data is majorly focusing on the same variable for a period of time. On the other hand, cross
sectional data focuses on different variables at same point of time. Another major difference is
that time series data involves observation for a single aspect. On the other hand, cross sectional
data consist of observation relating to different concept at single time.
Task 4
Task
Mode Task Name Duration Start Finish Predecessors
Auto
Scheduled A 6 wks Mon 9/13/21 Fri 10/22/21
Auto
Scheduled B 4 wks Mon 9/13/21 Fri 10/8/21
Auto
Scheduled C 4 wks Mon 10/25/21 Fri 11/19/21 1
Auto
Scheduled D 2 wks Mon 10/11/21 Fri 10/22/21 2
Auto E 6 wks Mon 11/22/21 Fri 12/31/21 3
Document Page
Scheduled
Auto
Scheduled F 5 wks Mon 11/22/21 Fri 12/24/21 3,4
Auto
Scheduled G 3 wks Mon 10/25/21 Fri 11/12/21 4
Auto
Scheduled H 8 wks Mon 9/13/21 Fri 11/5/21
Auto
Scheduled I 5 wks Mon 1/3/22 Fri 2/4/22 5,6,7
Auto
Scheduled J 2 wks Mon 2/7/22 Fri 2/18/22 8,9
Document Page
2
Critical path is the one which is the longest path and assist company in completing the work in
proper manner. For the present project critical path involves activity that is A, C, E, I and J. so
the total duration of critical path is 5+ 3+ 5+ 4+ 3= 20 weeks
3
The major difference between critical and non- critical activities is that critical activity
are the one which have start and finish time. Also these activities are involved within the critical
path and due to this they are critical (Montgomery and Runger, 2018). On the other hand, non-
critical activities are the one which has no impact over the critical path as they are not being
involved within the critical path. Any delay in non- critical activity will have no impact over the
critical path whereas any change in the critical activity will cause change in critical path.
Task 5
Correlation matrix
sales revenue and total cost
Sales
Revenue
(£'000)
Total
Costs
(£'000)
Sales
Revenue
(£'000) 1
Total
Costs
(£'000) 0.546351 1
Average order value and gross profit
Average
Order
Value (£)
Gross
Profit
(£'000)
Average
Order
Value
(£) 1
Gross
Profit
(£'000) 0.333656 1
tabler-icon-diamond-filled.svg

Paraphrase This Document

Need a fresh take? Get an instant paraphrase of this document with our AI Paraphraser
Document Page
B
By referring the correlation matrix, the best predictor of quarterly sales is 2020 Q2 because it is
having maximum sales.
C
D
The correlaiton coefficient in the present case outlined that there is a strong relation between
both the variable that is sales and total cost. Along with this th correlation coefficient is low in
case of average order value and gross profit.
E
The regression equation is y= 70.562x + 247.35 here gradient outlines the rate of change and the
intercept is outlining the starting value of the equation.
Task 6
1
Venture
A
Venture
B
coefficient
of
variation 0.64 0.32
2
In case the retailer is risk averse then they should choose the venture B as it is providing less risk
in comparison to the other project.
Document Page
Task 7
With the above analysis and calculation, I learnt that use of statistical tools and
techniques is very assistive in developing knowledge. With this I leant that having proper
theoretical knowledge is very important as if the base will not be clear then no calculation will be
conducted in proper manner. Also, with this I learnt that use of time management skill was also
necessary to be present (Wikle, Zammit-Mangion and Cressie, 2019). This is particularly
because of the reason that in case work will not be managed on time then effective working will
not be ensured. Along with this I learnt that my confidence level was also a little low as I was not
confident that whether the calculation done was correct or not.
For the future I will ensure that I will first read all the problem and then will search every aspect.
Further after that, I will start my assignment and will ensure that each and every task will be
being completed in proper and effective manner.
PART 2
1. high low method
Highest activity cost – lowest activity
cost / Highest activity unit -Lowest
activity units
9.55908
highest activity cost 400000
highest activity unit 36000
lowest activity cost 183200
lowest activity unit 13320
2. fixed cost
Highest activity cost - (variable cost per
unit* Highest activity units)
55873
highest activity cost 400000
highest activity unit 36000
lowest activity cost 183200
lowest activity unit 13320
3. breakeven point
fixed cost / (sales per unit – variable
cost per unit)
10269
Document Page
4. number of units sold for desired profit
of 200000
units of sales = (fixed cost + target
profit)/contribution margin per unit
47035.5
5. margin of safety actual sales – break even sales
36766.4
With the help of the high low method a company can find its fixed and variable cost of
production. In the present case, this method was applied because both these cost were not
available in the question so it was calculated with help of this method.
Further it was evaluated that for Andreea Ltd the fixed cost was 55873 and variable cost
was 9.55. moreover, with the analysis it was found that the breakeven sales of the company were
10269. This simply implies that in this situation the company is in no profit and no loss situation
and if company will product beyond this then it will start earning profit (IJ, 2018).
In addition to this, the number of units to be produced by company for earning a profit of
200000 is 47035 units. This reflects the fact that when company will product this much of profit
then they will earn 200000 profit.
Further the margin of safety is the difference between the amount which is expected
profitability and the break- even point. Hence, with help of this calculation it is clear that margin
of safety required to be kept by company is 36766.
The limitation of BEP is that it does not assist in predicting the demand of the company.
this is particularly because of the reason that this tool assists in calculating the level of
production where company will be in no profit no loss situation.
tabler-icon-diamond-filled.svg

Secure Best Marks with AI Grader

Need help grading? Try our AI Grader for instant feedback on your assignments.
Document Page
REFERENCES
Books and Journals
IJ, H., 2018. Statistics versus machine learning. Nature methods, 15(4), p.233.
Montgomery, D.C. and Runger, G.C., 2018. Applied statistics and probability for engineers (p.
720). Hoboken, NJ: Wiley.
Wikle, C.K., Zammit-Mangion, A. and Cressie, N., 2019. Spatio-temporal Statistics with R.
Chapman and Hall/CRC.
chevron_up_icon
1 out of 11
circle_padding
hide_on_mobile
zoom_out_icon
logo.png

Your All-in-One AI-Powered Toolkit for Academic Success.

Available 24*7 on WhatsApp / Email

[object Object]