Statistical Data Collection and Interpretation: Survey Analysis
VerifiedAdded on 2021/06/17
|19
|3667
|27
Report
AI Summary
This report presents a statistical analysis of survey data related to climate change, environmental factors, and corporate contributions to environmental solutions. Descriptive statistics reveal that distributions for different responses are generally not symmetrical or identical. Inferential statistics, including hypothesis testing, indicate no significant difference in population proportions for the first and second responses regarding the use of an internal price on carbon, nor between the first and third responses. The analysis concludes that there is poor internal consistency within the data across different variables. Data was collected from secondary sources using a sample size of 173 and analyzed using frequency distributions and hypothesis testing.

Statistical Data Collection and Interpretation
Paraphrase This Document
Need a fresh take? Get an instant paraphrase of this document with our AI Paraphraser
Table of Contents
Abstract................................................................................................................................3
Introduction..........................................................................................................................3
Research Questions..............................................................................................................4
Data Collection.....................................................................................................................5
Descriptive Statistics............................................................................................................4
Inferential Statistics..............................................................................................................5
Conclusions..........................................................................................................................5
References............................................................................................................................5
2 | P a g e
Assessment
Statistical Data Collection and Interpretation
Abstract
Statistical data analysis tools and techniques were used for the analysis of sample survey data
regarding the climate change, different environmental factors, contribution of corporate and
organizations for solving environment issues. It was observed that Most of the distributions for
the different responses are not symmetrical or identical. No significant difference is observed in
the population proportion for the first response and second response regarding the use of an
internal price on carbon. Also, no any significant difference is observed in the population
proportion for the first response and third response regarding the use of an internal price on
carbon. We conclude that there is a very poor internal consistency exists in the data for different
variables.
Introduction
We know that the statistical data analysis and interpretation is very important after data
collection for making more efficient decisions. Here we want to use different tools and
techniques of statistical data analysis for analysis of the collected data. We have to use
descriptive statistics and inferential statistics for the analysis purpose. We want to check whether
the distributions for the responses are same or not. Also, we will check whether the proportions
for the different types of responses are same or not. For checking different types of claims, we
will use some random data. Here, we have to analyse the survey data collected for the large
sample survey regarding global issues of climate change, CO2 emissions, pollution, etc. Let us
see this statistical analysis of the collected data in detail.
Research Questions
It is important to establish the research questions for any type of research study. For this research
study, the research questions are summarised as below:
Whether the distribution for the responses regarding the climate change and different
environmental issues is same or not?
Whether the proportion for the first response and second response for use of an internal price on
carbon is same or not?
Whether the proportion for the first response and third response for use of an internal price on
carbon is same or not?
3 | P a g e
⊘ This is a preview!⊘
Do you want full access?
Subscribe today to unlock all pages.
Trusted by 1+ million students worldwide
Literature Review
Companies are facing a huge financial burden like costs of monitoring to meet the carbon
emission target which also affects decreased profit. Agency theory clearly implies that the slack
in the targets of agents is created by the asymmetry in their incentives (Timo &Volker, 2011). As
per the agency theory, the expenses on environmental responsibilities increase the profit of the
business and this environmental activity has the negative impact on a company’s profitability.
They also indicated that there exists a good relationship between environmental and company
performances because carbon emission disclosure results in building a good reputation of the
company in the market which attracts shareholders to invest in the company deriving financial
benefits as well as non-financial benefits (Freeman, 2010).
Moreover, companies may imply CSR policy for the positive relations with the legal bodies and
increase their reputation and goodwill. Companies which are involved with CSR activities may
charge higher cost on their products but on the other hand the relationship between supplier and
customers being stronger as customers who are environmental friendly always contribute to the
efforts which are more towards the pollution free environment (Saleh, Zulkifli and Muhamad,
2010).
Conceptual Model
For this research study, the concept of statistical analysis by using testing hypothesis is used.
Data for the collected responses would be analyzed by using descriptive analysis and hypothesis
testing or inferential statistics. In descriptive statistics, we will see the descriptive summaries and
frequency distributions for the different responses. While in the testing of hypothesis, we will
test different claims or hypotheses established for this research study.
4 | P a g e
Paraphrase This Document
Need a fresh take? Get an instant paraphrase of this document with our AI Paraphraser
Hypotheses
For this research study, we have to use inferential statistics or testing of hypothesis of checking
the following null and alternative hypothesis:
Hypothesis 1
Null hypothesis: H0: There is no any significant difference in the population proportion for the
first response and second response regarding the use of an internal price on carbon.
Alternative hypothesis: Ha: There is a significant difference in the population proportion for the
first response and second response regarding the use of an internal price on carbon.
Hypothesis 2
Null hypothesis: H0: There is no any significant difference in the population proportion for the
first response and third response regarding the use of an internal price on carbon.
Alternative hypothesis: Ha: There is a significant difference in the population proportion for the
first response and third response regarding the use of an internal price on carbon.
5 | P a g e
InternalPriceonCarbonStatisticalProportionsofresponses
Data Collection
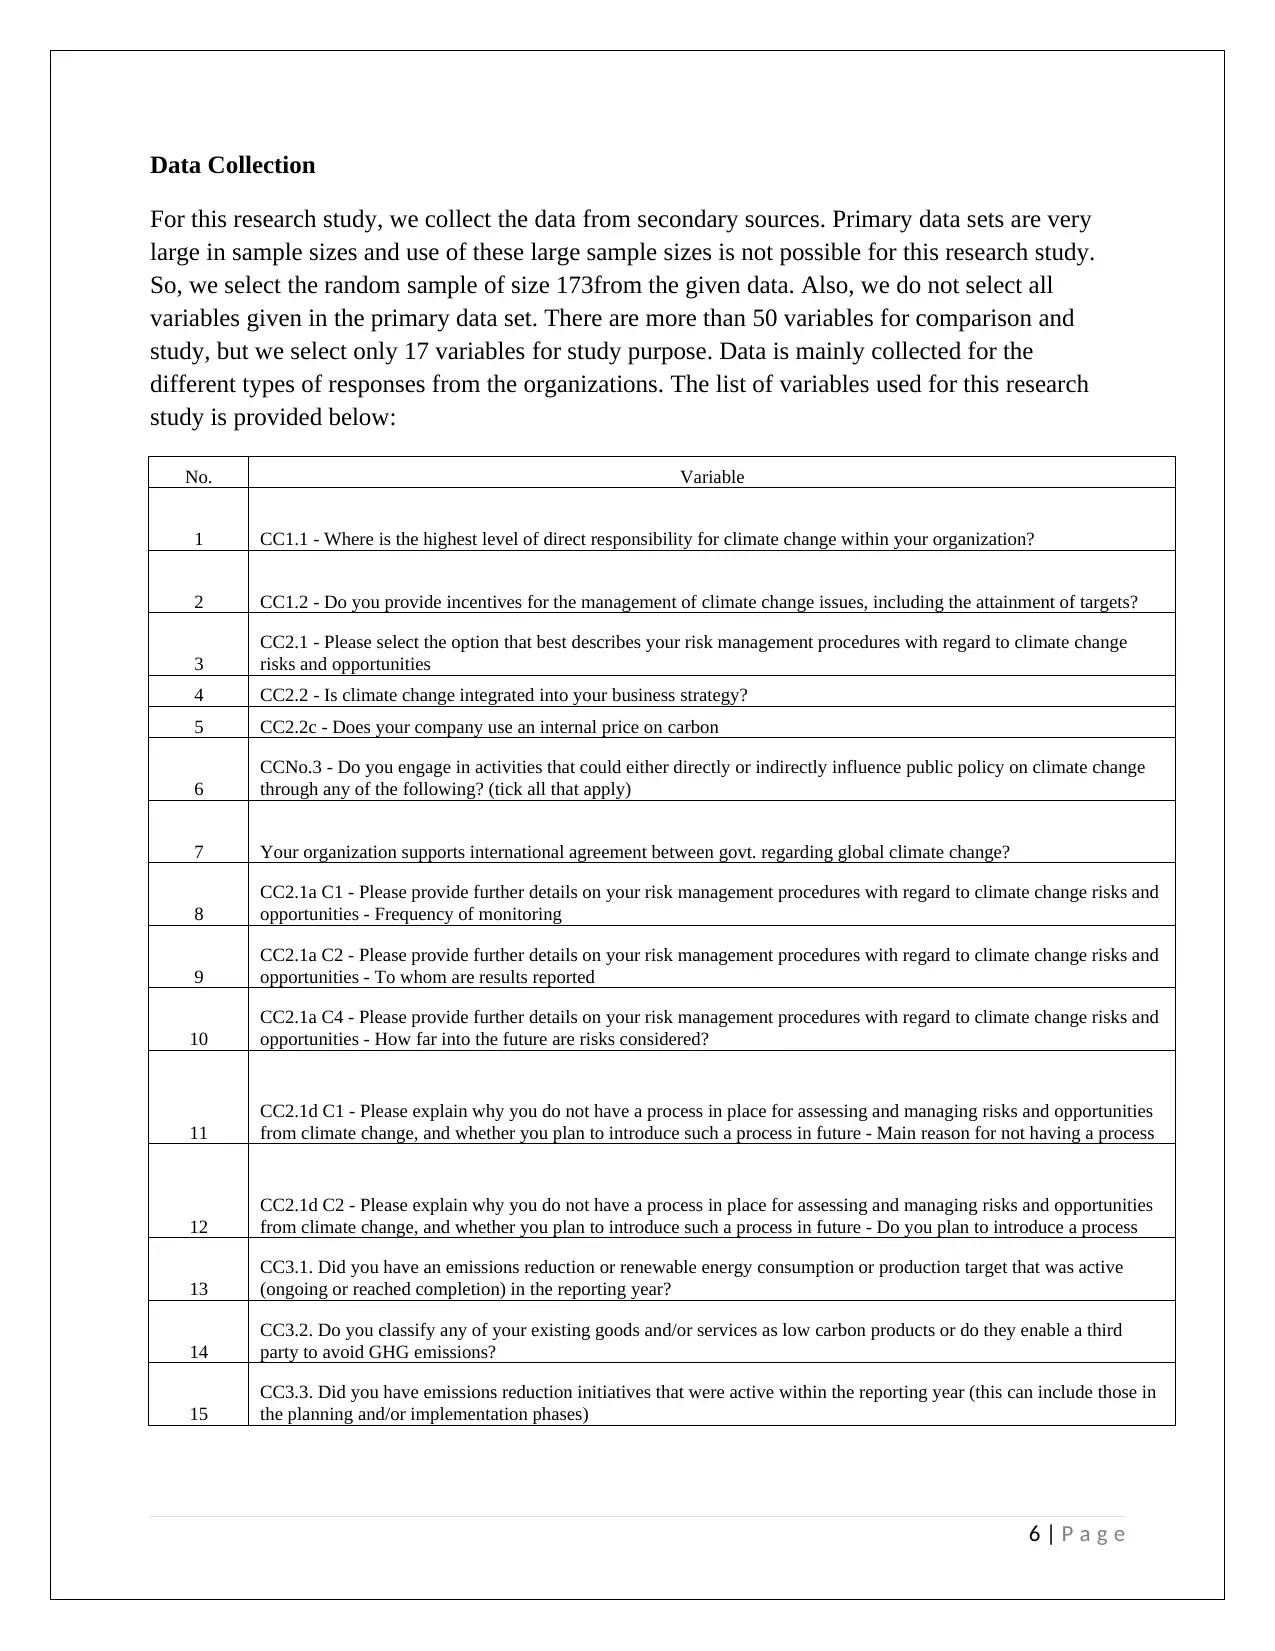
For this research study, we collect the data from secondary sources. Primary data sets are very
large in sample sizes and use of these large sample sizes is not possible for this research study.
So, we select the random sample of size 173from the given data. Also, we do not select all
variables given in the primary data set. There are more than 50 variables for comparison and
study, but we select only 17 variables for study purpose. Data is mainly collected for the
different types of responses from the organizations. The list of variables used for this research
study is provided below:
No. Variable
1 CC1.1 - Where is the highest level of direct responsibility for climate change within your organization?
2 CC1.2 - Do you provide incentives for the management of climate change issues, including the attainment of targets?
3
CC2.1 - Please select the option that best describes your risk management procedures with regard to climate change
risks and opportunities
4 CC2.2 - Is climate change integrated into your business strategy?
5 CC2.2c - Does your company use an internal price on carbon
6
CCNo.3 - Do you engage in activities that could either directly or indirectly influence public policy on climate change
through any of the following? (tick all that apply)
7 Your organization supports international agreement between govt. regarding global climate change?
8
CC2.1a C1 - Please provide further details on your risk management procedures with regard to climate change risks and
opportunities - Frequency of monitoring
9
CC2.1a C2 - Please provide further details on your risk management procedures with regard to climate change risks and
opportunities - To whom are results reported
10
CC2.1a C4 - Please provide further details on your risk management procedures with regard to climate change risks and
opportunities - How far into the future are risks considered?
11
CC2.1d C1 - Please explain why you do not have a process in place for assessing and managing risks and opportunities
from climate change, and whether you plan to introduce such a process in future - Main reason for not having a process
12
CC2.1d C2 - Please explain why you do not have a process in place for assessing and managing risks and opportunities
from climate change, and whether you plan to introduce such a process in future - Do you plan to introduce a process
13
CC3.1. Did you have an emissions reduction or renewable energy consumption or production target that was active
(ongoing or reached completion) in the reporting year?
14
CC3.2. Do you classify any of your existing goods and/or services as low carbon products or do they enable a third
party to avoid GHG emissions?
15
CC3.3. Did you have emissions reduction initiatives that were active within the reporting year (this can include those in
the planning and/or implementation phases)
6 | P a g e
⊘ This is a preview!⊘
Do you want full access?
Subscribe today to unlock all pages.
Trusted by 1+ million students worldwide
16
CC5.1 - Have you identified any inherent climate change risks that have the potential to generate a substantive change
in your business operations, revenue or expenditure? Tick all that apply
17
CC6.1 - Have you identified any inherent climate change opportunities that have the potential to generate a substantive
change in your business operations, revenue or expenditure? Tick all that apply
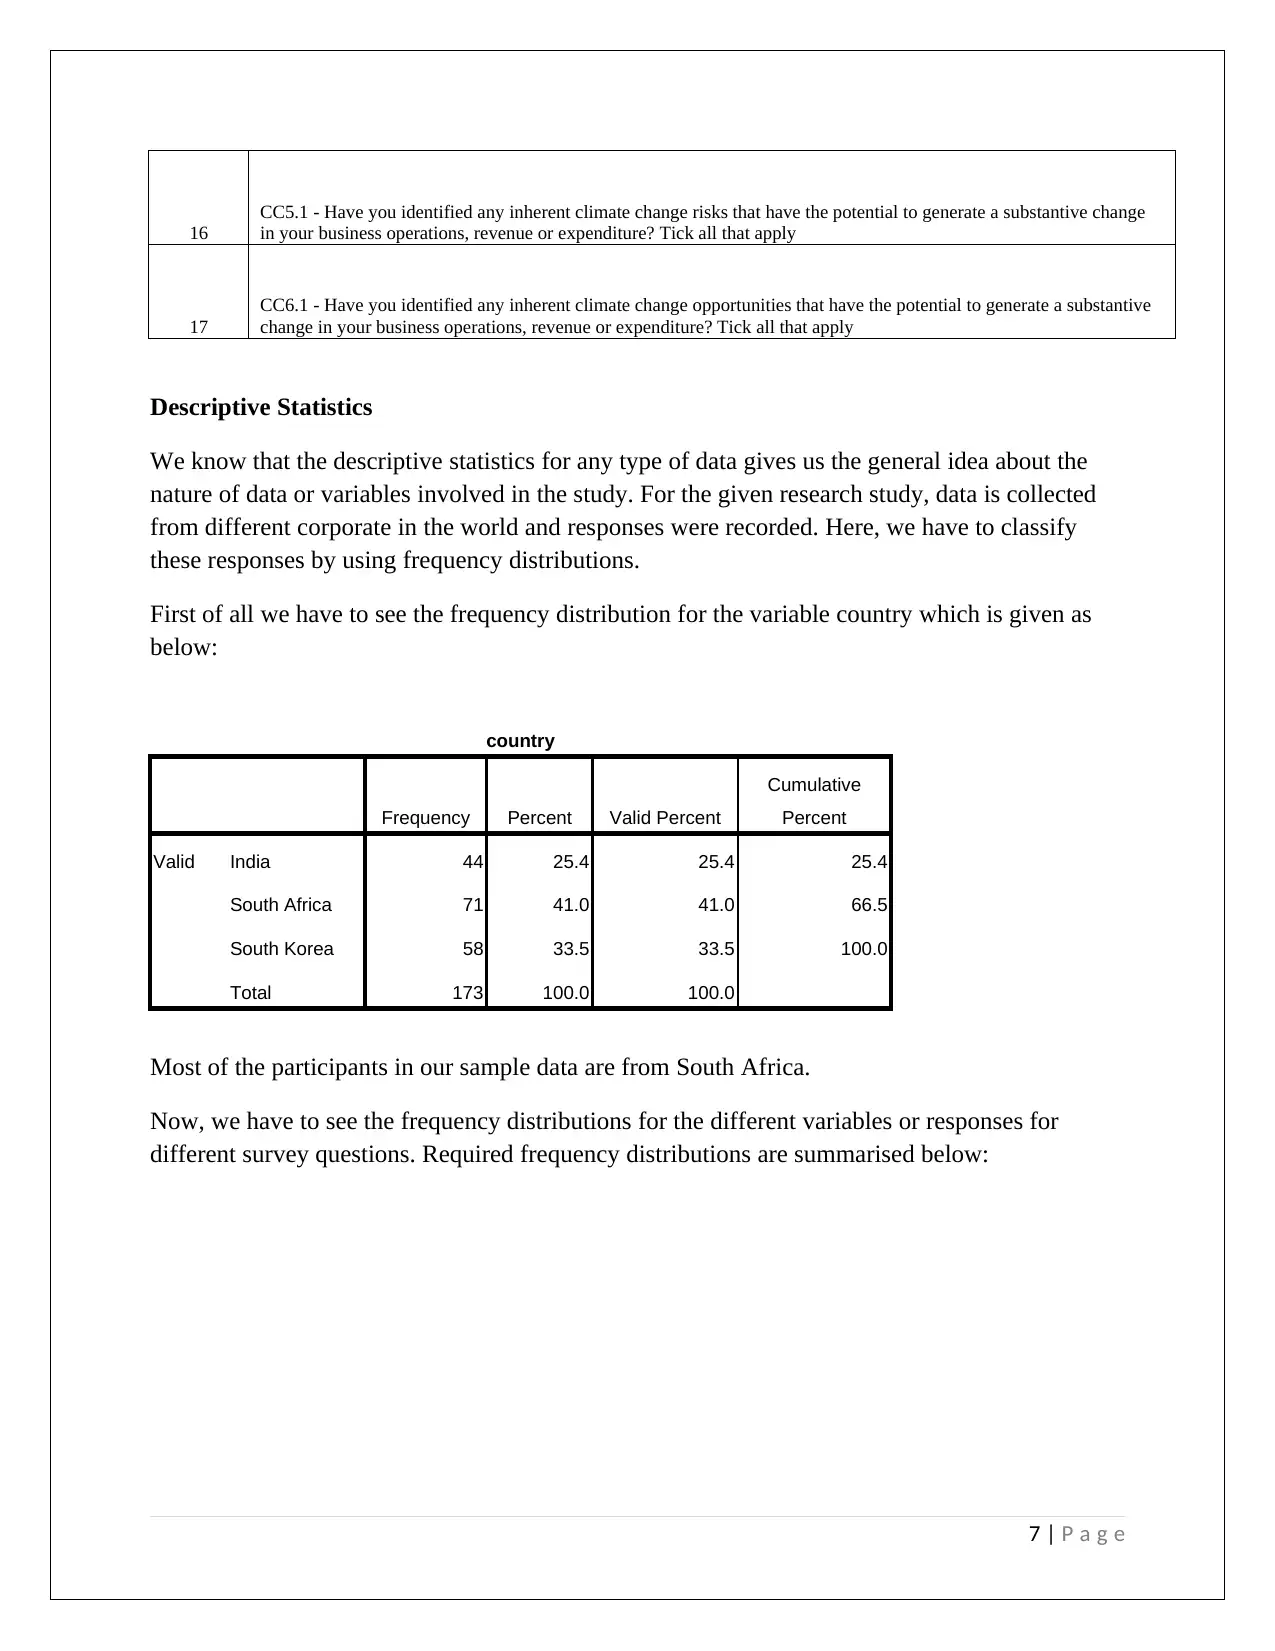
Descriptive Statistics
We know that the descriptive statistics for any type of data gives us the general idea about the
nature of data or variables involved in the study. For the given research study, data is collected
from different corporate in the world and responses were recorded. Here, we have to classify
these responses by using frequency distributions.
First of all we have to see the frequency distribution for the variable country which is given as
below:
country
Frequency Percent Valid Percent
Cumulative
Percent
Valid India 44 25.4 25.4 25.4
South Africa 71 41.0 41.0 66.5
South Korea 58 33.5 33.5 100.0
Total 173 100.0 100.0
Most of the participants in our sample data are from South Africa.
Now, we have to see the frequency distributions for the different variables or responses for
different survey questions. Required frequency distributions are summarised below:
7 | P a g e
CC5.1 - Have you identified any inherent climate change risks that have the potential to generate a substantive change
in your business operations, revenue or expenditure? Tick all that apply
17
CC6.1 - Have you identified any inherent climate change opportunities that have the potential to generate a substantive
change in your business operations, revenue or expenditure? Tick all that apply
Descriptive Statistics
We know that the descriptive statistics for any type of data gives us the general idea about the
nature of data or variables involved in the study. For the given research study, data is collected
from different corporate in the world and responses were recorded. Here, we have to classify
these responses by using frequency distributions.
First of all we have to see the frequency distribution for the variable country which is given as
below:
country
Frequency Percent Valid Percent
Cumulative
Percent
Valid India 44 25.4 25.4 25.4
South Africa 71 41.0 41.0 66.5
South Korea 58 33.5 33.5 100.0
Total 173 100.0 100.0
Most of the participants in our sample data are from South Africa.
Now, we have to see the frequency distributions for the different variables or responses for
different survey questions. Required frequency distributions are summarised below:
7 | P a g e
Paraphrase This Document
Need a fresh take? Get an instant paraphrase of this document with our AI Paraphraser
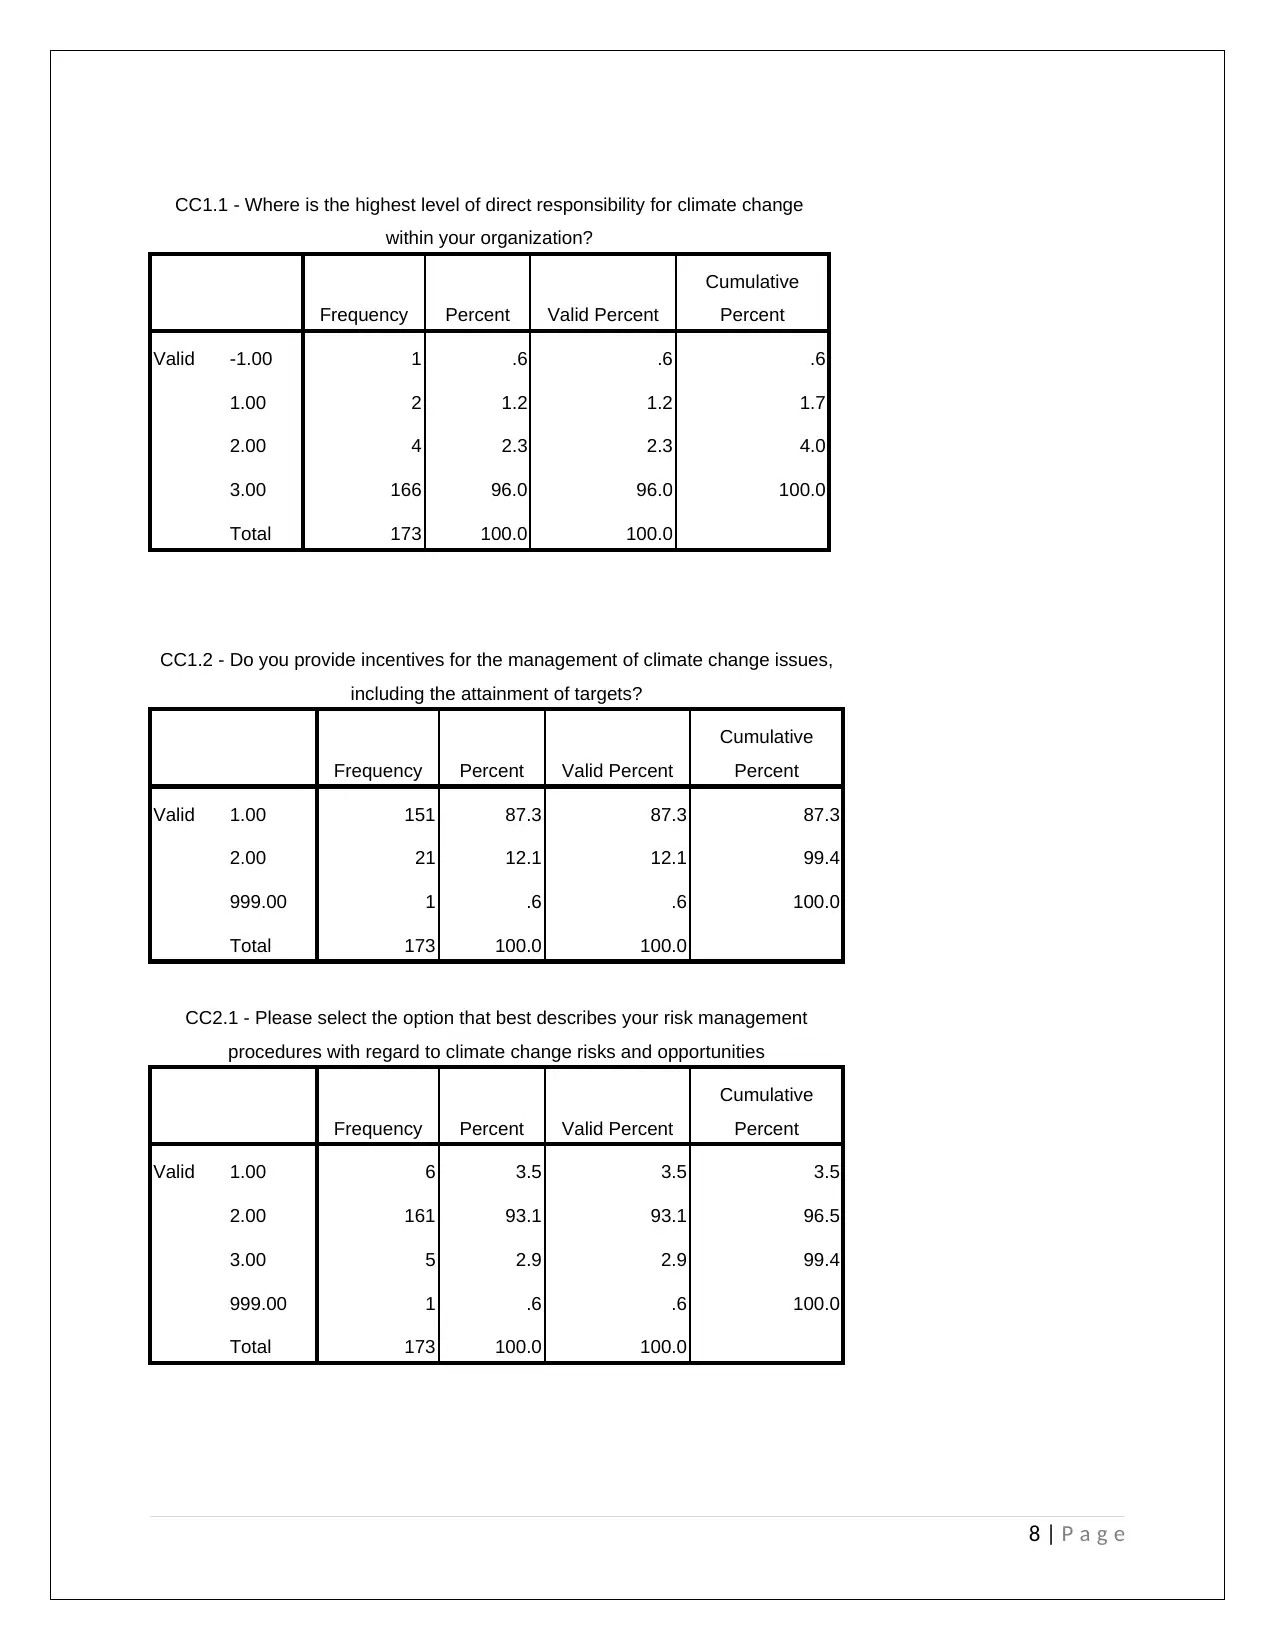
CC1.1 - Where is the highest level of direct responsibility for climate change
within your organization?
Frequency Percent Valid Percent
Cumulative
Percent
Valid -1.00 1 .6 .6 .6
1.00 2 1.2 1.2 1.7
2.00 4 2.3 2.3 4.0
3.00 166 96.0 96.0 100.0
Total 173 100.0 100.0
CC1.2 - Do you provide incentives for the management of climate change issues,
including the attainment of targets?
Frequency Percent Valid Percent
Cumulative
Percent
Valid 1.00 151 87.3 87.3 87.3
2.00 21 12.1 12.1 99.4
999.00 1 .6 .6 100.0
Total 173 100.0 100.0
CC2.1 - Please select the option that best describes your risk management
procedures with regard to climate change risks and opportunities
Frequency Percent Valid Percent
Cumulative
Percent
Valid 1.00 6 3.5 3.5 3.5
2.00 161 93.1 93.1 96.5
3.00 5 2.9 2.9 99.4
999.00 1 .6 .6 100.0
Total 173 100.0 100.0
8 | P a g e
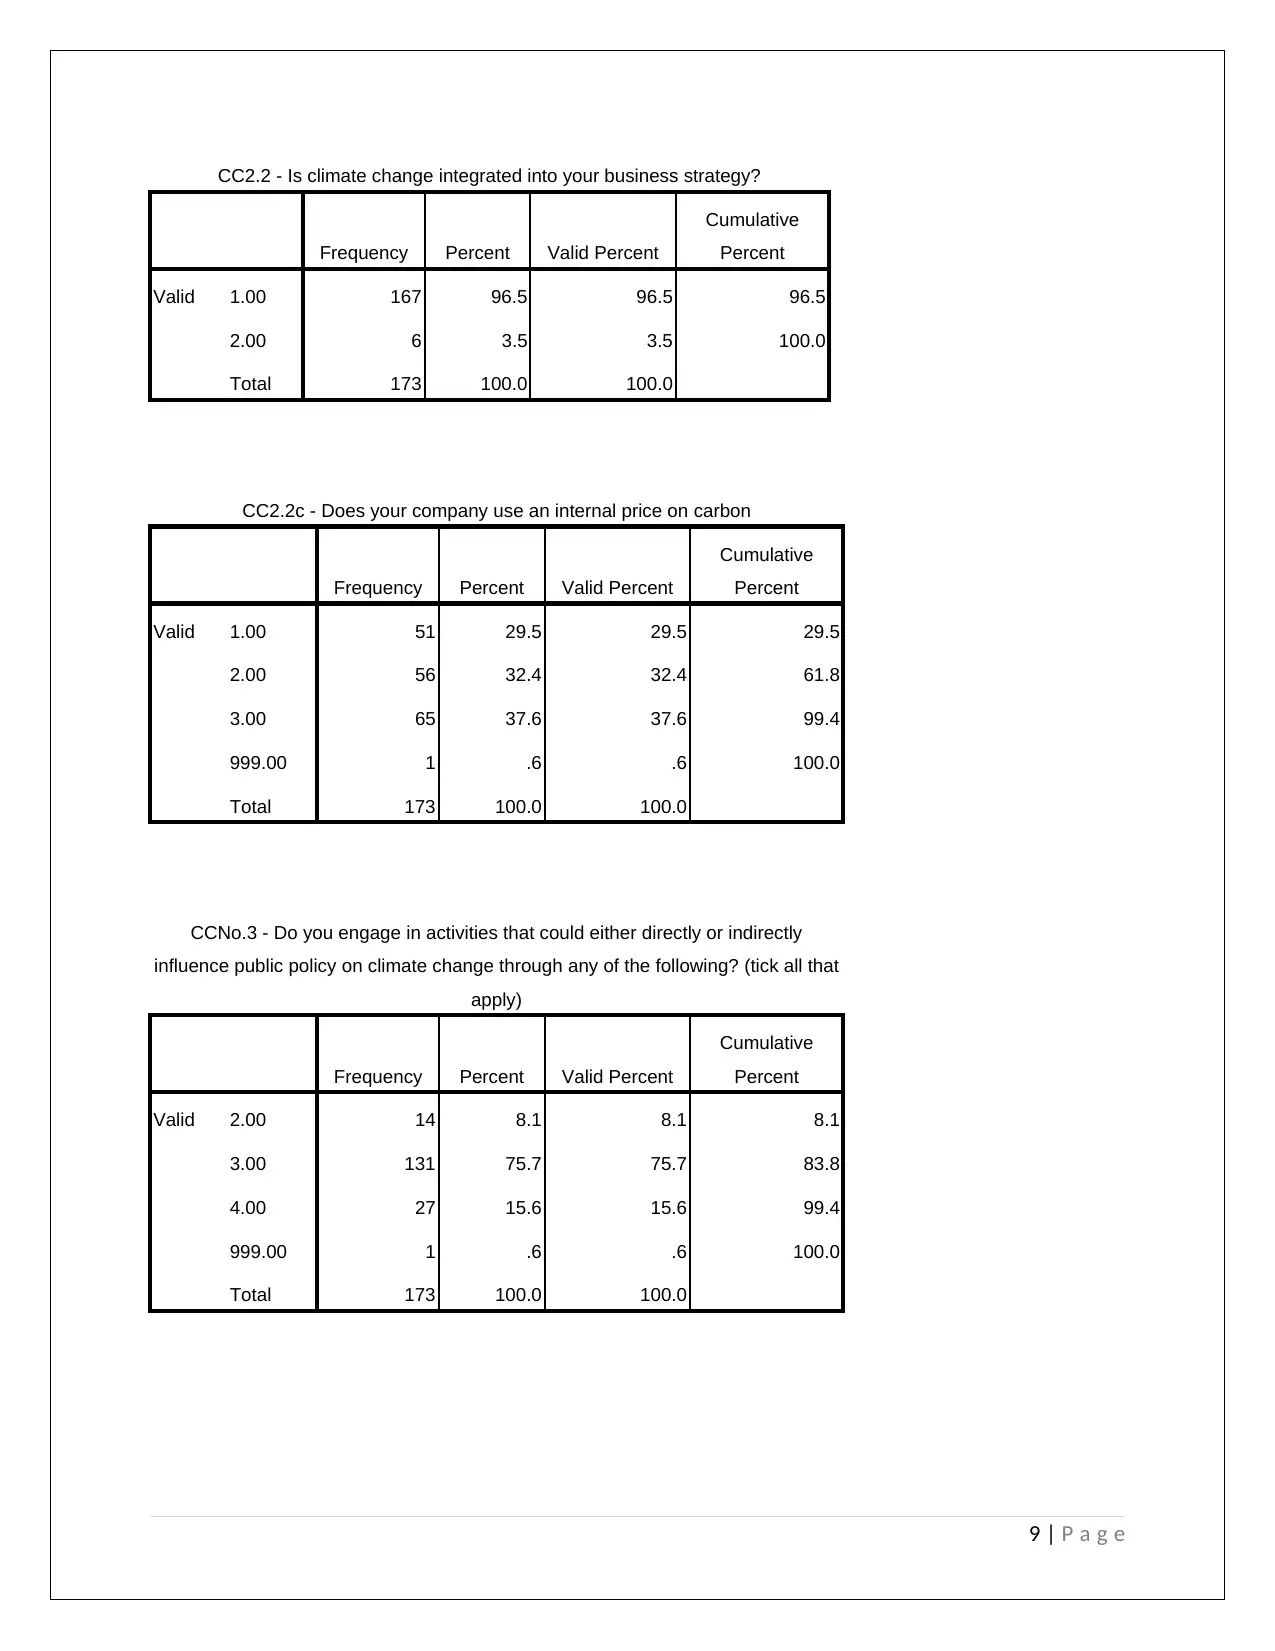
CC2.2 - Is climate change integrated into your business strategy?
Frequency Percent Valid Percent
Cumulative
Percent
Valid 1.00 167 96.5 96.5 96.5
2.00 6 3.5 3.5 100.0
Total 173 100.0 100.0
CC2.2c - Does your company use an internal price on carbon
Frequency Percent Valid Percent
Cumulative
Percent
Valid 1.00 51 29.5 29.5 29.5
2.00 56 32.4 32.4 61.8
3.00 65 37.6 37.6 99.4
999.00 1 .6 .6 100.0
Total 173 100.0 100.0
CCNo.3 - Do you engage in activities that could either directly or indirectly
influence public policy on climate change through any of the following? (tick all that
apply)
Frequency Percent Valid Percent
Cumulative
Percent
Valid 2.00 14 8.1 8.1 8.1
3.00 131 75.7 75.7 83.8
4.00 27 15.6 15.6 99.4
999.00 1 .6 .6 100.0
Total 173 100.0 100.0
9 | P a g e
Frequency Percent Valid Percent
Cumulative
Percent
Valid 1.00 167 96.5 96.5 96.5
2.00 6 3.5 3.5 100.0
Total 173 100.0 100.0
CC2.2c - Does your company use an internal price on carbon
Frequency Percent Valid Percent
Cumulative
Percent
Valid 1.00 51 29.5 29.5 29.5
2.00 56 32.4 32.4 61.8
3.00 65 37.6 37.6 99.4
999.00 1 .6 .6 100.0
Total 173 100.0 100.0
CCNo.3 - Do you engage in activities that could either directly or indirectly
influence public policy on climate change through any of the following? (tick all that
apply)
Frequency Percent Valid Percent
Cumulative
Percent
Valid 2.00 14 8.1 8.1 8.1
3.00 131 75.7 75.7 83.8
4.00 27 15.6 15.6 99.4
999.00 1 .6 .6 100.0
Total 173 100.0 100.0
9 | P a g e
⊘ This is a preview!⊘
Do you want full access?
Subscribe today to unlock all pages.
Trusted by 1+ million students worldwide
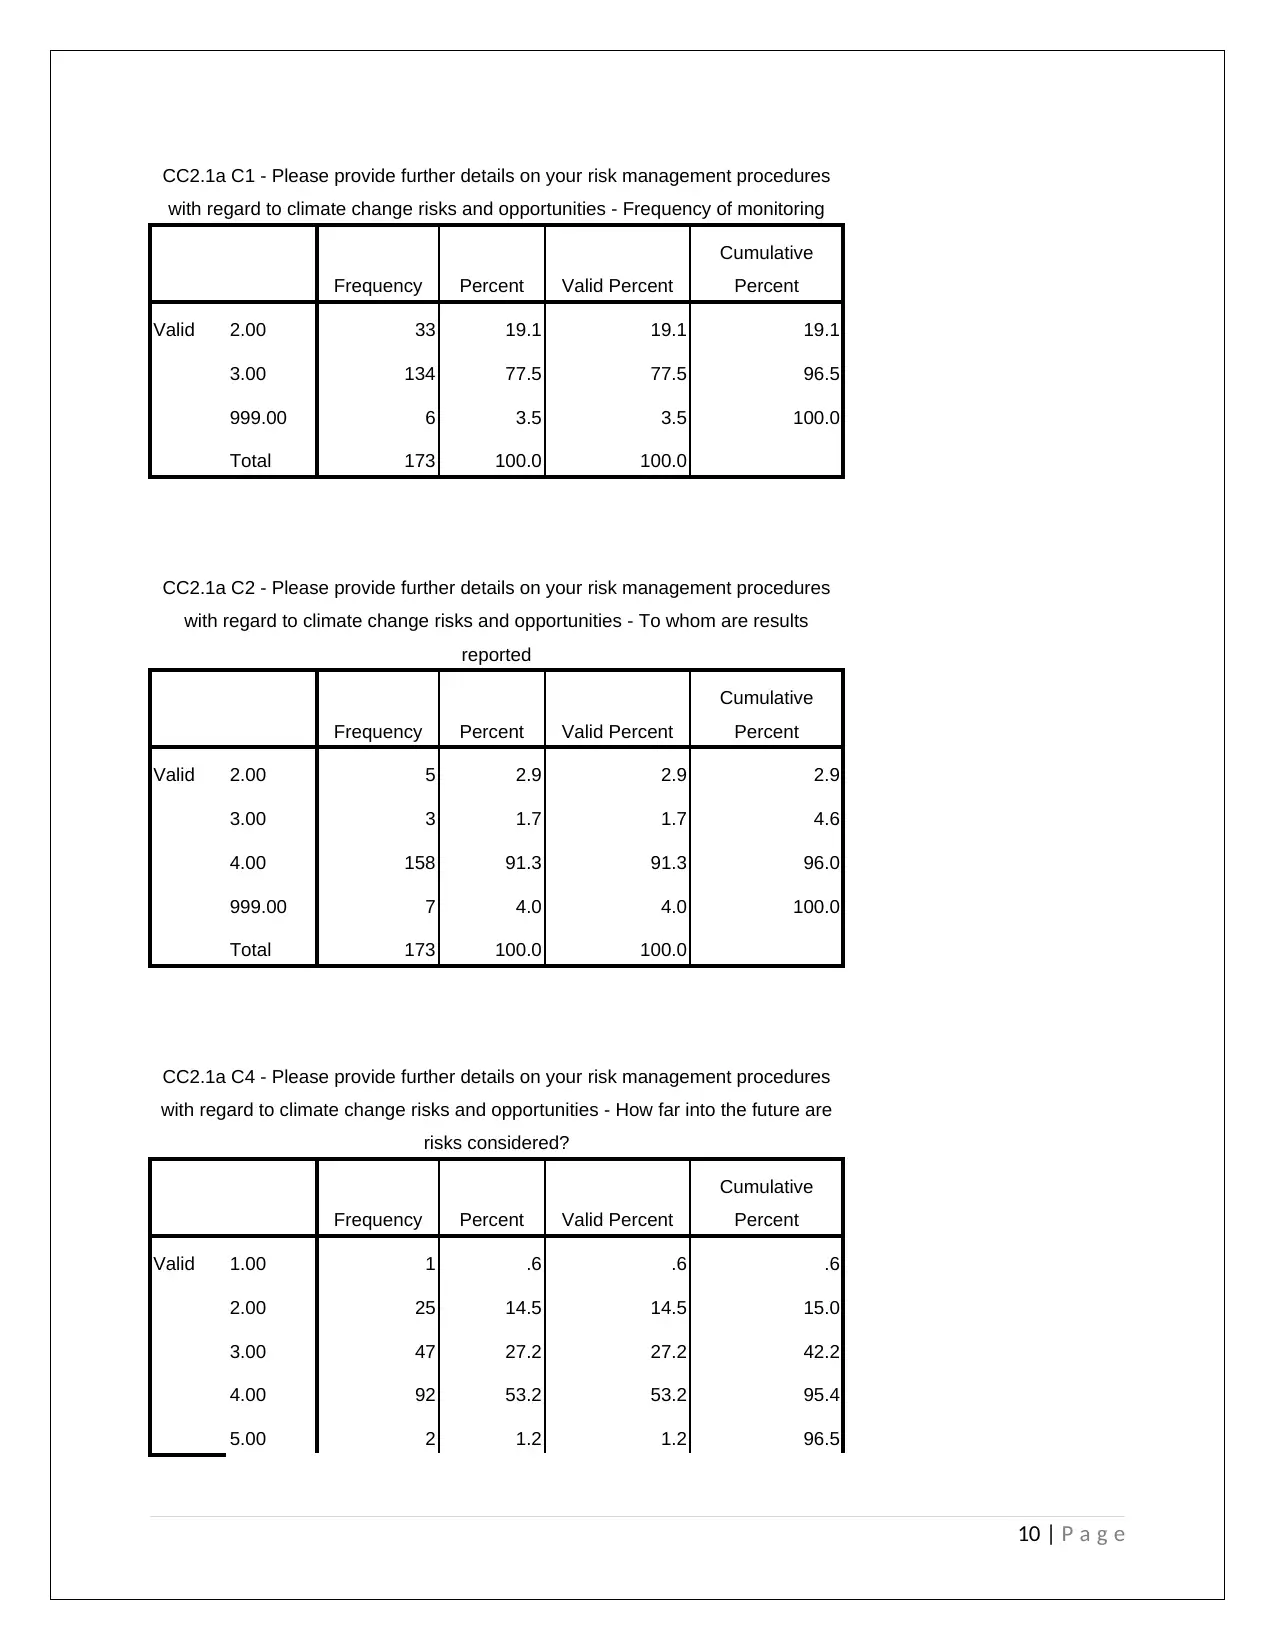
CC2.1a C1 - Please provide further details on your risk management procedures
with regard to climate change risks and opportunities - Frequency of monitoring
Frequency Percent Valid Percent
Cumulative
Percent
Valid 2.00 33 19.1 19.1 19.1
3.00 134 77.5 77.5 96.5
999.00 6 3.5 3.5 100.0
Total 173 100.0 100.0
CC2.1a C2 - Please provide further details on your risk management procedures
with regard to climate change risks and opportunities - To whom are results
reported
Frequency Percent Valid Percent
Cumulative
Percent
Valid 2.00 5 2.9 2.9 2.9
3.00 3 1.7 1.7 4.6
4.00 158 91.3 91.3 96.0
999.00 7 4.0 4.0 100.0
Total 173 100.0 100.0
CC2.1a C4 - Please provide further details on your risk management procedures
with regard to climate change risks and opportunities - How far into the future are
risks considered?
Frequency Percent Valid Percent
Cumulative
Percent
Valid 1.00 1 .6 .6 .6
2.00 25 14.5 14.5 15.0
3.00 47 27.2 27.2 42.2
4.00 92 53.2 53.2 95.4
5.00 2 1.2 1.2 96.5
10 | P a g e
Paraphrase This Document
Need a fresh take? Get an instant paraphrase of this document with our AI Paraphraser
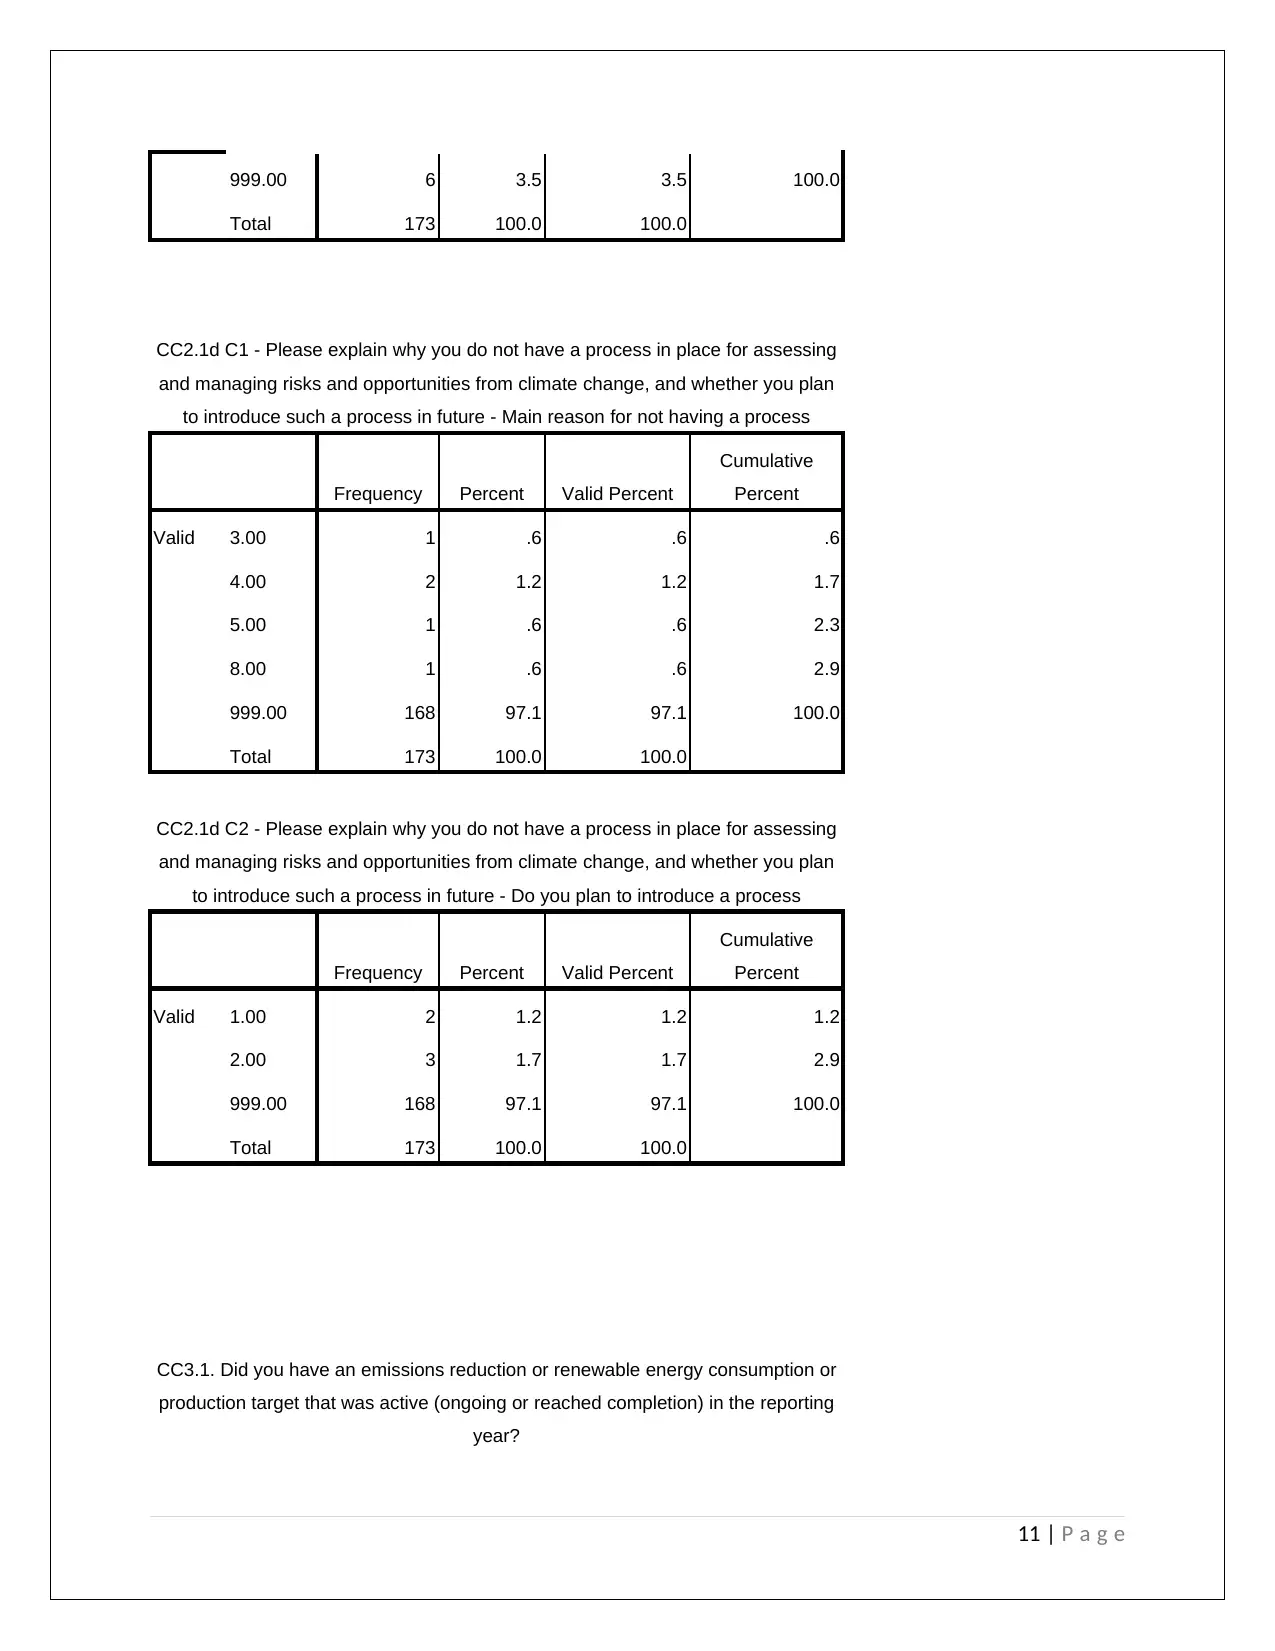
999.00 6 3.5 3.5 100.0
Total 173 100.0 100.0
CC2.1d C1 - Please explain why you do not have a process in place for assessing
and managing risks and opportunities from climate change, and whether you plan
to introduce such a process in future - Main reason for not having a process
Frequency Percent Valid Percent
Cumulative
Percent
Valid 3.00 1 .6 .6 .6
4.00 2 1.2 1.2 1.7
5.00 1 .6 .6 2.3
8.00 1 .6 .6 2.9
999.00 168 97.1 97.1 100.0
Total 173 100.0 100.0
CC2.1d C2 - Please explain why you do not have a process in place for assessing
and managing risks and opportunities from climate change, and whether you plan
to introduce such a process in future - Do you plan to introduce a process
Frequency Percent Valid Percent
Cumulative
Percent
Valid 1.00 2 1.2 1.2 1.2
2.00 3 1.7 1.7 2.9
999.00 168 97.1 97.1 100.0
Total 173 100.0 100.0
CC3.1. Did you have an emissions reduction or renewable energy consumption or
production target that was active (ongoing or reached completion) in the reporting
year?
11 | P a g e
Total 173 100.0 100.0
CC2.1d C1 - Please explain why you do not have a process in place for assessing
and managing risks and opportunities from climate change, and whether you plan
to introduce such a process in future - Main reason for not having a process
Frequency Percent Valid Percent
Cumulative
Percent
Valid 3.00 1 .6 .6 .6
4.00 2 1.2 1.2 1.7
5.00 1 .6 .6 2.3
8.00 1 .6 .6 2.9
999.00 168 97.1 97.1 100.0
Total 173 100.0 100.0
CC2.1d C2 - Please explain why you do not have a process in place for assessing
and managing risks and opportunities from climate change, and whether you plan
to introduce such a process in future - Do you plan to introduce a process
Frequency Percent Valid Percent
Cumulative
Percent
Valid 1.00 2 1.2 1.2 1.2
2.00 3 1.7 1.7 2.9
999.00 168 97.1 97.1 100.0
Total 173 100.0 100.0
CC3.1. Did you have an emissions reduction or renewable energy consumption or
production target that was active (ongoing or reached completion) in the reporting
year?
11 | P a g e
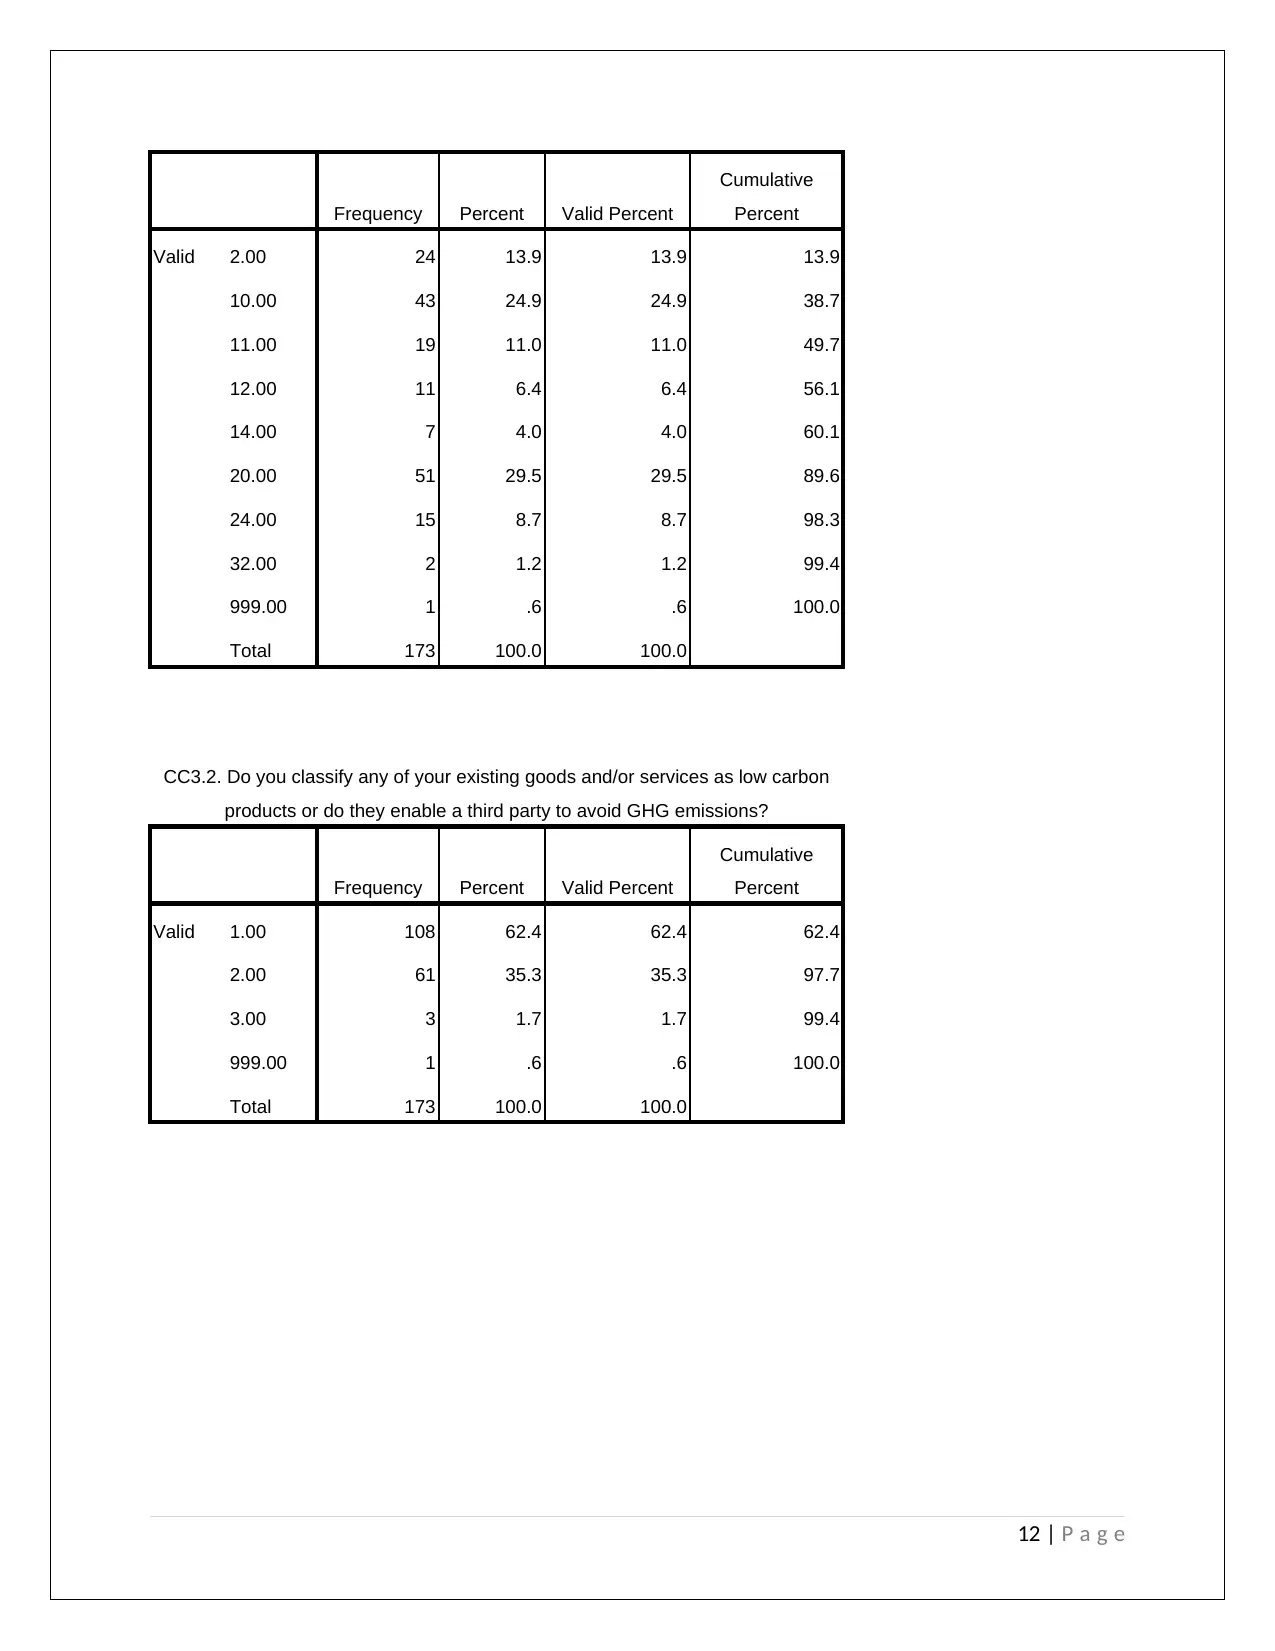
Frequency Percent Valid Percent
Cumulative
Percent
Valid 2.00 24 13.9 13.9 13.9
10.00 43 24.9 24.9 38.7
11.00 19 11.0 11.0 49.7
12.00 11 6.4 6.4 56.1
14.00 7 4.0 4.0 60.1
20.00 51 29.5 29.5 89.6
24.00 15 8.7 8.7 98.3
32.00 2 1.2 1.2 99.4
999.00 1 .6 .6 100.0
Total 173 100.0 100.0
CC3.2. Do you classify any of your existing goods and/or services as low carbon
products or do they enable a third party to avoid GHG emissions?
Frequency Percent Valid Percent
Cumulative
Percent
Valid 1.00 108 62.4 62.4 62.4
2.00 61 35.3 35.3 97.7
3.00 3 1.7 1.7 99.4
999.00 1 .6 .6 100.0
Total 173 100.0 100.0
12 | P a g e
Cumulative
Percent
Valid 2.00 24 13.9 13.9 13.9
10.00 43 24.9 24.9 38.7
11.00 19 11.0 11.0 49.7
12.00 11 6.4 6.4 56.1
14.00 7 4.0 4.0 60.1
20.00 51 29.5 29.5 89.6
24.00 15 8.7 8.7 98.3
32.00 2 1.2 1.2 99.4
999.00 1 .6 .6 100.0
Total 173 100.0 100.0
CC3.2. Do you classify any of your existing goods and/or services as low carbon
products or do they enable a third party to avoid GHG emissions?
Frequency Percent Valid Percent
Cumulative
Percent
Valid 1.00 108 62.4 62.4 62.4
2.00 61 35.3 35.3 97.7
3.00 3 1.7 1.7 99.4
999.00 1 .6 .6 100.0
Total 173 100.0 100.0
12 | P a g e
⊘ This is a preview!⊘
Do you want full access?
Subscribe today to unlock all pages.
Trusted by 1+ million students worldwide
1 out of 19
Related Documents


Your All-in-One AI-Powered Toolkit for Academic Success.
+13062052269
info@desklib.com
Available 24*7 on WhatsApp / Email
![[object Object]](/_next/static/media/star-bottom.7253800d.svg)
Unlock your academic potential
Copyright © 2020–2026 A2Z Services. All Rights Reserved. Developed and managed by ZUCOL.