Energy Consumption Data Analysis: Statistical Interpretation

Verified

Added on  2023/06/14

|20
|3838
|388
Report
AI Summary
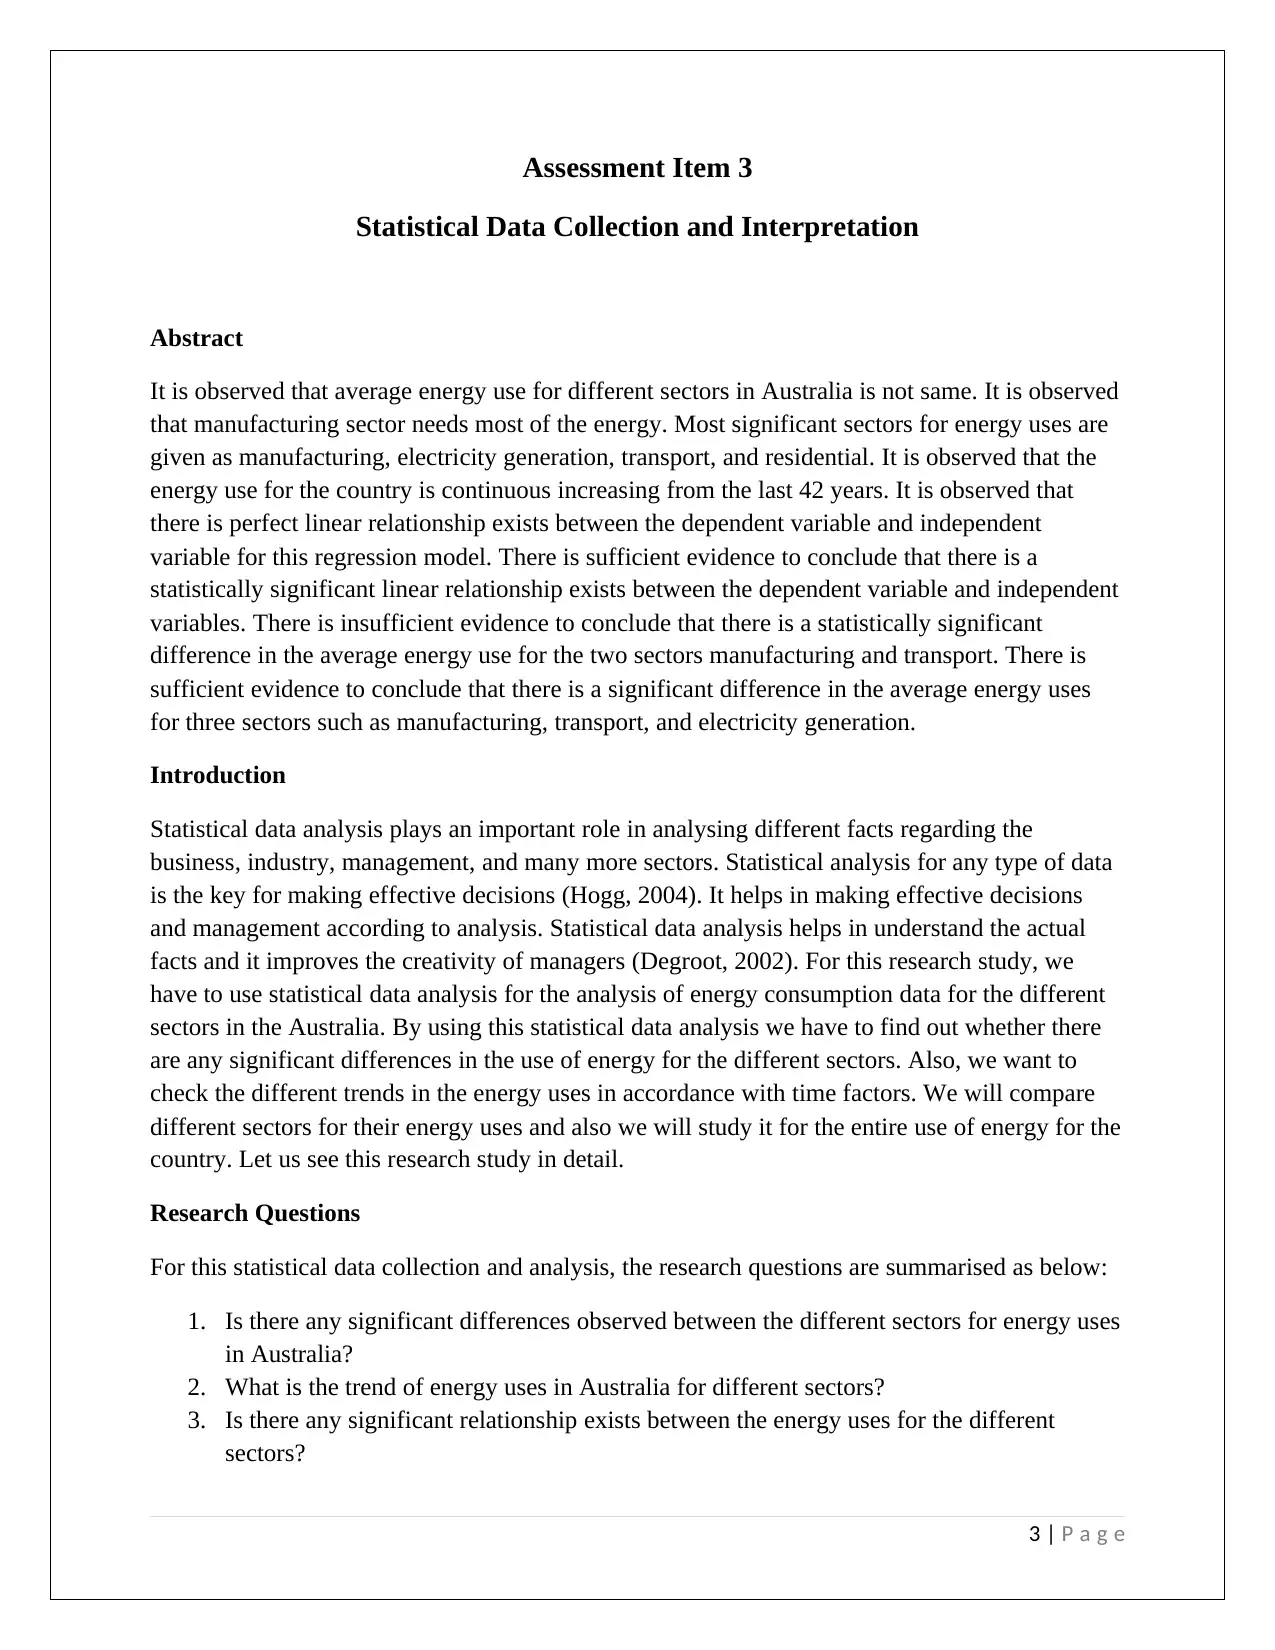
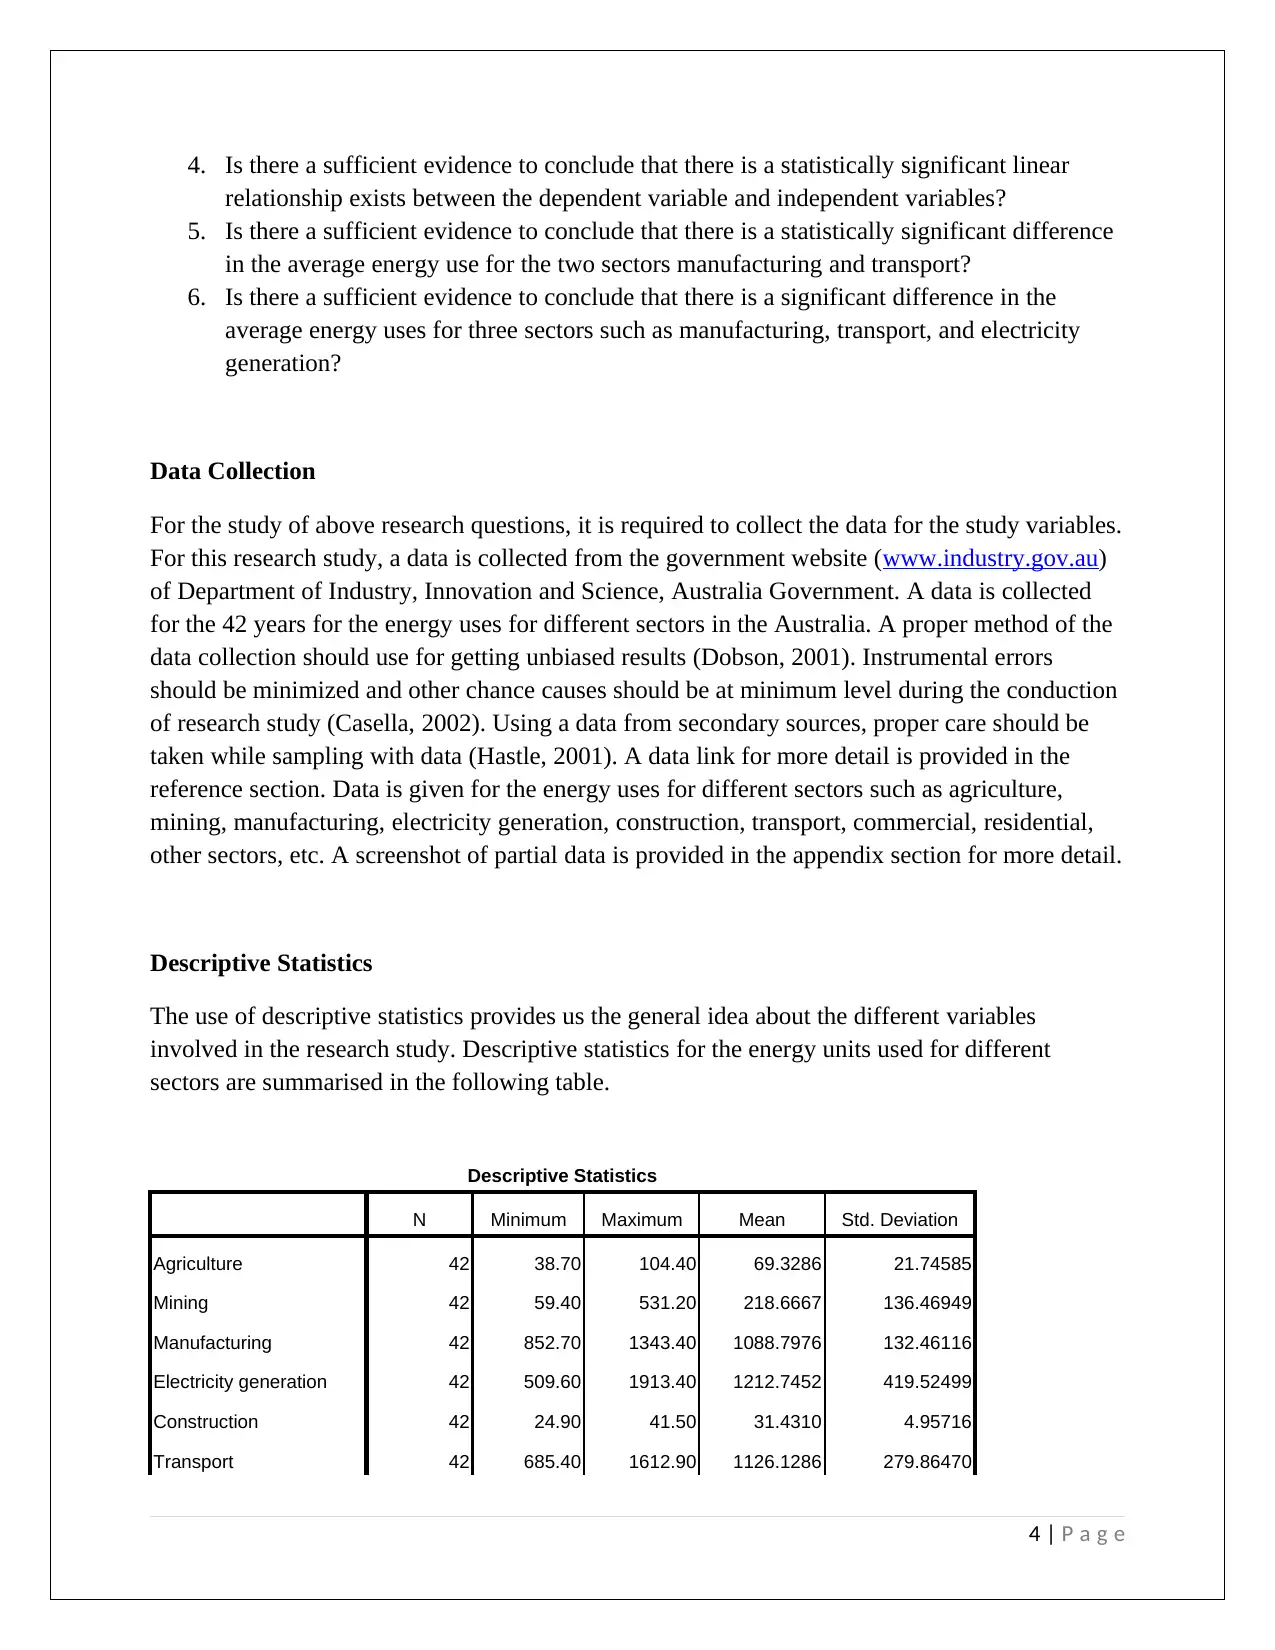
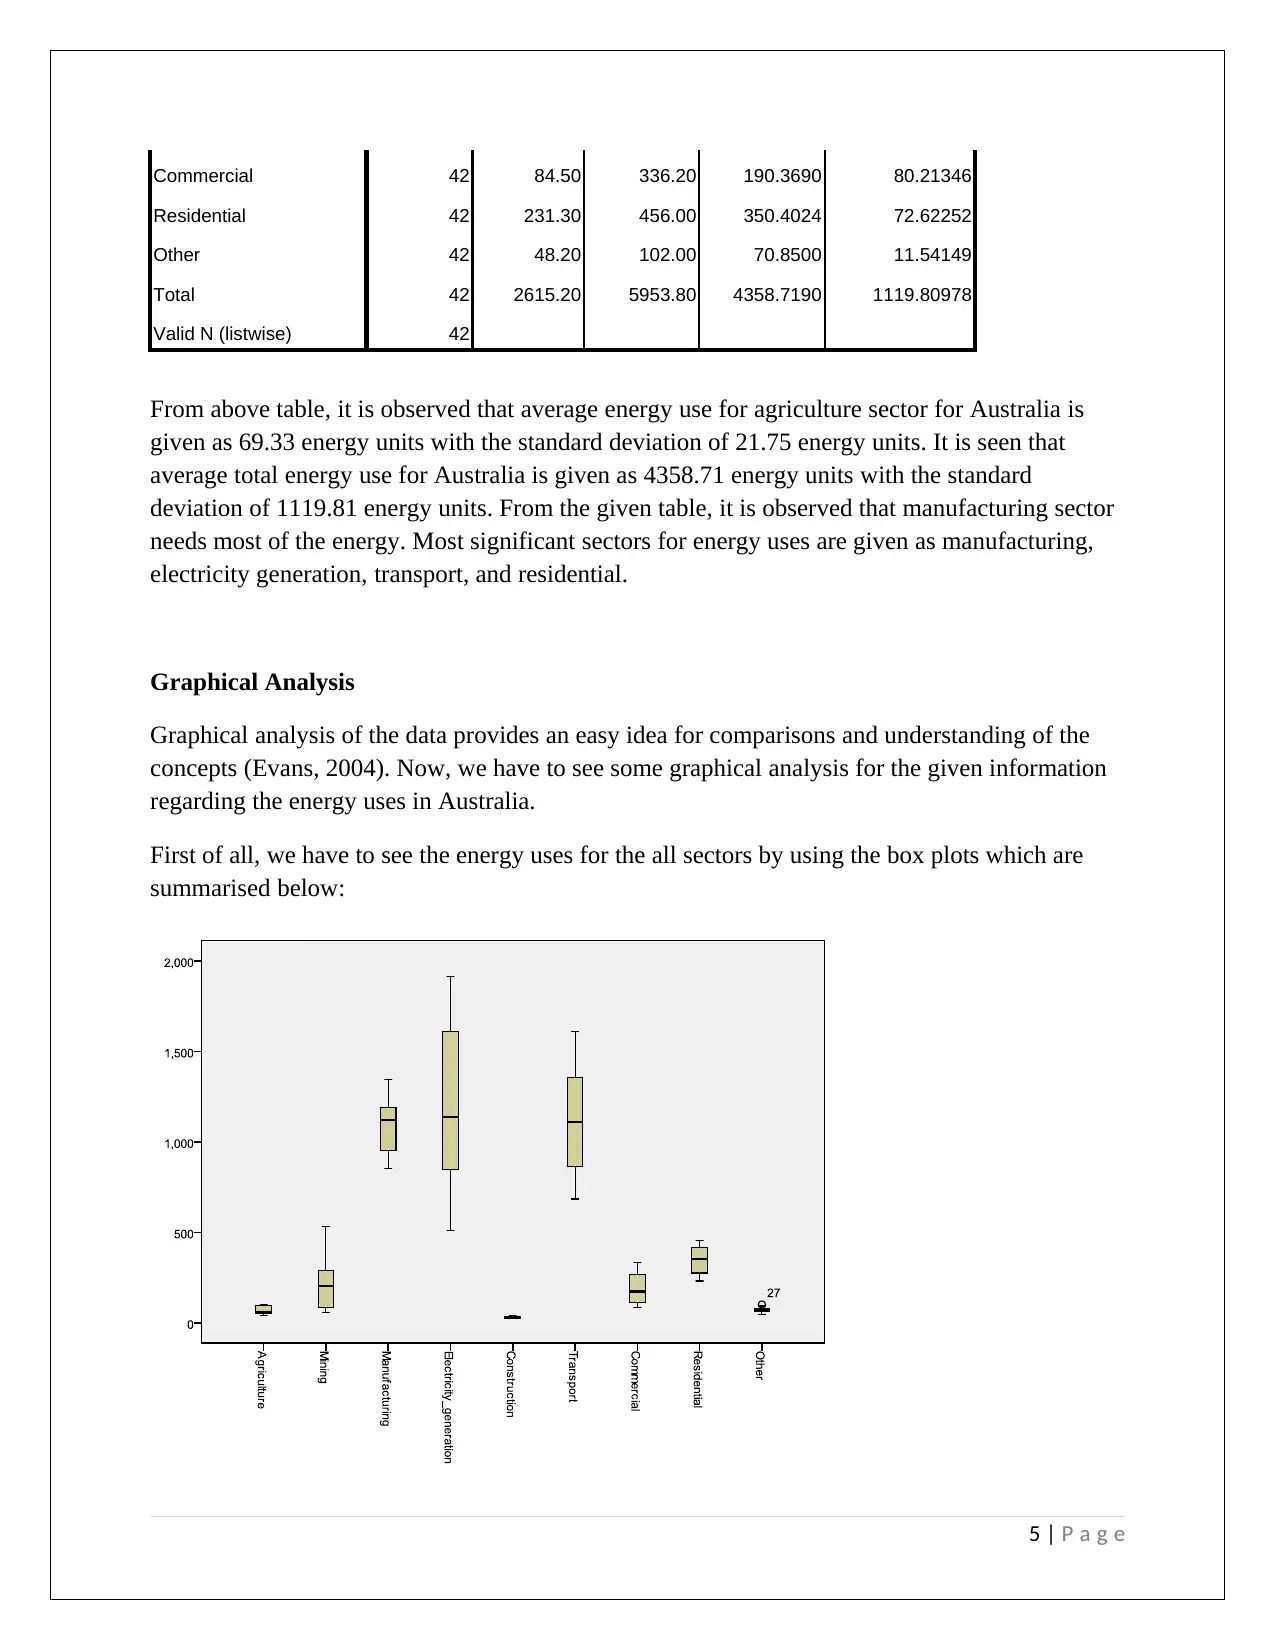
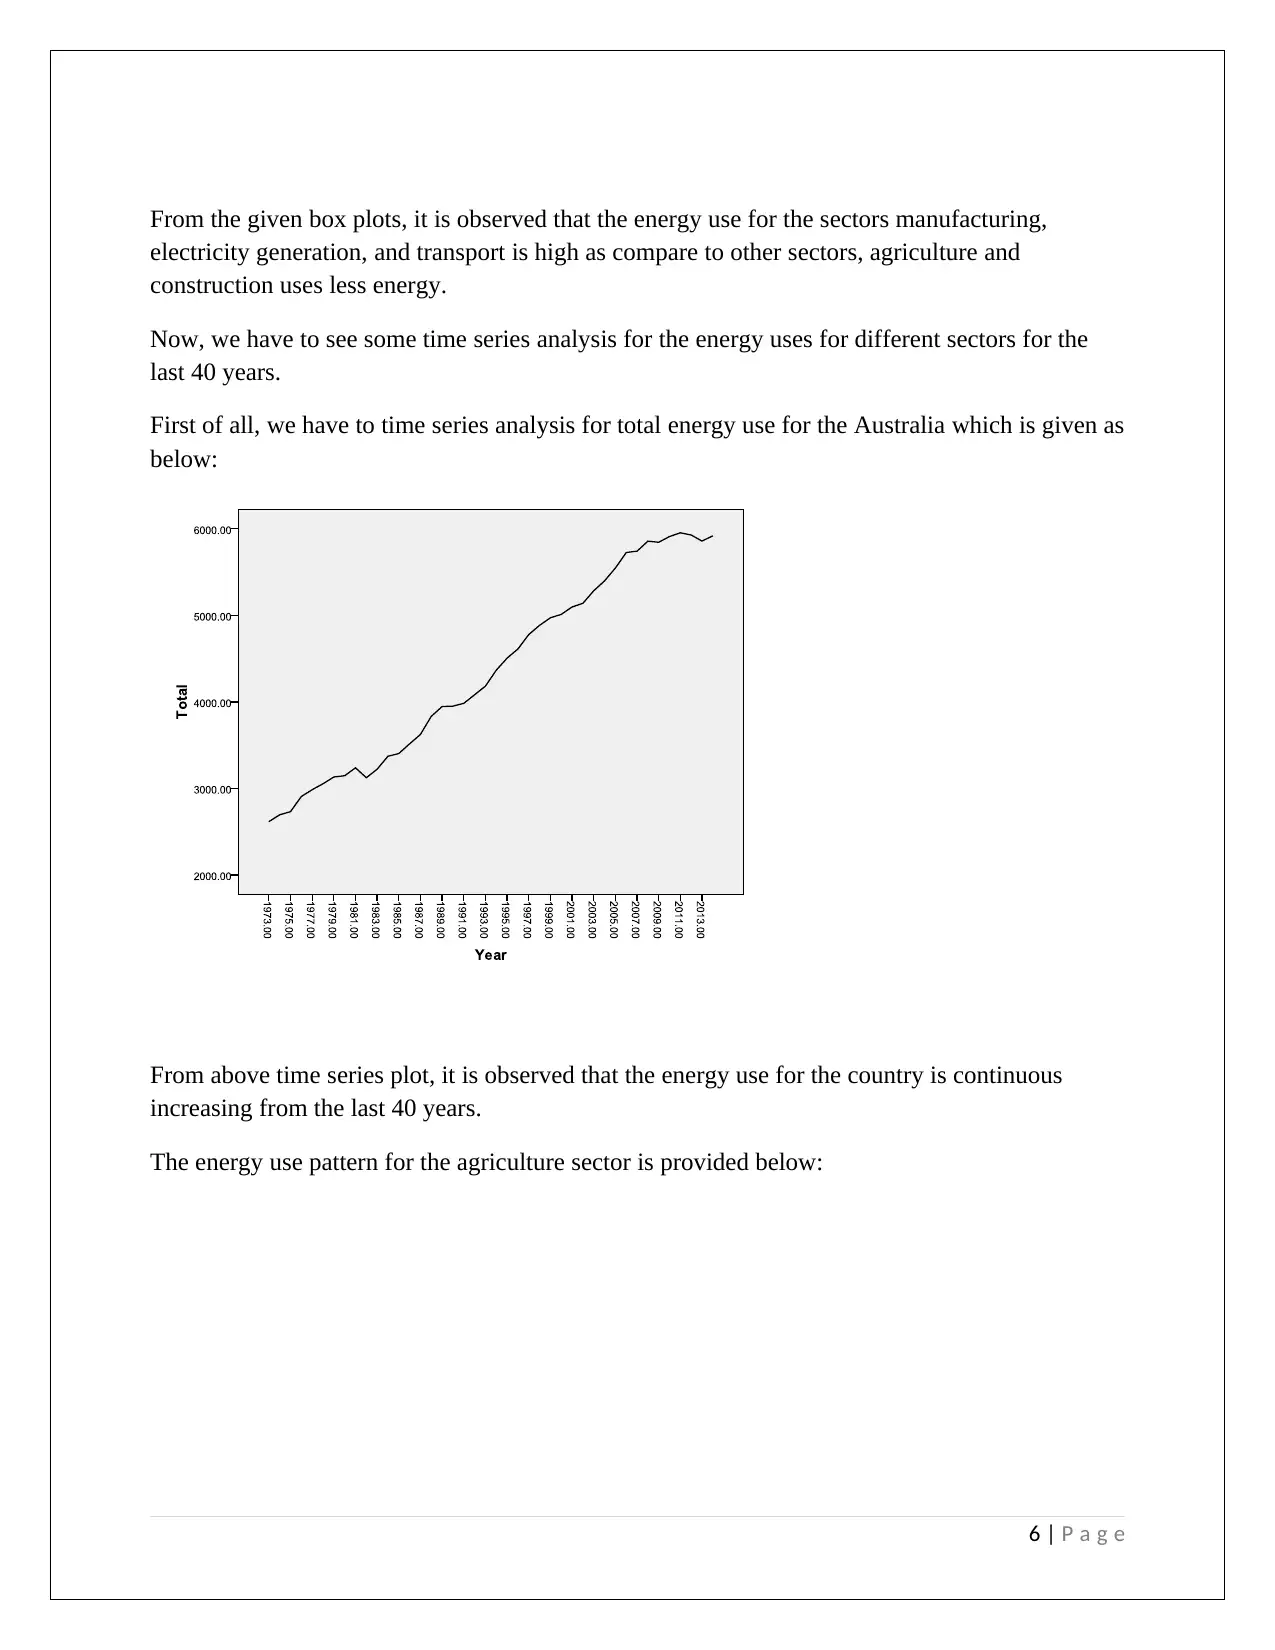
This report presents a comprehensive statistical analysis of energy consumption data across various sectors in Australia, utilizing data collected from the Australian government's Department of Industry, Innovation and Science. The analysis includes descriptive statistics, graphical analysis (box plots and time series plots), correlation and regression analysis, independent samples t-tests, and one-way ANOVA. Key findings reveal that the manufacturing sector exhibits the highest energy consumption, with manufacturing, electricity generation, transport, and residential sectors being the most significant. Time series analysis indicates a continuous increase in overall energy consumption over the past 42 years. The regression model demonstrates a strong linear relationship between dependent and independent variables, while t-tests show insufficient evidence of a significant difference in average energy use between manufacturing and transport. However, ANOVA results suggest a significant difference in average energy use among manufacturing, transport, and electricity generation sectors.
Document Page
Statistical Data Collection and Interpretation
Assessment Item 3
tabler-icon-diamond-filled.svg

Paraphrase This Document

Need a fresh take? Get an instant paraphrase of this document with our AI Paraphraser
Document Page
Table of Contents
Abstract................................................................................................................................3
Introduction..........................................................................................................................3
Research Questions..............................................................................................................4
Data Collection.....................................................................................................................5
Descriptive Statistics............................................................................................................4
Graphical Analysis...............................................................................................................5
Correlation and Regression Analysis...................................................................................3
Independent Samples t-tests.................................................................................................3
One way ANOVA................................................................................................................4
Results and Discussions.......................................................................................................4
Conclusions..........................................................................................................................5
References............................................................................................................................5
2 | P a g e
Document Page
Assessment Item 3
Statistical Data Collection and Interpretation
Abstract
It is observed that average energy use for different sectors in Australia is not same. It is observed
that manufacturing sector needs most of the energy. Most significant sectors for energy uses are
given as manufacturing, electricity generation, transport, and residential. It is observed that the
energy use for the country is continuous increasing from the last 42 years. It is observed that
there is perfect linear relationship exists between the dependent variable and independent
variable for this regression model. There is sufficient evidence to conclude that there is a
statistically significant linear relationship exists between the dependent variable and independent
variables. There is insufficient evidence to conclude that there is a statistically significant
difference in the average energy use for the two sectors manufacturing and transport. There is
sufficient evidence to conclude that there is a significant difference in the average energy uses
for three sectors such as manufacturing, transport, and electricity generation.
Introduction
Statistical data analysis plays an important role in analysing different facts regarding the
business, industry, management, and many more sectors. Statistical analysis for any type of data
is the key for making effective decisions (Hogg, 2004). It helps in making effective decisions
and management according to analysis. Statistical data analysis helps in understand the actual
facts and it improves the creativity of managers (Degroot, 2002). For this research study, we
have to use statistical data analysis for the analysis of energy consumption data for the different
sectors in the Australia. By using this statistical data analysis we have to find out whether there
are any significant differences in the use of energy for the different sectors. Also, we want to
check the different trends in the energy uses in accordance with time factors. We will compare
different sectors for their energy uses and also we will study it for the entire use of energy for the
country. Let us see this research study in detail.
Research Questions
For this statistical data collection and analysis, the research questions are summarised as below:
1. Is there any significant differences observed between the different sectors for energy uses
in Australia?
2. What is the trend of energy uses in Australia for different sectors?
3. Is there any significant relationship exists between the energy uses for the different
sectors?
3 | P a g e
Document Page
4. Is there a sufficient evidence to conclude that there is a statistically significant linear
relationship exists between the dependent variable and independent variables?
5. Is there a sufficient evidence to conclude that there is a statistically significant difference
in the average energy use for the two sectors manufacturing and transport?
6. Is there a sufficient evidence to conclude that there is a significant difference in the
average energy uses for three sectors such as manufacturing, transport, and electricity
generation?
Data Collection
For the study of above research questions, it is required to collect the data for the study variables.
For this research study, a data is collected from the government website (www.industry.gov.au)
of Department of Industry, Innovation and Science, Australia Government. A data is collected
for the 42 years for the energy uses for different sectors in the Australia. A proper method of the
data collection should use for getting unbiased results (Dobson, 2001). Instrumental errors
should be minimized and other chance causes should be at minimum level during the conduction
of research study (Casella, 2002). Using a data from secondary sources, proper care should be
taken while sampling with data (Hastle, 2001). A data link for more detail is provided in the
reference section. Data is given for the energy uses for different sectors such as agriculture,
mining, manufacturing, electricity generation, construction, transport, commercial, residential,
other sectors, etc. A screenshot of partial data is provided in the appendix section for more detail.
Descriptive Statistics
The use of descriptive statistics provides us the general idea about the different variables
involved in the research study. Descriptive statistics for the energy units used for different
sectors are summarised in the following table.
Descriptive Statistics
N Minimum Maximum Mean Std. Deviation
Agriculture 42 38.70 104.40 69.3286 21.74585
Mining 42 59.40 531.20 218.6667 136.46949
Manufacturing 42 852.70 1343.40 1088.7976 132.46116
Electricity generation 42 509.60 1913.40 1212.7452 419.52499
Construction 42 24.90 41.50 31.4310 4.95716
Transport 42 685.40 1612.90 1126.1286 279.86470
4 | P a g e
tabler-icon-diamond-filled.svg

Paraphrase This Document

Need a fresh take? Get an instant paraphrase of this document with our AI Paraphraser
Document Page
Commercial 42 84.50 336.20 190.3690 80.21346
Residential 42 231.30 456.00 350.4024 72.62252
Other 42 48.20 102.00 70.8500 11.54149
Total 42 2615.20 5953.80 4358.7190 1119.80978
Valid N (listwise) 42
From above table, it is observed that average energy use for agriculture sector for Australia is
given as 69.33 energy units with the standard deviation of 21.75 energy units. It is seen that
average total energy use for Australia is given as 4358.71 energy units with the standard
deviation of 1119.81 energy units. From the given table, it is observed that manufacturing sector
needs most of the energy. Most significant sectors for energy uses are given as manufacturing,
electricity generation, transport, and residential.
Graphical Analysis
Graphical analysis of the data provides an easy idea for comparisons and understanding of the
concepts (Evans, 2004). Now, we have to see some graphical analysis for the given information
regarding the energy uses in Australia.
First of all, we have to see the energy uses for the all sectors by using the box plots which are
summarised below:
5 | P a g e
Document Page
From the given box plots, it is observed that the energy use for the sectors manufacturing,
electricity generation, and transport is high as compare to other sectors, agriculture and
construction uses less energy.
Now, we have to see some time series analysis for the energy uses for different sectors for the
last 40 years.
First of all, we have to time series analysis for total energy use for the Australia which is given as
below:
From above time series plot, it is observed that the energy use for the country is continuous
increasing from the last 40 years.
The energy use pattern for the agriculture sector is provided below:
6 | P a g e
Document Page
From above time series plot, it is observed the energy use is continuously increasing for the
agriculture sector with some up and down movement for past some years.
For the section mining, the energy use is explained by using the following time series plot.
7 | P a g e
tabler-icon-diamond-filled.svg

Paraphrase This Document

Need a fresh take? Get an instant paraphrase of this document with our AI Paraphraser
Document Page
From above given time series plot, it is observed that the energy use for the mining sector is
continuously increasing.
For manufacturing sector, the time series plot for energy uses is given as below:
For electricity generation sector, the time series plot for energy uses is given as below:
For construction sector, the time series plot for energy uses is given as below:
8 | P a g e
Document Page
For transport sector, the time series plot for energy uses is given as below:
For commercial sector, the time series plot for energy uses is given as below:
9 | P a g e
Document Page
For residential sector, the time series plot for energy uses is given as below:
10 | P a g e
tabler-icon-diamond-filled.svg

Paraphrase This Document

Need a fresh take? Get an instant paraphrase of this document with our AI Paraphraser
Document Page
Correlation and Linear Regression
The study of correlation and linear regression is the significant statistical procedure for obtaining
the future and current values for the response variable (Cox, 2000). In this section, we have to
see some correlation coefficients for the different energy sectors and these correlation
coefficients with their significances are provided below:
Agricultur
e
Minin
g
Manufacturin
g
Electricity
generation
Constructio
n
Agriculture Pearson
Correlatio
n
1 .911** .868** .965** -.715**
Sig. (2-
tailed)
0 0 0 0
N 42 42 42 42 42
Mining Pearson
Correlatio
n
.911** 1 .888** .891** -.710**
Sig. (2-
tailed)
0 0 0 0
N 42 42 42 42 42
Manufacturin
g
Pearson
Correlatio
n
.868** .888** 1 .915** -.669**
Sig. (2-
tailed)
0 0 0 0
N 42 42 42 42 42
Electricity
generation
Pearson
Correlatio
n
.965** .891** .915** 1 -.670**
Sig. (2-
tailed)
0 0 0 0
N 42 42 42 42 42
Construction Pearson
Correlatio
n
-.715** -.710*
*
-.669** -.670** 1
Sig. (2-
tailed)
0 0 0 0
N 42 42 42 42 42
It is observed that there is strong positive correlations are exists between the different sectors for
the energy uses. The agriculture sector and mining sector shows the correlation coefficient of
0.911, which indicate a strong linear relationship between these two sectors. Also, there are some
negative correlations exists between some pairs of sectors for energy uses.
The pairs of different energy use sectors with positive correlations include agriculture and
mining, agriculture and manufacturing, agriculture and electricity generation, etc. The pairs of
11 | P a g e
Document Page
different energy use sectors with negative correlations include agriculture and construction,
mining and construction, electricity generation and construction, etc.
Now, we have to see the multiple linear regression model for the prediction of total energy use
based on the different energy use sectors. Required regression model is summarised as below:
Variables Entered/Removedb
Model
Variables
Entered
Variables
Removed Method
1 Construction,
Manufacturing,
Agriculture,
Mining, Electricity
generation
. Enter
a. All requested variables entered.
b. Dependent Variable: Total
Model Summary
Model R R Square
Adjusted R
Square
Std. Error of the
Estimate
1 1.000a .999 .999 27.41965
a. Predictors: (Constant), Construction, Manufacturing, Agriculture,
Mining, Electricity generation
From the above table, it is observed that there is perfect linear relationship exists between the
dependent variable and independent variable for this regression model. The value of R square or
coefficient of determination is given as 0.999, which means about 99.9% of the variation in the
dependent variable is explained by the independent variables. The ANOVA table for this
regression model is given as below:
12 | P a g e
chevron_up_icon
1 out of 20
circle_padding
hide_on_mobile
zoom_out_icon
[object Object]