Data-Driven Analysis of Employee Retention and Satisfaction

Verified

Added on  2022/08/09

|7
|1164
|24
Homework Assignment
AI Summary
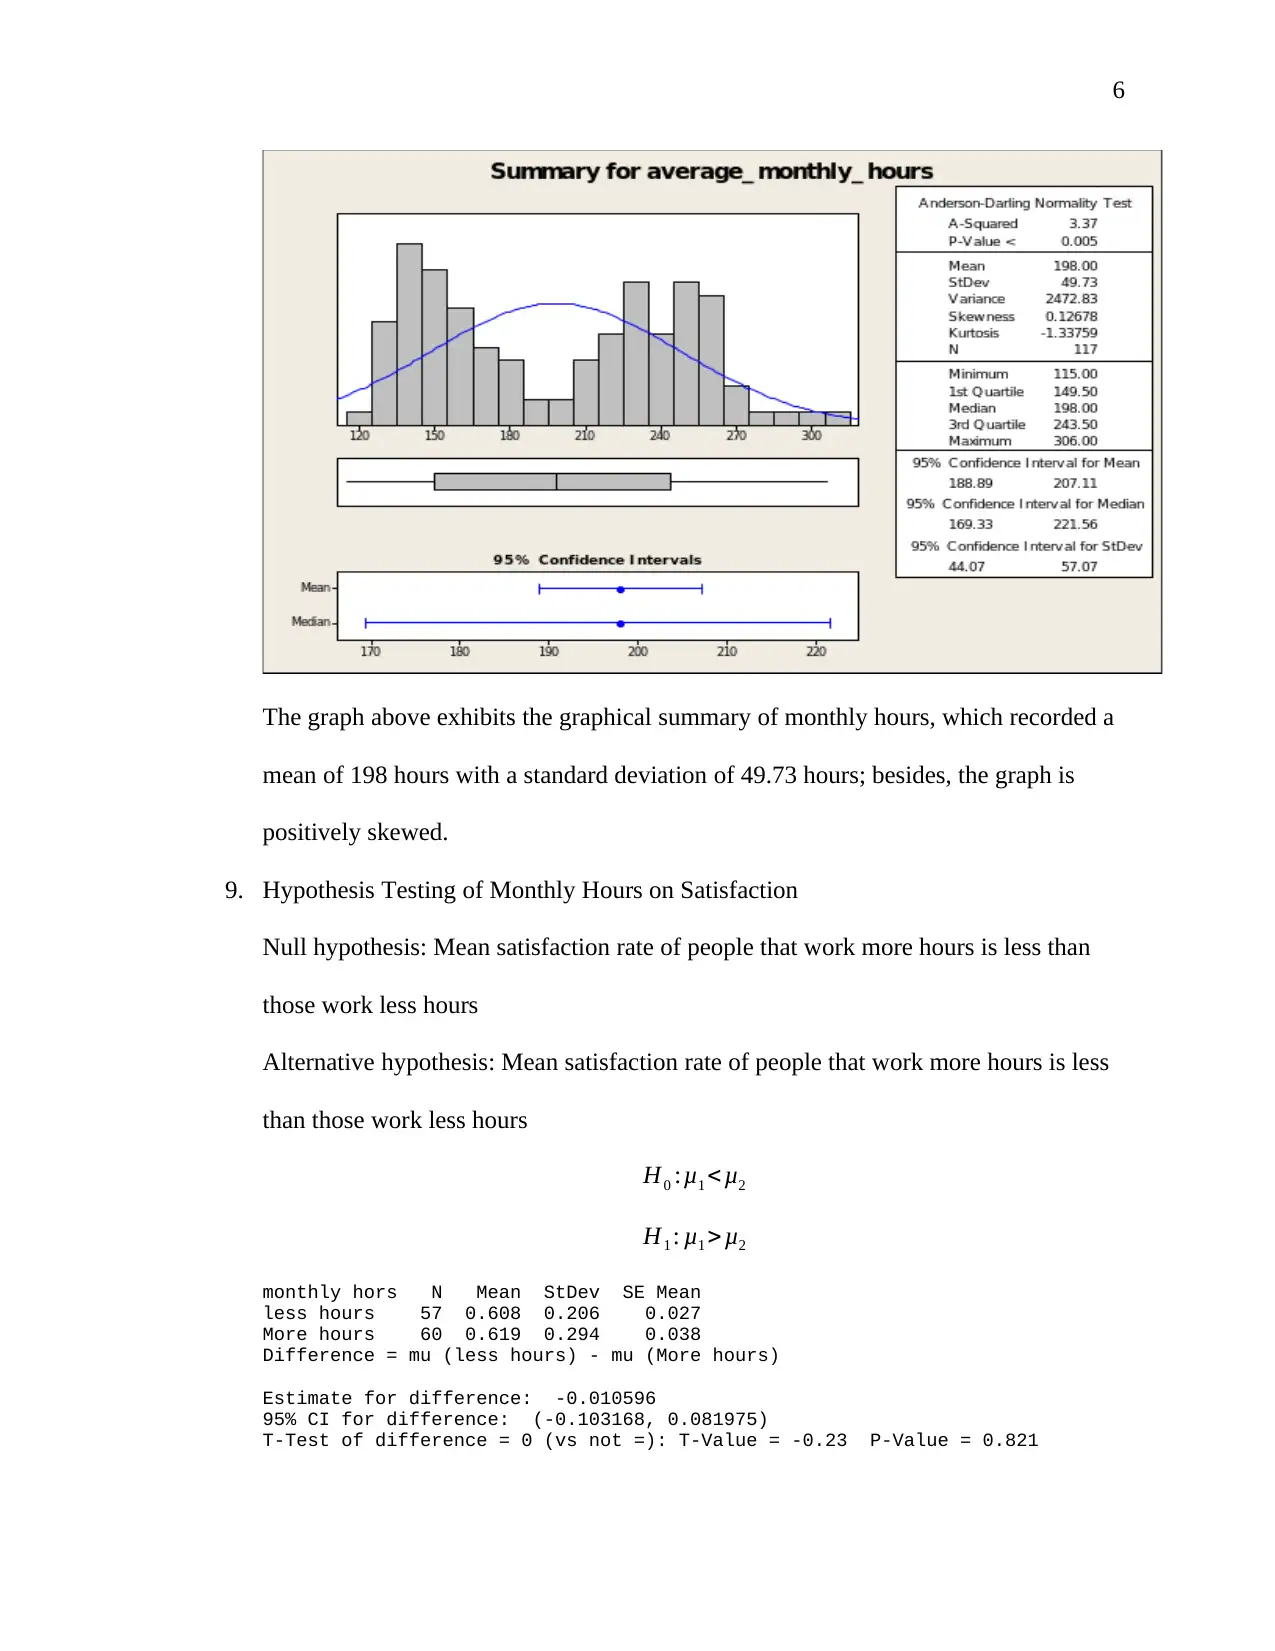
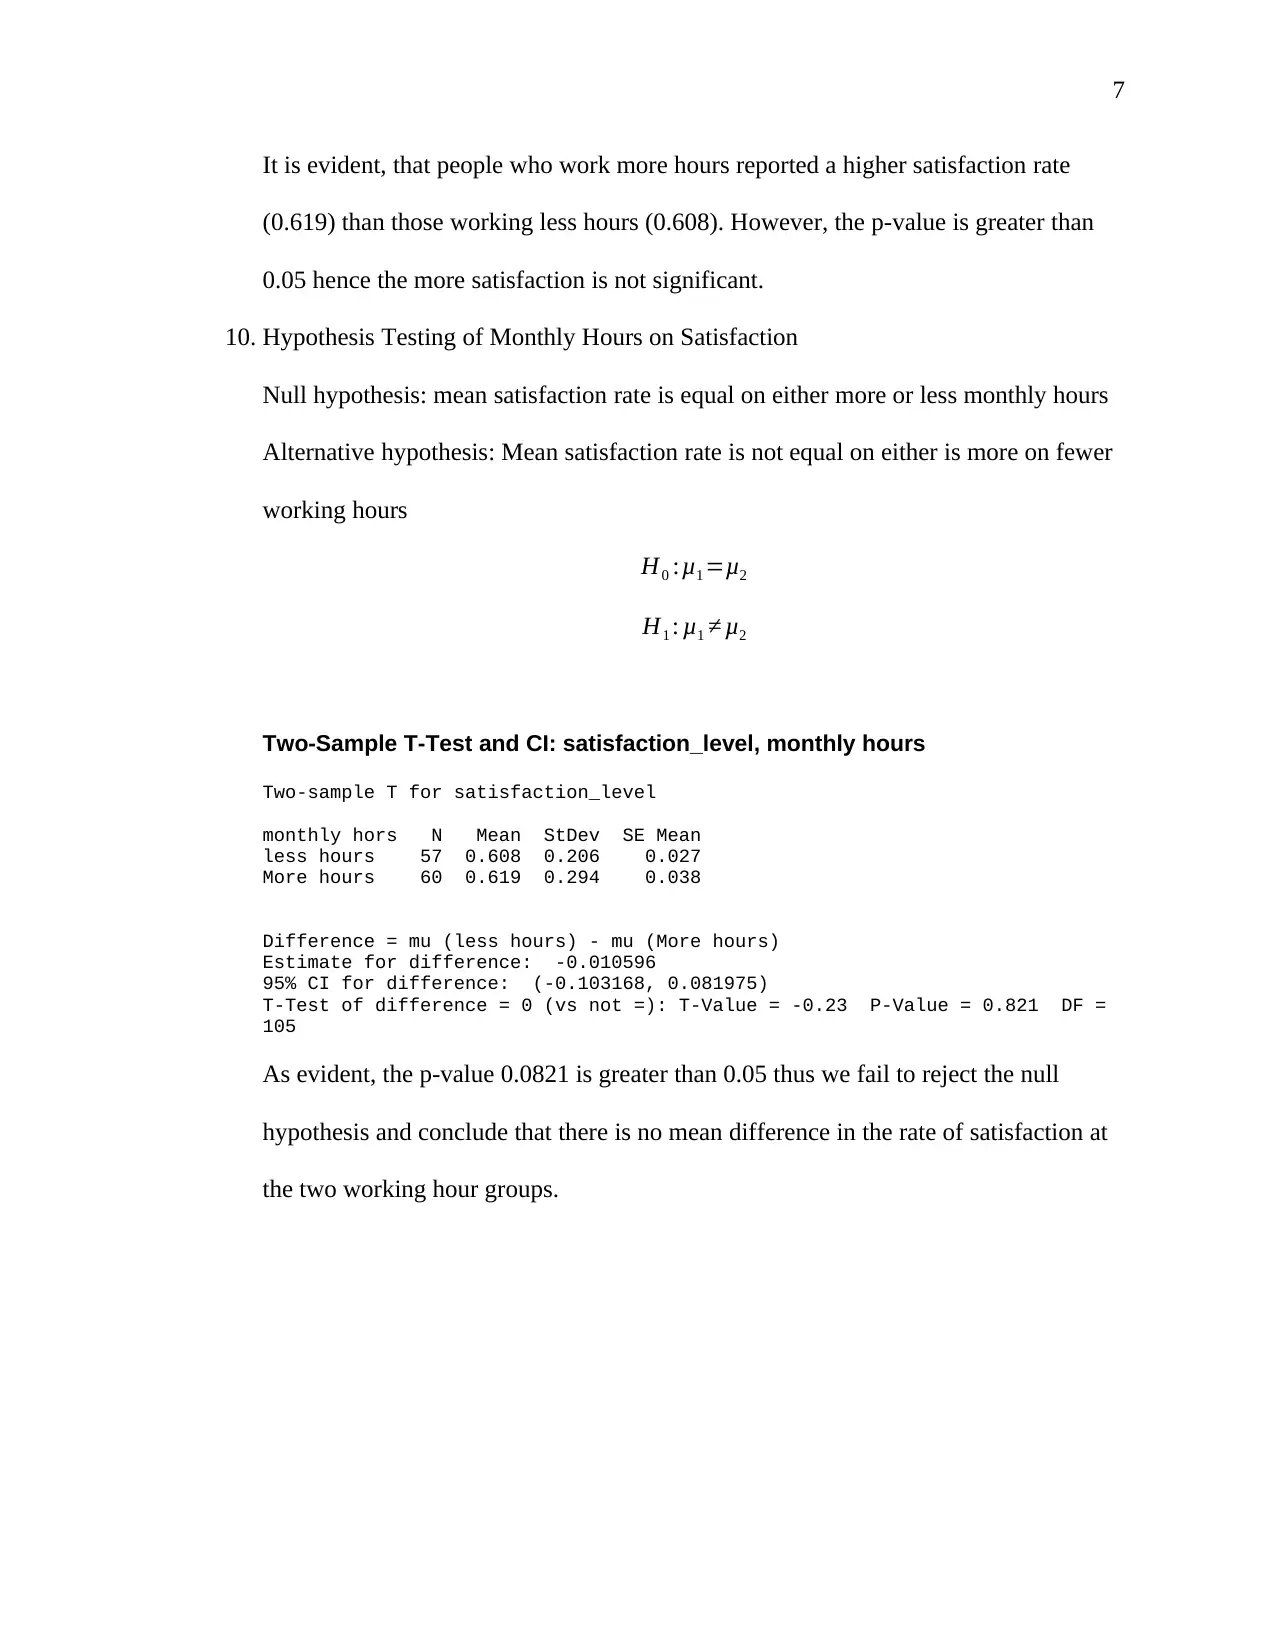
This assignment provides a comprehensive statistical analysis of employee retention, examining various factors influencing employee satisfaction and turnover. The analysis includes hypothesis testing on variables such as employee tenure, number of projects, accidents at work, and monthly working hours. The study utilizes confidence intervals and p-values to determine the significance of these factors. Key findings reveal insights into employee satisfaction levels and their correlation with different aspects of their work environment. The analysis rejects several null hypotheses, concluding that variables like tenure and the number of projects significantly impact satisfaction. However, the study also finds that there is no significant difference in satisfaction levels between those working different monthly hours. The assignment aims to identify factors that impact employee retention and satisfaction, providing actionable insights for organizations to improve their employee retention strategies.
Document Page
1
Employee Retention
Name:
Institution:
tabler-icon-diamond-filled.svg

Paraphrase This Document

Need a fresh take? Get an instant paraphrase of this document with our AI Paraphraser
Document Page
2
1. Probability
p = 0.4 p0 = 0.2 n = 117
Z= p p0
p0 ( 1 p0 )
n
= 0.4 0.2
0.20.8
117
= 0.2
0.037 =5.408
P(Z=5.408) = 0
Test and CI for One Proportion
Test of p = 0.4 vs p not = 0.4
Sample X N Sample p 95% CI Z-Value P-Value
1 23 117 0.196581 (0.124570, 0.268592) -4.49 0.000
It is evident that the probability that 40% or more of the employees leaving the
employment is 0. Moreover, 40% does not fall within the 95% CI of the 20% thus it
appear that a 40% exodus would be unusual.
2. Confidence Interval
Test and CI for One Proportion: Left Company
Test of p = 0.5 vs p not = 0.5
Event = Yes
Variable X N Sample p 95% CI Z-Value P-Value
Left Company 52 117 0.444444 (0.354406, 0.534483) -1.20 0.229
As shown, the confidence interval of the proportion of employees that left the
company is 35.44% to 53.44%. Consequently, the 20% does not fall within the
intervals thus the it is wrong to suggest that 20% of the employees had left.
3. Classification: Left Company
Variable Value Count
Left
Company
Yes 52 (Event
)
no 65
Document Page
3
Total 117
satisfaction_level 0.0006
last_evaluation 1.5331
number_project 0.4236
Tenure at
Company
4.4848
As evident, tenure at the company recorded the highest value thus it may be a
surrogate measure for whether a person left the company or not.
4. Confidence Intervals: Satisfaction Level
Null hypothesis: mean satisfaction rate is equal to 0.8
Alternative hypothesis: Mean satisfaction rate is not equal to 0.8
H0 :μ=0.8
H1 : μ 0.8
Significance level: 0.05
One-Sample T: satisfaction level
Test of mu = 0.8 vs not = 0.8
Variable N Mean StDev SE Mean 95% CI
satisfaction_lev 117 0.613504 0.253613 0.023447 (0.567065, 0.659943)
Variable T P
satisfaction_lev -7.95 0.000
The mean satisfaction level of the employees is 0.6135 with as confidence interval of
0.567 to 0.660. Moreover, the p-value 0.000 is less than 0.05 thus we reject the null
hypothesis and conclude that the mean satisfaction rate is not equal to 0.8
5. Hypothesis Testing of Number of projects on Satisfaction
Null hypothesis: mean satisfaction rate is equal on either more or less number of
projects
Document Page
4
Alternative hypothesis: Mean satisfaction rate is not equal on either more or less
number of projects
H0 :μ1 =μ2
H1 : μ1 μ2
Significance Level: 0.05
Number_projects
N Mean StDev SE Mean
less projects 103 0.665 0.204 0.020
More projects 14 0.234 0.265 0.071
Difference = mu (less projects) - mu (More projects)
Estimate for difference: 0.431574
95% CI for difference: (0.274440, 0.588708)
T-Test of difference = 0 (vs not =): T-Value = 5.85 P-Value = 0.000 DF =
15
As evident, the p-value 0.000 is less than 0.05 thus we reject the null hypothesis and
conclude that the number of projects affect the rate of satisfaction thus there is a mean
difference in level of satisfaction.
6. Hypothesis Testing of Accidents on Satisfaction
Null hypothesis: Mean satisfaction rate of people with accidents is lesser than a
person with no accidents.
Alternative hypothesis: Mean satisfaction rate of people with accidents is higher than
a person with no accidents.
H0 :μ1 < μ2
H1 : μ1 > μ2
Accident at work
N Mean StDev SE Mean
no 105 0.599 0.261 0.025
Yes 12 0.740 0.129 0.037
Difference = mu (no) - mu (Yes)
Estimate for difference: -0.140952
95% CI for difference: (-0.234163, -0.047742)
tabler-icon-diamond-filled.svg

Paraphrase This Document

Need a fresh take? Get an instant paraphrase of this document with our AI Paraphraser
Document Page
5
T-Test of difference = 0 (vs not =): T-Value = -3.13 P-Value = 0.005 DF =
23
As evident, the p-value 0.000 is less than 0.05 thus we reject the null hypothesis and
conclude that the mean satisfaction rate of people with accidents is higher than a
person with no accidents.
7. Hypothesis Testing of Number of years on Satisfaction
Null hypothesis: mean satisfaction rate is equal on either more or less number of
years
Alternative hypothesis: Mean satisfaction rate is not equal on either more or less
number of years
Two-Sample T-Test and CI: satisfaction_level, Tenure
Two-sample T for satisfaction_level
Tenure N Mean StDev SE Mean
less years 97 0.577 0.258 0.026
More years 20 0.792 0.132 0.029
Difference = mu (less years) - mu (More years)
Estimate for difference: -0.214696
95% CI for difference: (-0.293635, -0.135757)
As evident, the p-value 0.000 is less than 0.05 thus we reject the null hypothesis and
conclude that the number of years affect the rate of satisfaction thus there is a mean
difference in level of satisfaction, whereby the longer the tenure the more satisfaction.
8. Graphical Summary
Document Page
6
The graph above exhibits the graphical summary of monthly hours, which recorded a
mean of 198 hours with a standard deviation of 49.73 hours; besides, the graph is
positively skewed.
9. Hypothesis Testing of Monthly Hours on Satisfaction
Null hypothesis: Mean satisfaction rate of people that work more hours is less than
those work less hours
Alternative hypothesis: Mean satisfaction rate of people that work more hours is less
than those work less hours
H0 :μ1 < μ2
H1 : μ1 > μ2
monthly hors N Mean StDev SE Mean
less hours 57 0.608 0.206 0.027
More hours 60 0.619 0.294 0.038
Difference = mu (less hours) - mu (More hours)
Estimate for difference: -0.010596
95% CI for difference: (-0.103168, 0.081975)
T-Test of difference = 0 (vs not =): T-Value = -0.23 P-Value = 0.821
Document Page
7
It is evident, that people who work more hours reported a higher satisfaction rate
(0.619) than those working less hours (0.608). However, the p-value is greater than
0.05 hence the more satisfaction is not significant.
10. Hypothesis Testing of Monthly Hours on Satisfaction
Null hypothesis: mean satisfaction rate is equal on either more or less monthly hours
Alternative hypothesis: Mean satisfaction rate is not equal on either is more on fewer
working hours
H0 :μ1 =μ2
H1 : μ1 μ2
Two-Sample T-Test and CI: satisfaction_level, monthly hours
Two-sample T for satisfaction_level
monthly hors N Mean StDev SE Mean
less hours 57 0.608 0.206 0.027
More hours 60 0.619 0.294 0.038
Difference = mu (less hours) - mu (More hours)
Estimate for difference: -0.010596
95% CI for difference: (-0.103168, 0.081975)
T-Test of difference = 0 (vs not =): T-Value = -0.23 P-Value = 0.821 DF =
105
As evident, the p-value 0.0821 is greater than 0.05 thus we fail to reject the null
hypothesis and conclude that there is no mean difference in the rate of satisfaction at
the two working hour groups.
chevron_up_icon
1 out of 7
circle_padding
hide_on_mobile
zoom_out_icon
[object Object]