STAT 3013: Statistical Analysis of Exam Scores - Fall 2018
VerifiedAdded on 2023/06/04
|8
|785
|125
Homework Assignment
AI Summary
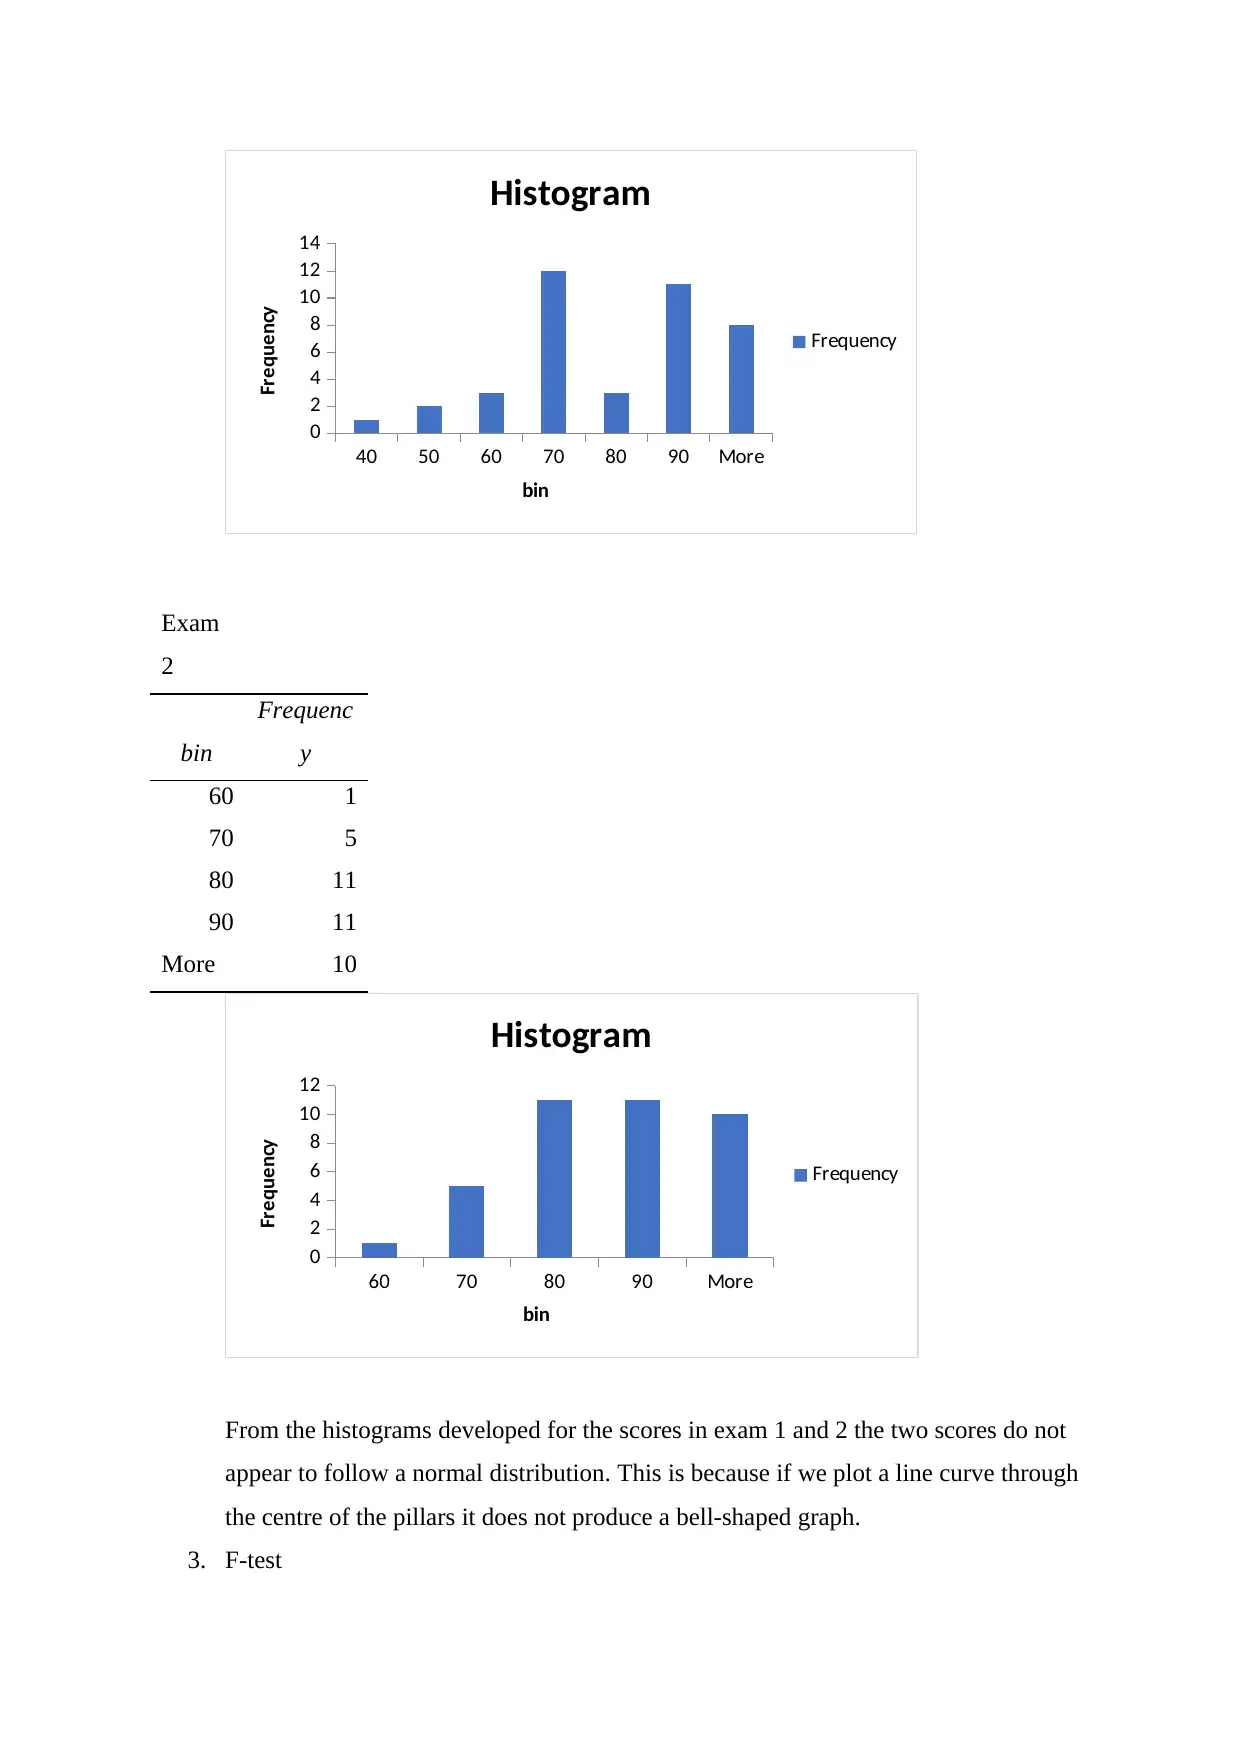
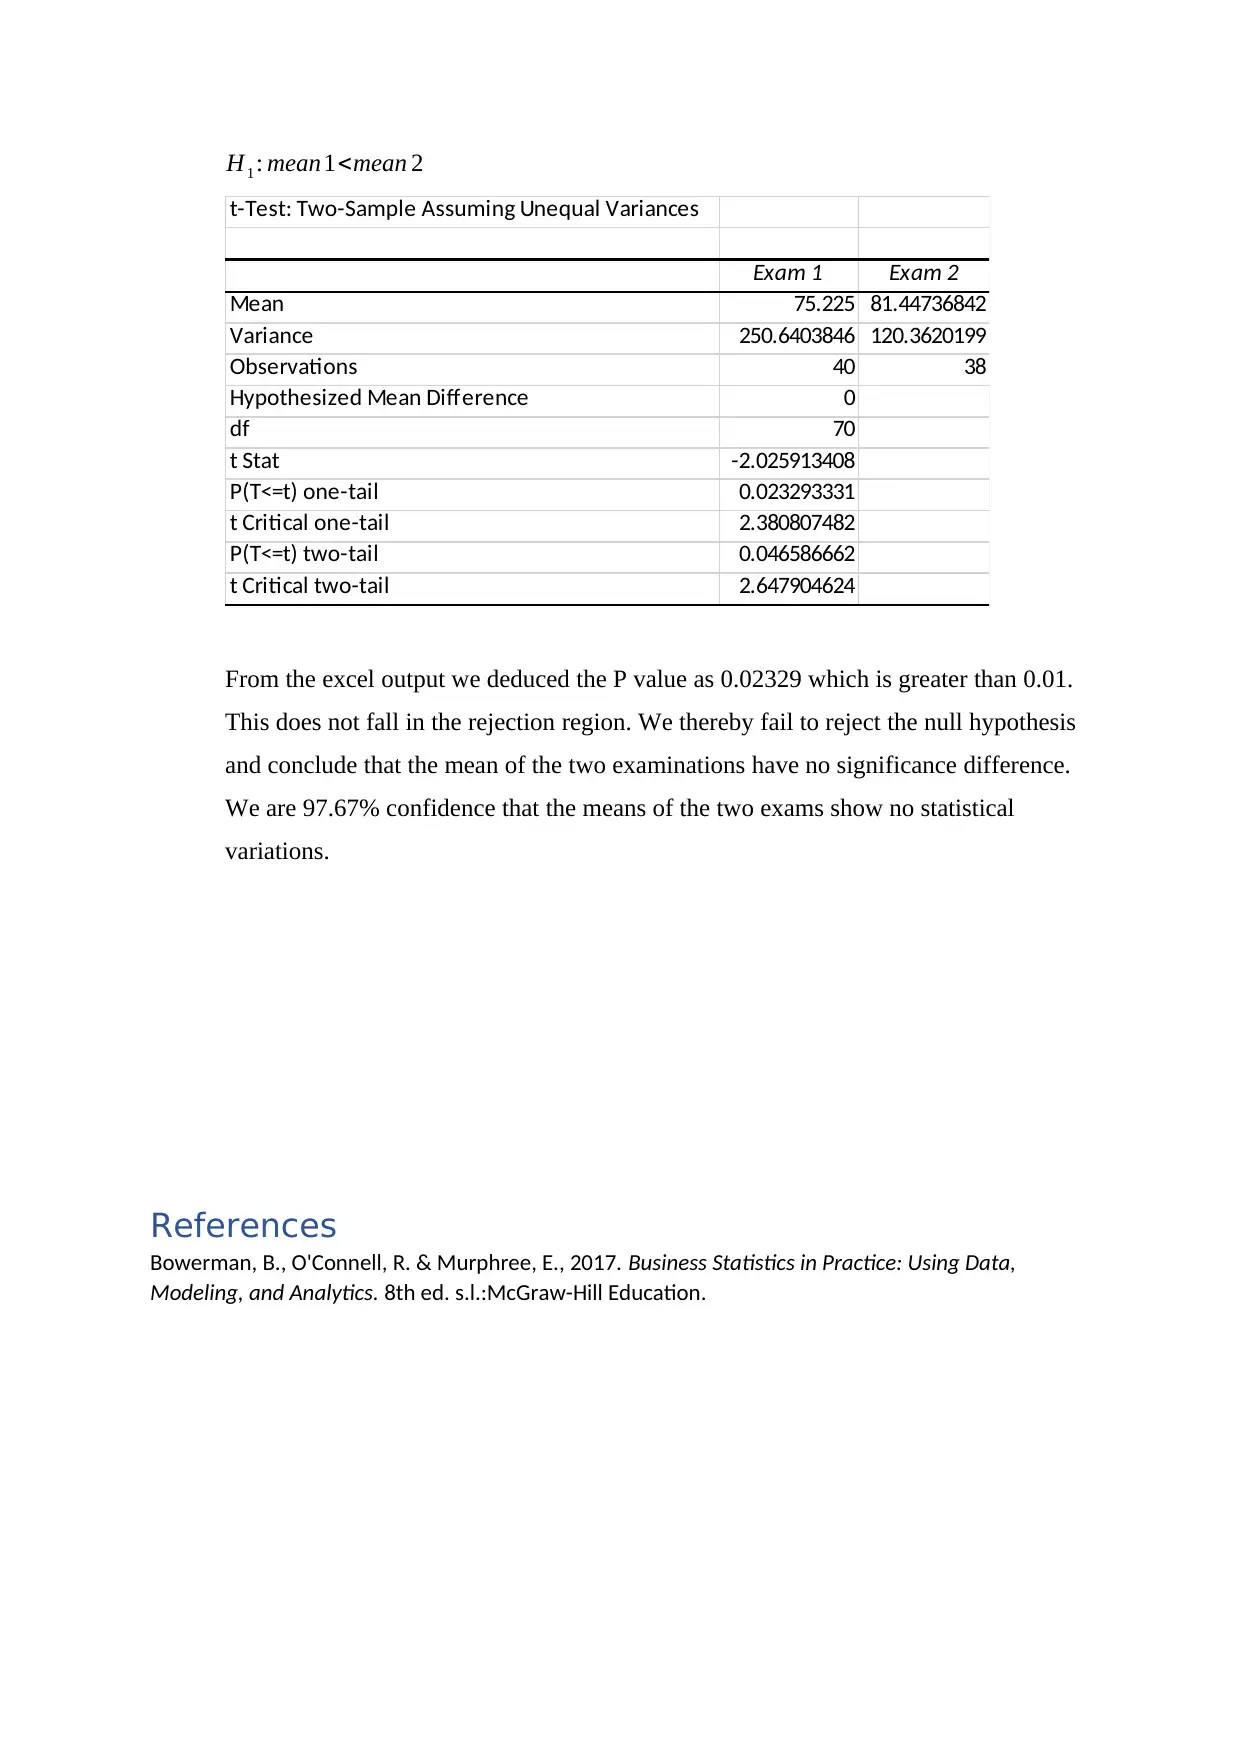
This assignment analyzes two sets of exam scores using various statistical methods. The analysis begins with the construction and comparison of boxplots for each exam to identify differences in score distributions and the presence of outliers. Histograms are then created to assess whether the scores follow a normal distribution. An F-test is performed to determine if the variances between the two exams are significantly different. A 95% confidence interval is constructed for the difference between the mean scores to compare the means of the two exams. Finally, a hypothesis test is conducted to determine if the mean score of one exam is significantly higher than the other. The results of each statistical test are presented with interpretations based on the data provided and the specified significance levels.


1 out of 8
Related Documents


Your All-in-One AI-Powered Toolkit for Academic Success.
+13062052269
info@desklib.com
Available 24*7 on WhatsApp / Email
![[object Object]](/_next/static/media/star-bottom.7253800d.svg)
Copyright © 2020–2026 A2Z Services. All Rights Reserved. Developed and managed by ZUCOL.