Hypothesis Testing and Statistical Analysis: Statistics Homework

Verified

Added on  2022/07/29

|8
|665
|24
Homework Assignment
AI Summary
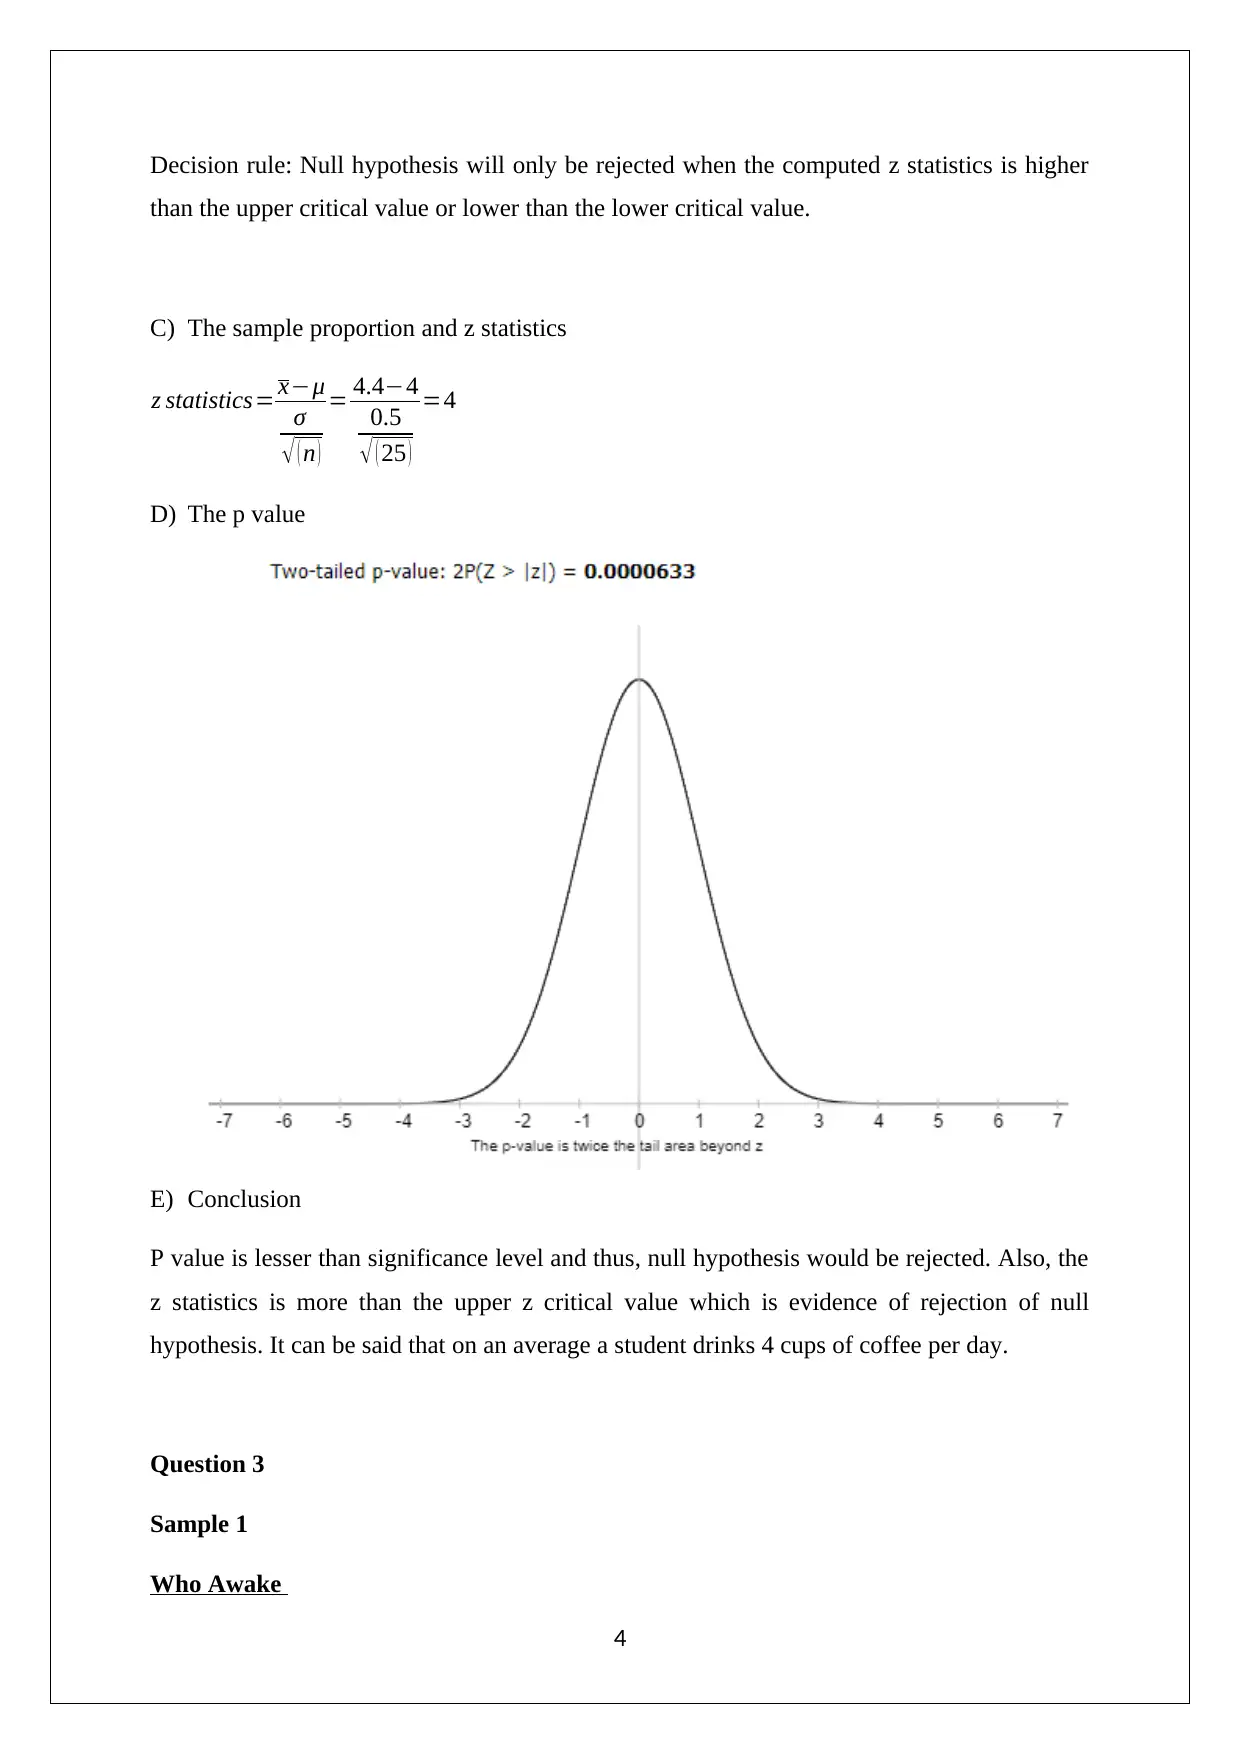
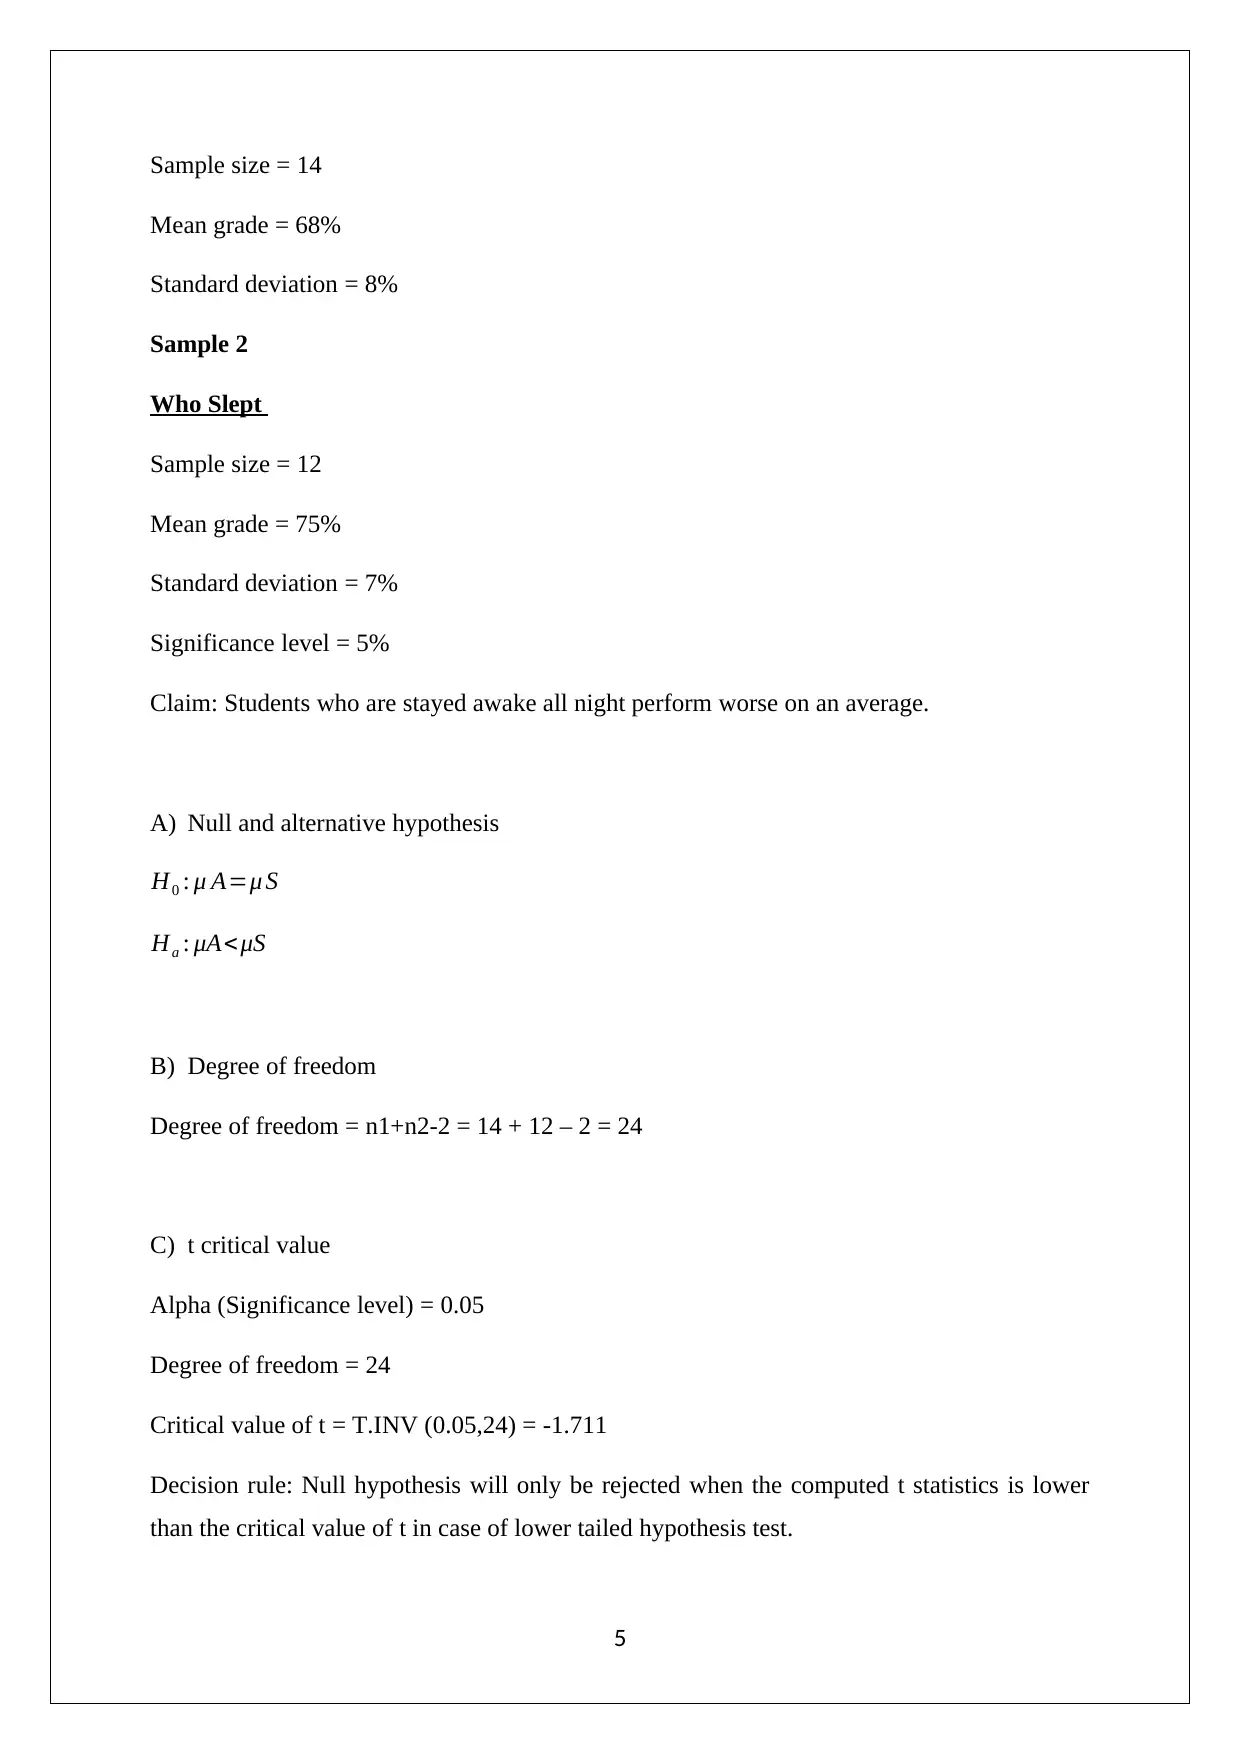
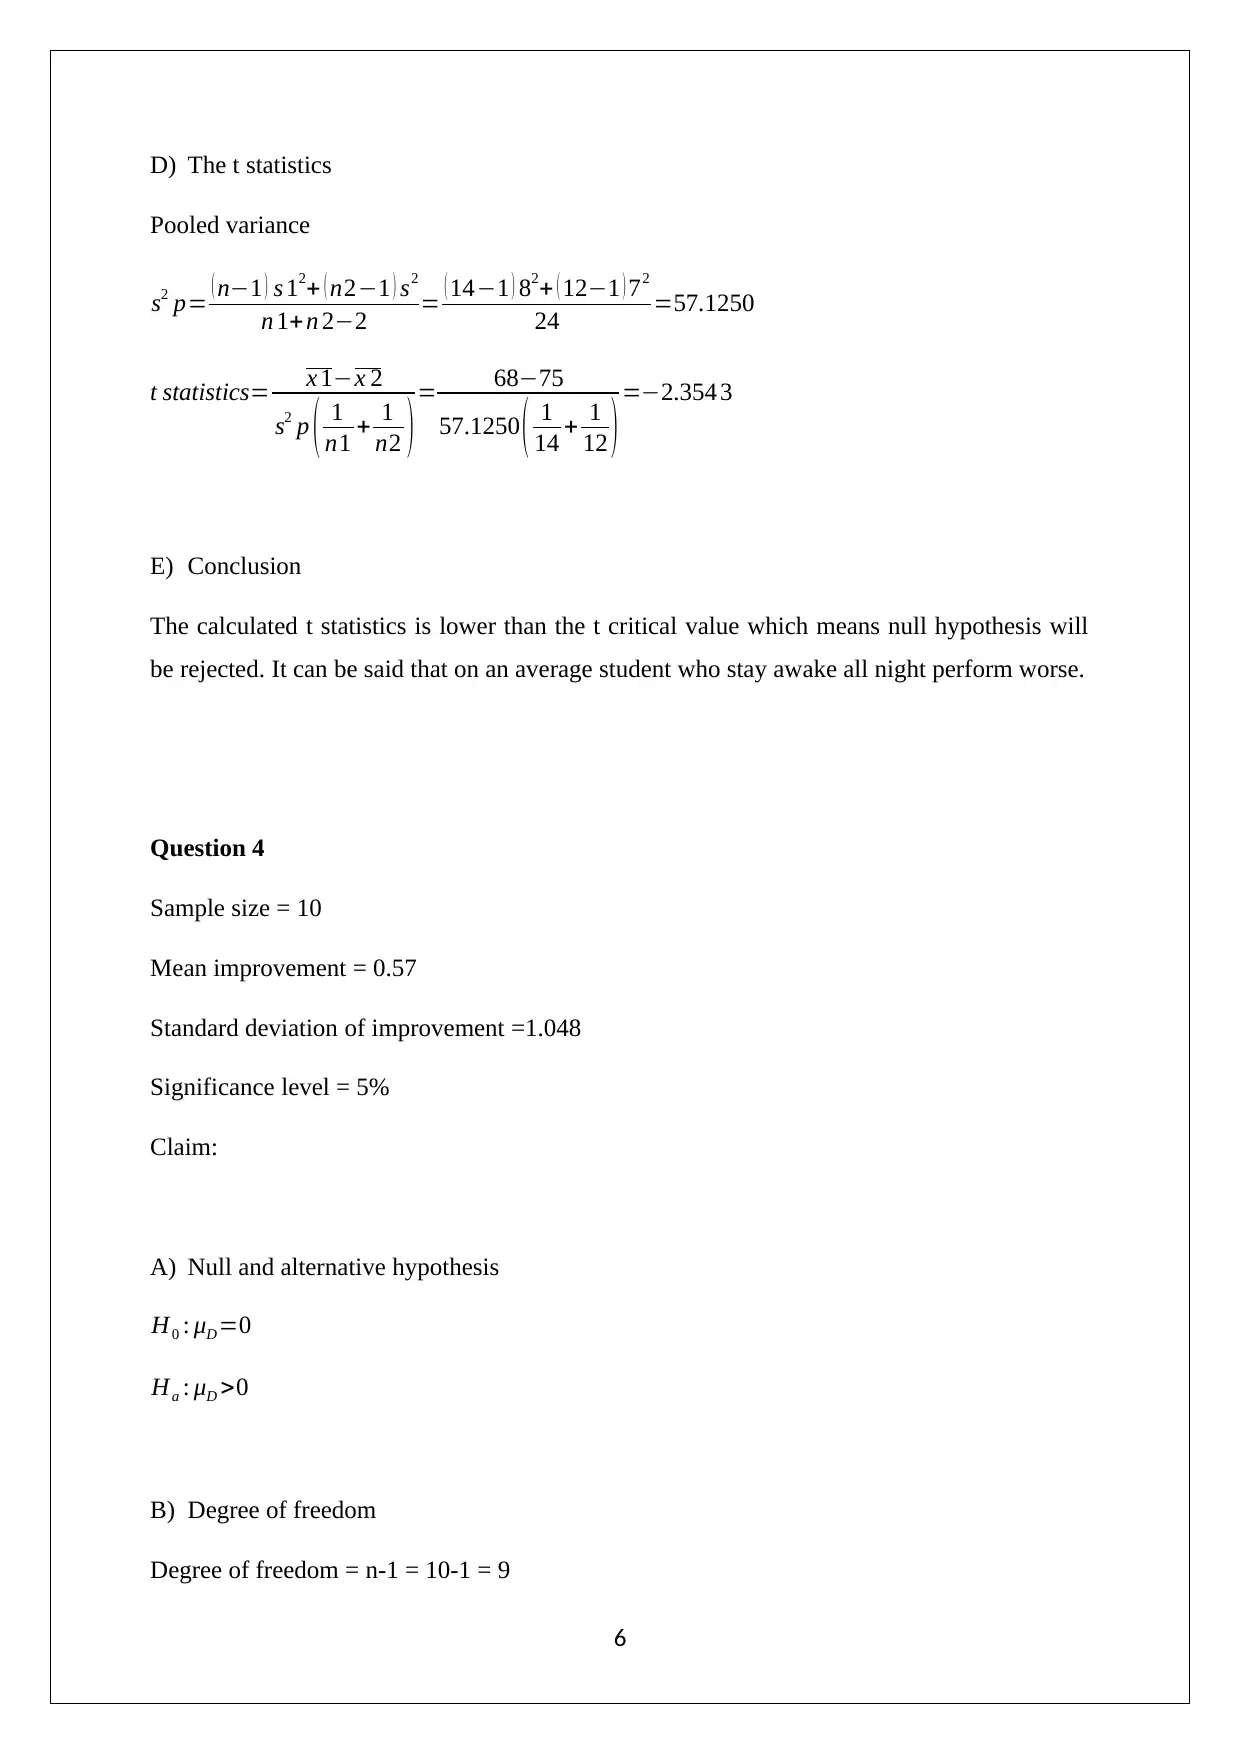
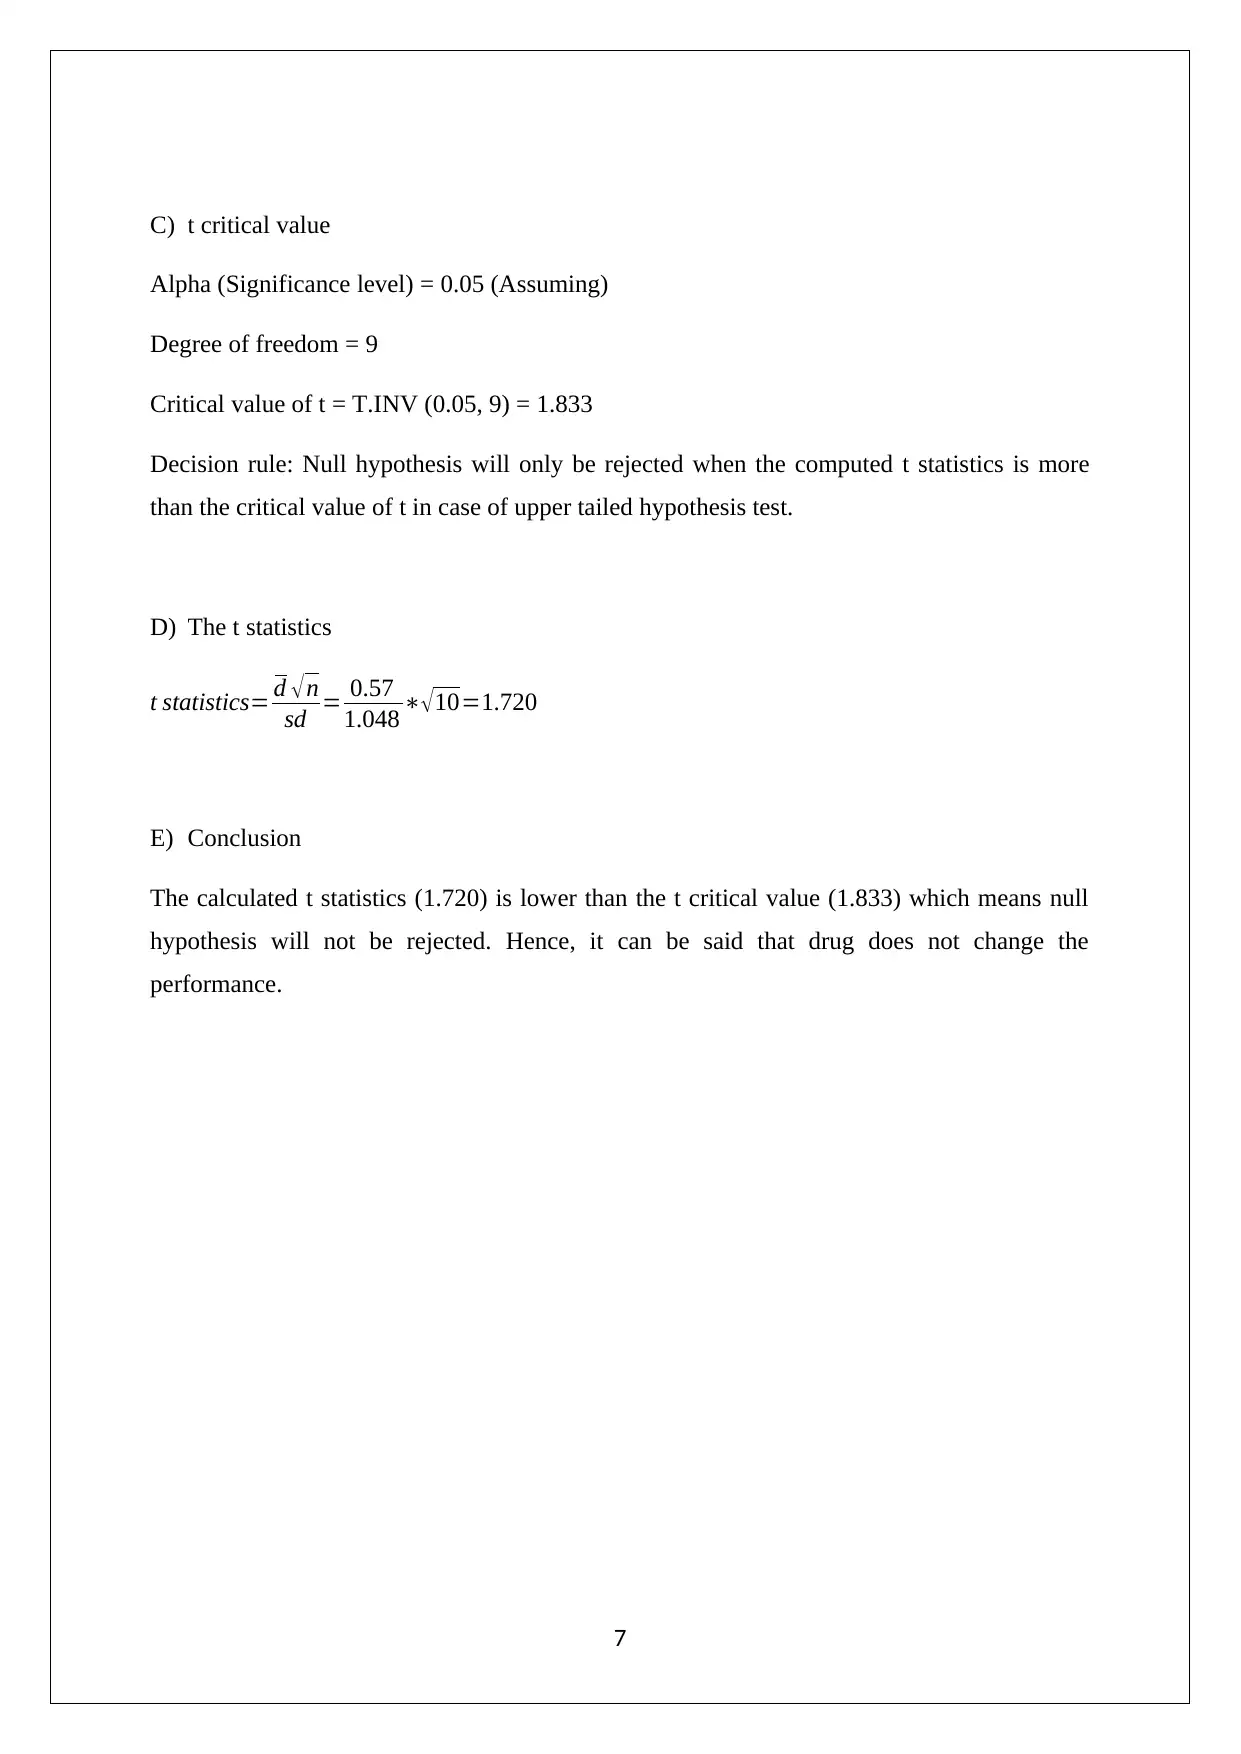
This document presents solutions to a statistics homework assignment focusing on hypothesis testing. The assignment includes four problems. The first problem involves a one-sample Z-test for proportions, examining whether more than 50% of students received grades better than B-. The second problem utilizes a Z-test to determine if the average number of coffee cups consumed by students aligns with a specific claim. The third problem uses a t-test to compare the performance of students who stayed awake all night versus those who slept. The fourth problem employs a t-test to assess the impact of a drug on performance. Each solution includes the null and alternative hypotheses, critical values, decision rules, calculations of test statistics, p-values, and conclusions based on the significance levels provided. The solutions demonstrate the application of statistical methods to analyze sample data and draw inferences about population parameters.
tabler-icon-diamond-filled.svg

Contribute Materials

Your contribution can guide someone’s learning journey. Share your documents today.
Document Page
STATISTICS
[DATE]
[Company name]
[Company address]
tabler-icon-diamond-filled.svg

Secure Best Marks with AI Grader

Need help grading? Try our AI Grader for instant feedback on your assignments.
Document Page
Question 1
Sample size = 200
Number of students received grades more than ‘B’= 112
Significance level = 10%
Claim: More than 50% students received grades better than “B”
A) Null and alternative hypothesis
H0 :π =0. 50
Ha :π >0.50
B) Z critical value
Alpha (Significance level) = 0.10
It is a right tailed hypothesis test based on the alternative hypothesis.
1
Document Page
Decision rule: Null hypothesis will only be rejected when the computed z statistics is more
than z critical.
C) The sample proportion and z statistics
p= 112
200 =0.56
z statistics= pπ
( π 1π
n ) = 0.560.5
( 0.510.5
200 ) =1.6971
D) The p value
E) Conclusion
P value does not come out to be higher than the provided significance level and hence, null
hypothesis would be rejected. Also, the z statistics is more than the z critical which is
evidence of rejection of null hypothesis.
2
Document Page
The final conclusion can be drawn that “More than 50% students received grades better than
“B.”
Question 2
Sample size = 25
Mean number of cups used for coffee drinking purpose by student = 4.4
Standard deviation = 0.5
Significance level = 1%
Claim: On an average a student drinks 4 cups of coffee per day.
A) Null and alternative hypothesis
H0 : μ=4
Ha : μ 4
B) Z critical value
Alpha (Significance level) = 0.01
It is a two tailed hypothesis test based on the alternative hypothesis.
3
tabler-icon-diamond-filled.svg

Secure Best Marks with AI Grader

Need help grading? Try our AI Grader for instant feedback on your assignments.
Document Page
Decision rule: Null hypothesis will only be rejected when the computed z statistics is higher
than the upper critical value or lower than the lower critical value.
C) The sample proportion and z statistics
z statistics= xμ
σ
( n )
= 4.44
0.5
( 25 )
=4
D) The p value
E) Conclusion
P value is lesser than significance level and thus, null hypothesis would be rejected. Also, the
z statistics is more than the upper z critical value which is evidence of rejection of null
hypothesis. It can be said that on an average a student drinks 4 cups of coffee per day.
Question 3
Sample 1
Who Awake
4
Document Page
Sample size = 14
Mean grade = 68%
Standard deviation = 8%
Sample 2
Who Slept
Sample size = 12
Mean grade = 75%
Standard deviation = 7%
Significance level = 5%
Claim: Students who are stayed awake all night perform worse on an average.
A) Null and alternative hypothesis
H0 : μ A=μ S
Ha : μA< μS
B) Degree of freedom
Degree of freedom = n1+n2-2 = 14 + 12 – 2 = 24
C) t critical value
Alpha (Significance level) = 0.05
Degree of freedom = 24
Critical value of t = T.INV (0.05,24) = -1.711
Decision rule: Null hypothesis will only be rejected when the computed t statistics is lower
than the critical value of t in case of lower tailed hypothesis test.
5
Document Page
D) The t statistics
Pooled variance
s2 p= ( n1 ) s 12+ ( n21 ) s2
n 1+n 22 = ( 141 ) 82+ ( 121 ) 72
24 =57.1250
t statistics= x 1x 2
s2 p ( 1
n1 + 1
n2 )= 6875
57.1250 ( 1
14 + 1
12 )=2.354 3
E) Conclusion
The calculated t statistics is lower than the t critical value which means null hypothesis will
be rejected. It can be said that on an average student who stay awake all night perform worse.
Question 4
Sample size = 10
Mean improvement = 0.57
Standard deviation of improvement =1.048
Significance level = 5%
Claim:
A) Null and alternative hypothesis
H0 : μD =0
Ha : μD >0
B) Degree of freedom
Degree of freedom = n-1 = 10-1 = 9
6
tabler-icon-diamond-filled.svg

Paraphrase This Document

Need a fresh take? Get an instant paraphrase of this document with our AI Paraphraser
Document Page
C) t critical value
Alpha (Significance level) = 0.05 (Assuming)
Degree of freedom = 9
Critical value of t = T.INV (0.05, 9) = 1.833
Decision rule: Null hypothesis will only be rejected when the computed t statistics is more
than the critical value of t in case of upper tailed hypothesis test.
D) The t statistics
t statistics= d n
sd = 0.57
1.048 10=1.720
E) Conclusion
The calculated t statistics (1.720) is lower than the t critical value (1.833) which means null
hypothesis will not be rejected. Hence, it can be said that drug does not change the
performance.
7
chevron_up_icon
1 out of 8
circle_padding
hide_on_mobile
zoom_out_icon
logo.png

Your All-in-One AI-Powered Toolkit for Academic Success.

Available 24*7 on WhatsApp / Email

[object Object]