Statistical Investigation Report: Analysis of Unemployment Trends

Verified

Added on  2022/12/27

|8
|1359
|53
Report
AI Summary
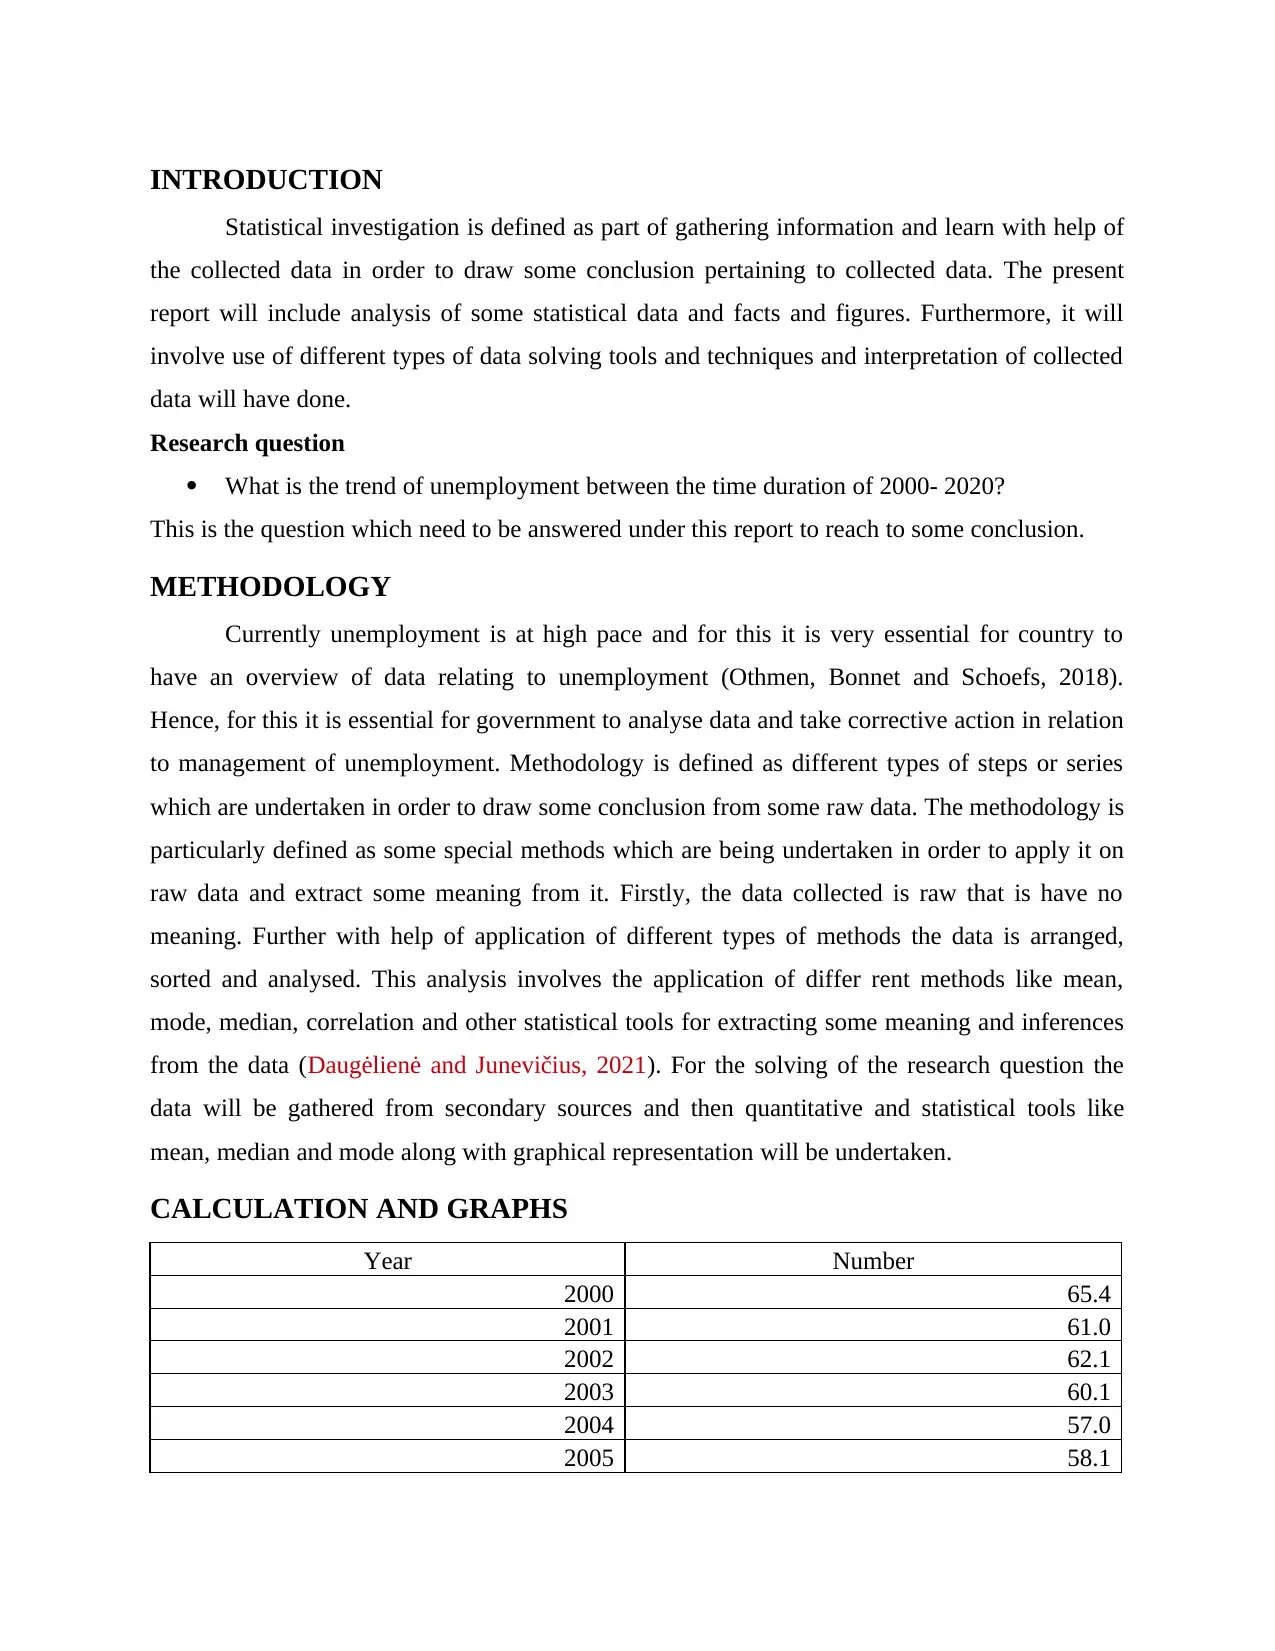
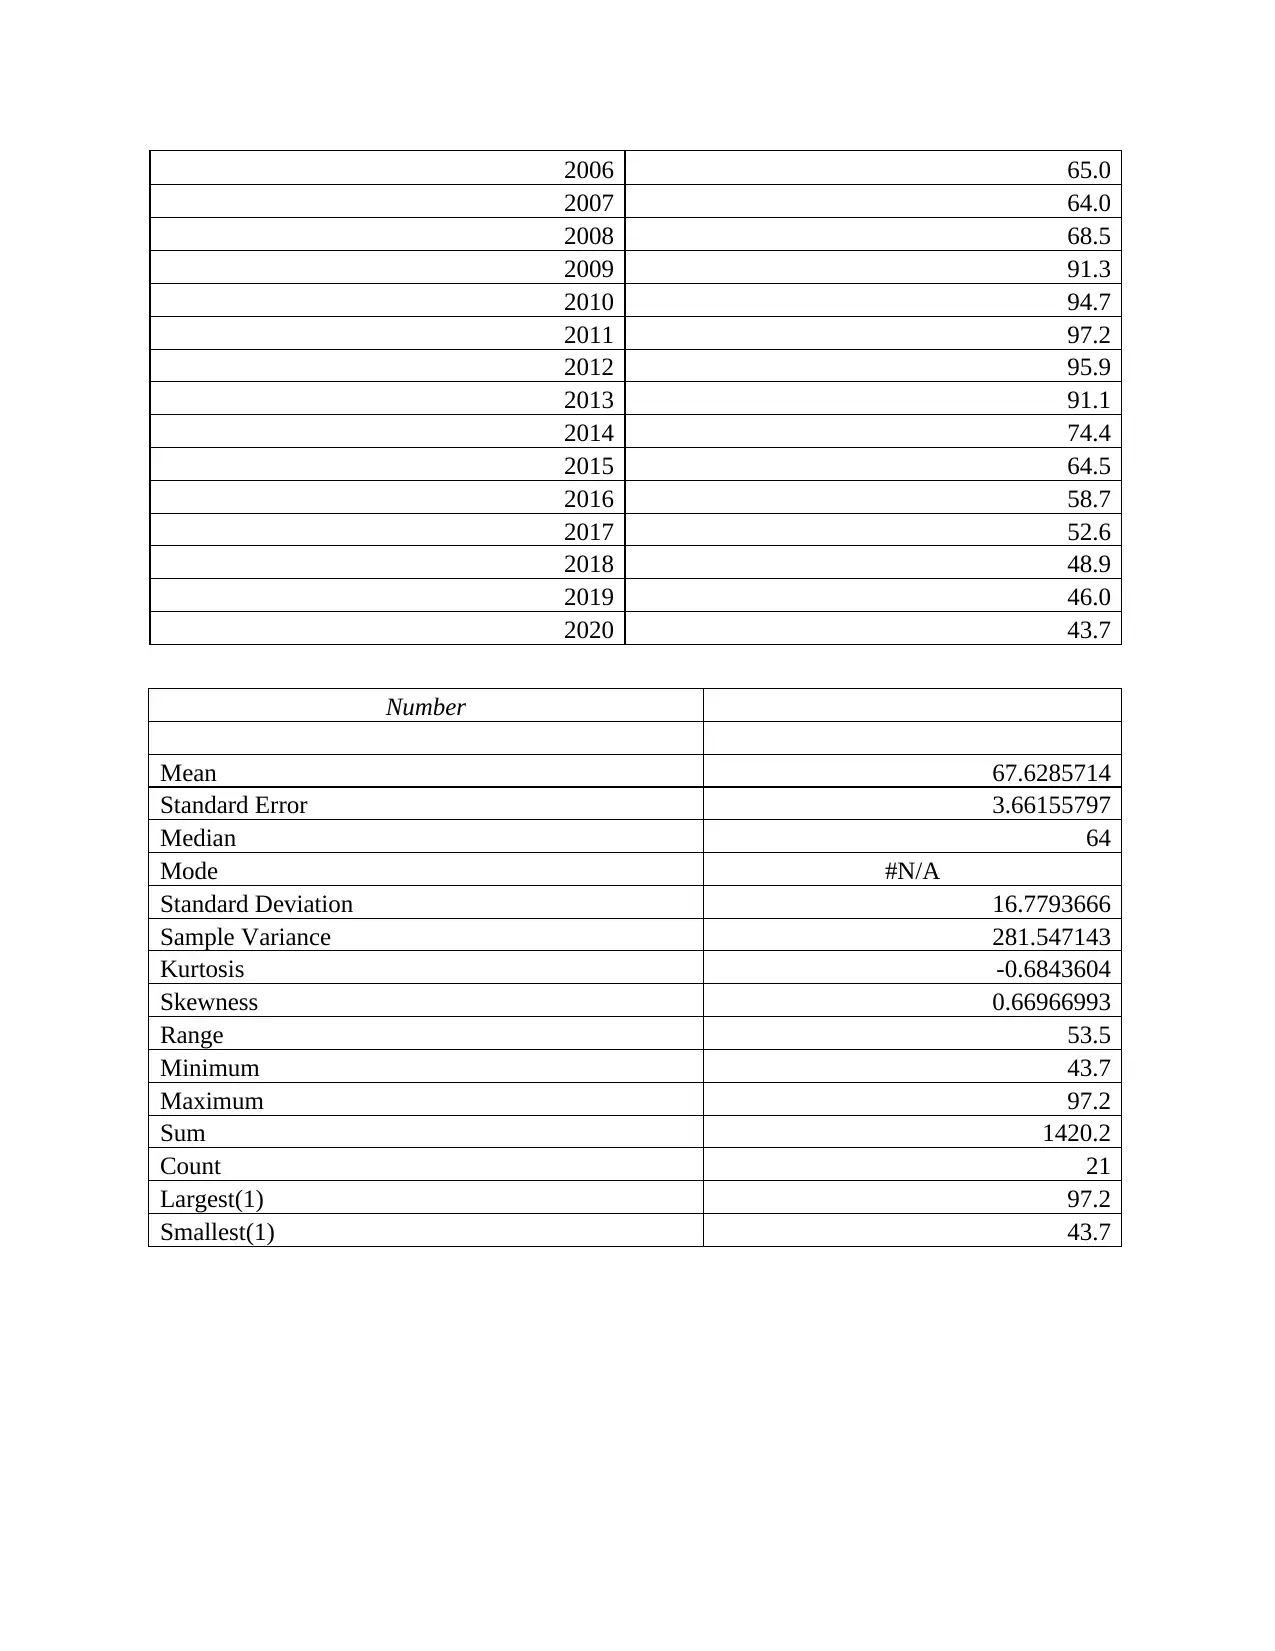
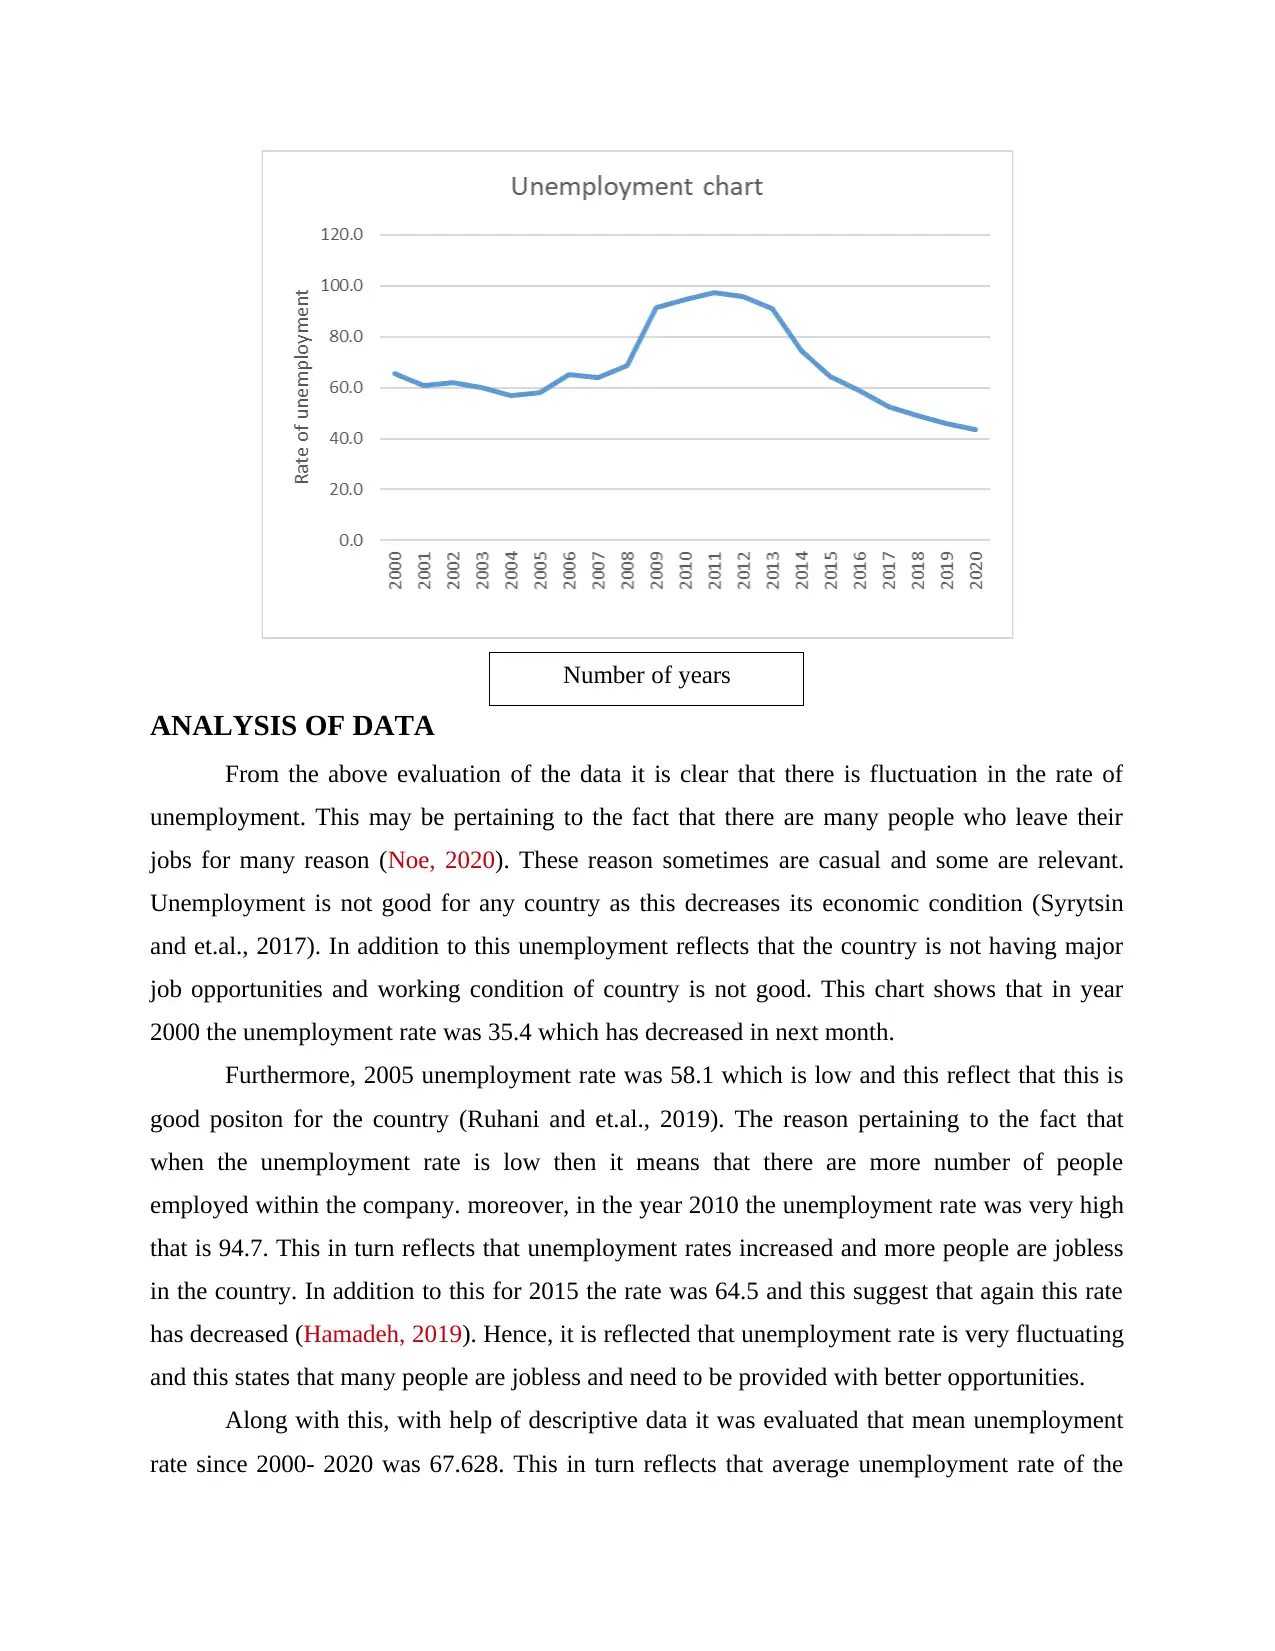
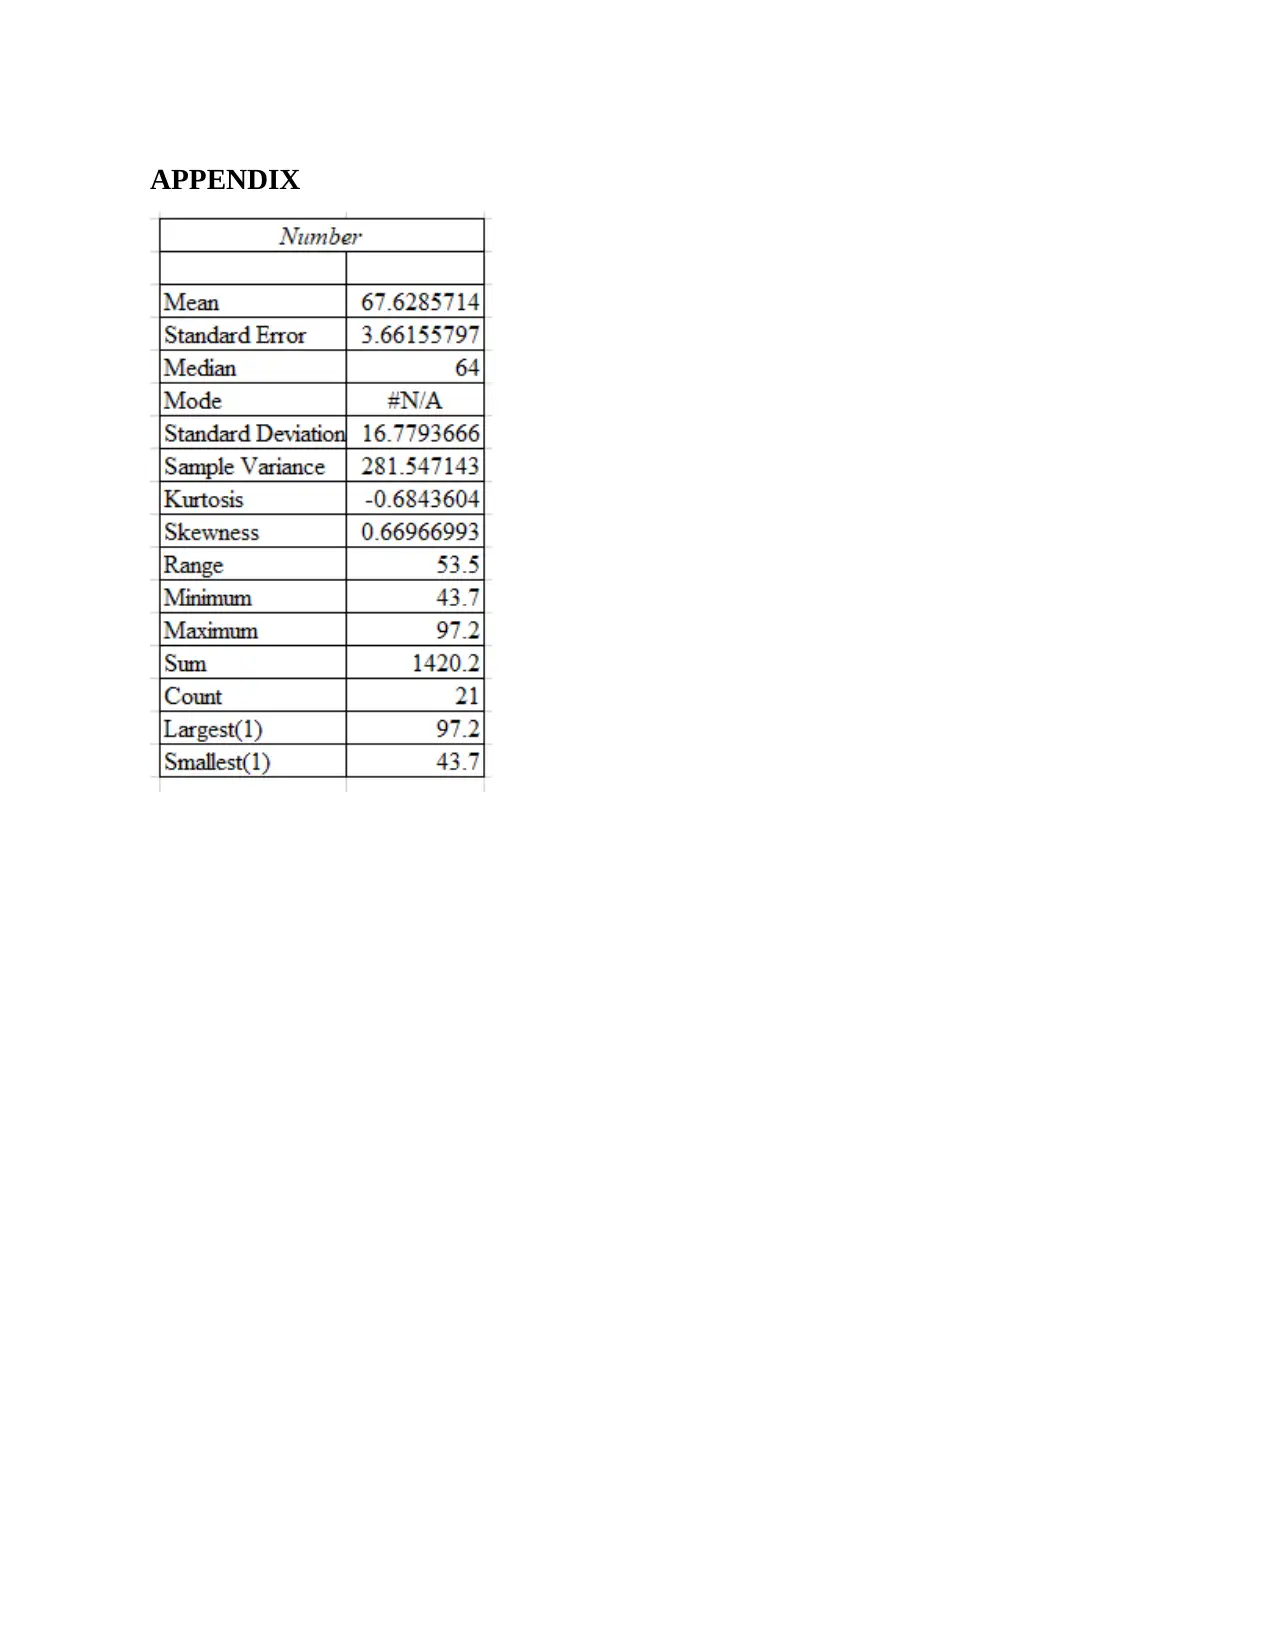
This report presents a statistical investigation into unemployment trends between 2000 and 2020. The methodology involves gathering secondary data and applying quantitative and statistical tools such as mean, median, mode, and graphical representations to analyze the data. The report addresses the research question: 'What is the trend of unemployment between the time duration of 2000-2020?' The data reveals fluctuations in unemployment rates, with the mean unemployment rate being 67.628, the median at 64, and no mode. The standard deviation is 16.779, indicating the variability of data from the mean. The analysis includes a table of values, calculations, and a graph. The report concludes that statistical investigation is essential for drawing meaningful inferences from data, particularly in analyzing unemployment, a major economic issue. The report is based on secondary data and provides a descriptive analysis of the collected information.
Document Page
STATISTICAL
INVESTIGATION
tabler-icon-diamond-filled.svg

Paraphrase This Document

Need a fresh take? Get an instant paraphrase of this document with our AI Paraphraser
Document Page
TABLE OF CONTENTS
INTRODUCTION...........................................................................................................................3
METHODOLOGY..........................................................................................................................3
CALCULATION AND GRAPHS...................................................................................................3
ANALYSIS OF DATA...................................................................................................................5
CONCLUSION................................................................................................................................6
REFERENCES................................................................................................................................7
APPENDIX......................................................................................................................................8
Document Page
INTRODUCTION
Statistical investigation is defined as part of gathering information and learn with help of
the collected data in order to draw some conclusion pertaining to collected data. The present
report will include analysis of some statistical data and facts and figures. Furthermore, it will
involve use of different types of data solving tools and techniques and interpretation of collected
data will have done.
Research question
What is the trend of unemployment between the time duration of 2000- 2020?
This is the question which need to be answered under this report to reach to some conclusion.
METHODOLOGY
Currently unemployment is at high pace and for this it is very essential for country to
have an overview of data relating to unemployment (Othmen, Bonnet and Schoefs, 2018).
Hence, for this it is essential for government to analyse data and take corrective action in relation
to management of unemployment. Methodology is defined as different types of steps or series
which are undertaken in order to draw some conclusion from some raw data. The methodology is
particularly defined as some special methods which are being undertaken in order to apply it on
raw data and extract some meaning from it. Firstly, the data collected is raw that is have no
meaning. Further with help of application of different types of methods the data is arranged,
sorted and analysed. This analysis involves the application of differ rent methods like mean,
mode, median, correlation and other statistical tools for extracting some meaning and inferences
from the data (Daugėlienė and Junevičius, 2021). For the solving of the research question the
data will be gathered from secondary sources and then quantitative and statistical tools like
mean, median and mode along with graphical representation will be undertaken.
CALCULATION AND GRAPHS
Year Number
2000 65.4
2001 61.0
2002 62.1
2003 60.1
2004 57.0
2005 58.1
Document Page
2006 65.0
2007 64.0
2008 68.5
2009 91.3
2010 94.7
2011 97.2
2012 95.9
2013 91.1
2014 74.4
2015 64.5
2016 58.7
2017 52.6
2018 48.9
2019 46.0
2020 43.7
Number
Mean 67.6285714
Standard Error 3.66155797
Median 64
Mode #N/A
Standard Deviation 16.7793666
Sample Variance 281.547143
Kurtosis -0.6843604
Skewness 0.66966993
Range 53.5
Minimum 43.7
Maximum 97.2
Sum 1420.2
Count 21
Largest(1) 97.2
Smallest(1) 43.7
tabler-icon-diamond-filled.svg

Paraphrase This Document

Need a fresh take? Get an instant paraphrase of this document with our AI Paraphraser
Document Page
ANALYSIS OF DATA
From the above evaluation of the data it is clear that there is fluctuation in the rate of
unemployment. This may be pertaining to the fact that there are many people who leave their
jobs for many reason (Noe, 2020). These reason sometimes are casual and some are relevant.
Unemployment is not good for any country as this decreases its economic condition (Syrytsin
and et.al., 2017). In addition to this unemployment reflects that the country is not having major
job opportunities and working condition of country is not good. This chart shows that in year
2000 the unemployment rate was 35.4 which has decreased in next month.
Furthermore, 2005 unemployment rate was 58.1 which is low and this reflect that this is
good positon for the country (Ruhani and et.al., 2019). The reason pertaining to the fact that
when the unemployment rate is low then it means that there are more number of people
employed within the company. moreover, in the year 2010 the unemployment rate was very high
that is 94.7. This in turn reflects that unemployment rates increased and more people are jobless
in the country. In addition to this for 2015 the rate was 64.5 and this suggest that again this rate
has decreased (Hamadeh, 2019). Hence, it is reflected that unemployment rate is very fluctuating
and this states that many people are jobless and need to be provided with better opportunities.
Along with this, with help of descriptive data it was evaluated that mean unemployment
rate since 2000- 2020 was 67.628. This in turn reflects that average unemployment rate of the
Number of years
Document Page
country is 67.628 and it states that on an average 67.628 people are unemployed every year. In
addition to this median of the data is 64 and this in turn reflects that median unemployment rate
is 64 for all the years. On the other side there was no mode as there are not any repeated rates of
unemployment in any of the year (Greaves-Tunnell and Harchaoui, 2019).
In addition to with help of standard deviation it is clear that difference of values from the
mean is 16.779. this states that average variability of the data set from mean value of 67.628 is
16.779. furthermore, the minimum value of the data range was 43.7 and the maximum value was
97.2 (Kallab, 2020). in addition to this range of the value of data is 53.5 and this is the difference
of minimum and the maximum value. Along with this by assistance of descriptive statistic it was
evaluated that sum of total values since 2000 to 2020 the total rate on unemployment was
1420.2.
CONCLUSION
In the end from the above report it is summarised that in analysing data use of statistical
investigation is very essential. The reason pertaining to the fact is that when there is only some
data then it has no meaning or relevance. But when some inferences are drawn from it by
applying statistical tools then this assist in analysing the present data. From the above report it
was seen that unemployment is the major issue and with help of descriptive statistic the data
relating to unemployment was analysed. Further it was seen that mean unemployment rate was
67.63 for all the years.
Document Page
REFERENCES
Books and Journals
Daugėlienė, R. and Junevičius, A., 2021. Problematic Issues of Youth Unemployment in Central
and Eastern European Countries. In Eurasian Economic Perspectives (pp. 401-417).
Springer, Cham.
Greaves-Tunnell, A. and Harchaoui, Z., 2019, May. A statistical investigation of long memory in
language and music. In International Conference on Machine Learning (pp. 2394-2403).
PMLR.
Hamadeh, S., 2019. A critical analysis of the Syrian refugee education policies in Lebanon using
a policy analysis framework. Journal of Education Policy. 34(3). pp.374-393.
Kallab, A., 2020. Social recovery in post-conflict countries: A comparative study between Sierra
Leone and Lebanon.
Lin, N., and et.al., 2017. A statistical investigation of the dependence of tropical cyclone
intensity change on the surrounding environment. Monthly Weather Review, 145(7),
pp.2813-2831.
Noe, N., 2020. Breaking the cycle: a new American approach to Lebanon.
Othmen, I., Bonnet, S. and Schoefs, F., 2018. Statistical investigation of different analysis
methods for chloride profiles within a real structure in a marine environment. Ocean
Engineering, 157, pp.96-107.
Ruhani, B., and et.al., 2019. Statistical investigation for developing a new model for rheological
behavior of ZnO–Ag (50%–50%)/Water hybrid Newtonian nanofluid using experimental
data. Physica A: Statistical Mechanics and its Applications, 525, pp.741-751.
Syrytsin, I., and et.al., 2017. Statistical investigation of the user effects on mobile terminal
antennas for 5G applications. IEEE Transactions on antennas and Propagation, 65(12),
pp.6596-6605.
Online
Descriptive and inferential statistics. 2018. [Online]. Available through:
<https://statistics.laerd.com/statistical-guides/descriptive-inferential-statistics.php>
tabler-icon-diamond-filled.svg

Paraphrase This Document

Need a fresh take? Get an instant paraphrase of this document with our AI Paraphraser
Document Page
APPENDIX
chevron_up_icon
1 out of 8
circle_padding
hide_on_mobile
zoom_out_icon
[object Object]