Statistics Homework: LMS Usage, Acceptance, and SPSS Analysis
VerifiedAdded on  2023/01/20
|28
|3122
|99
Homework Assignment
AI Summary
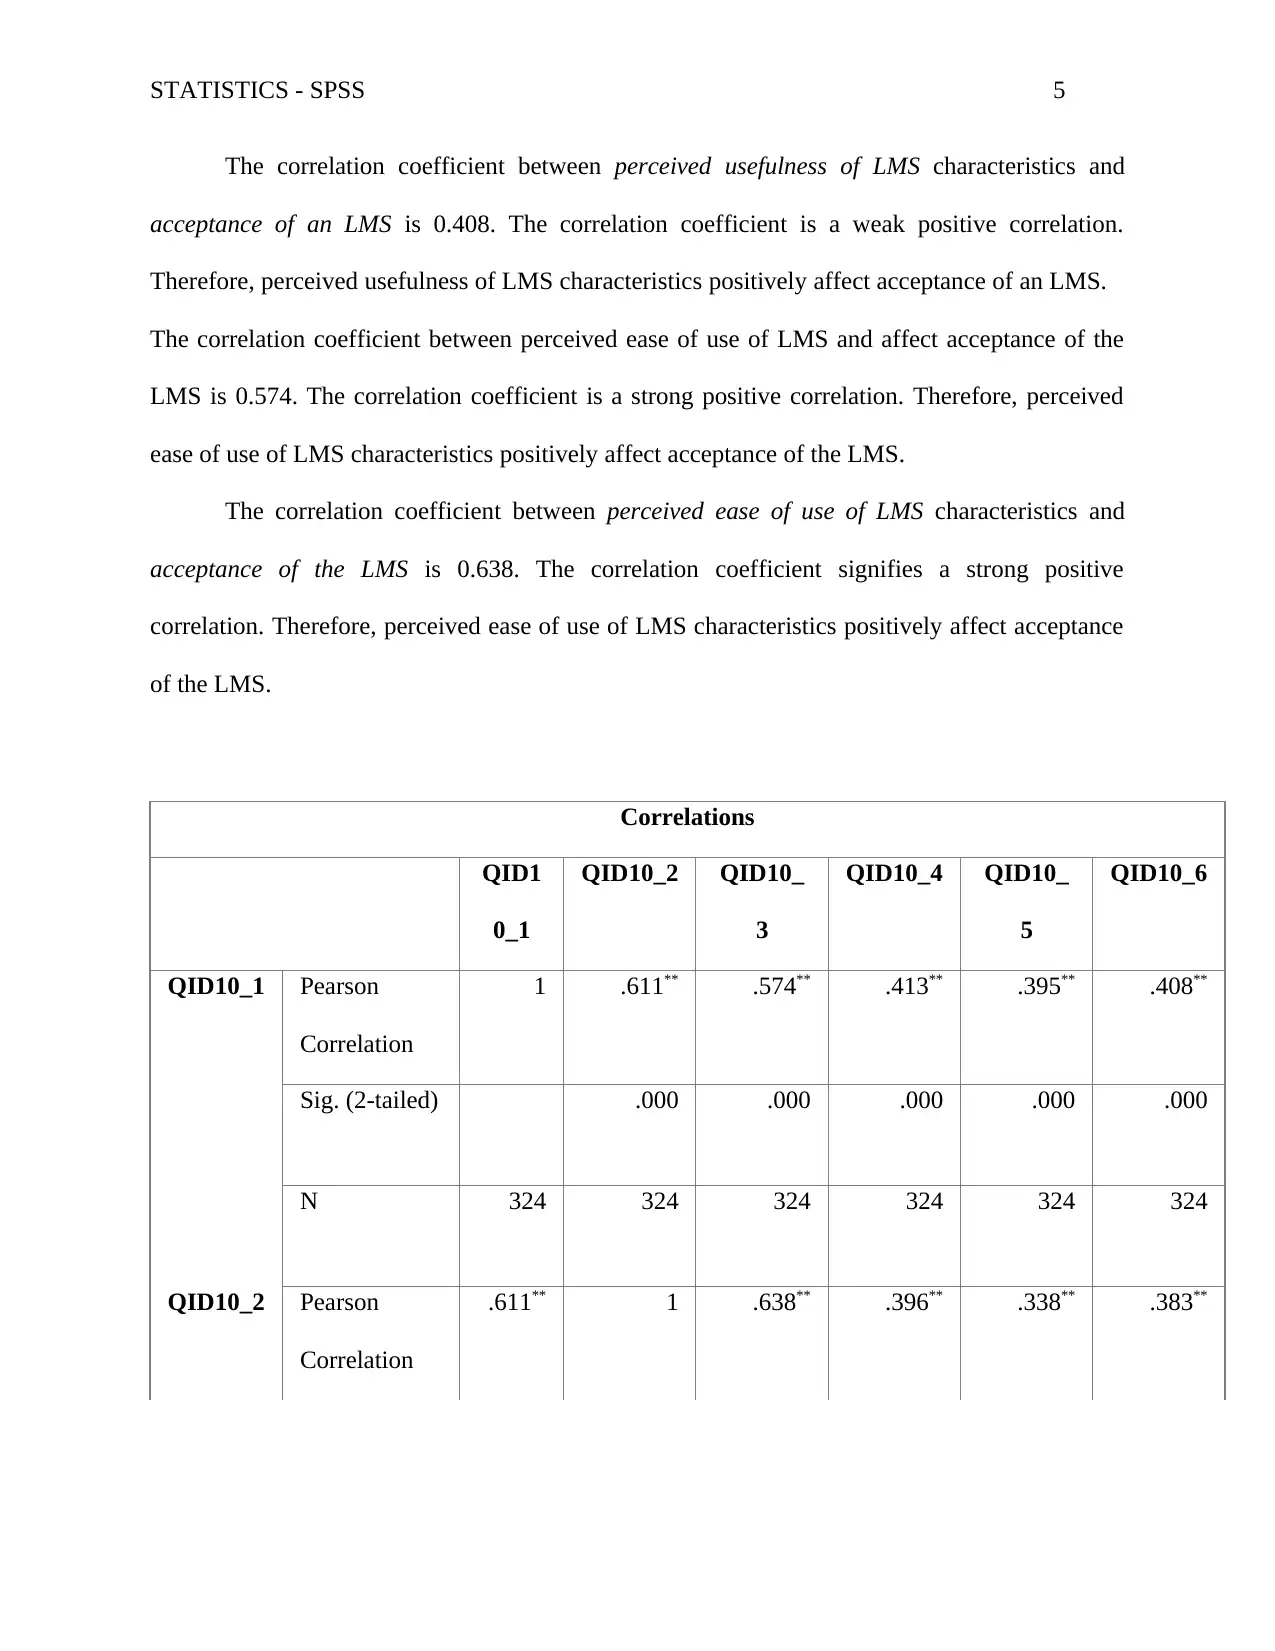
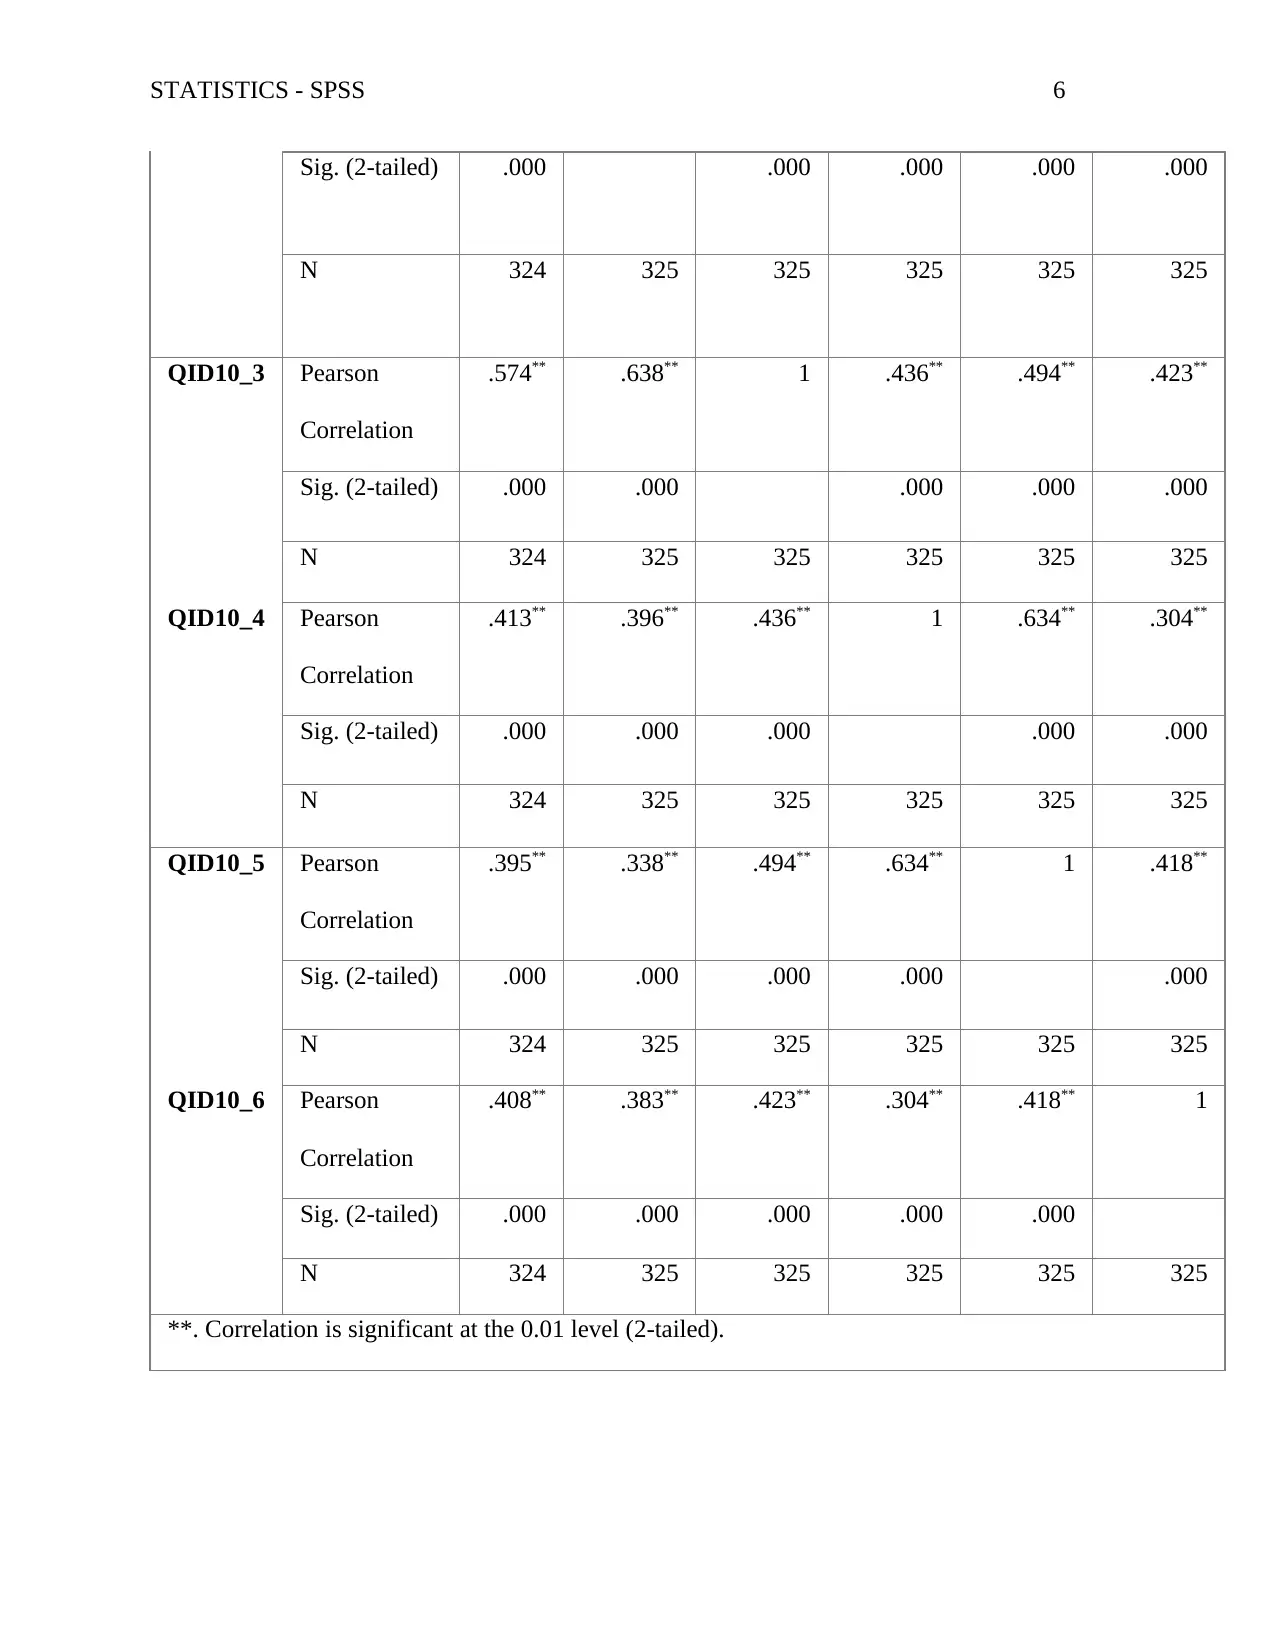
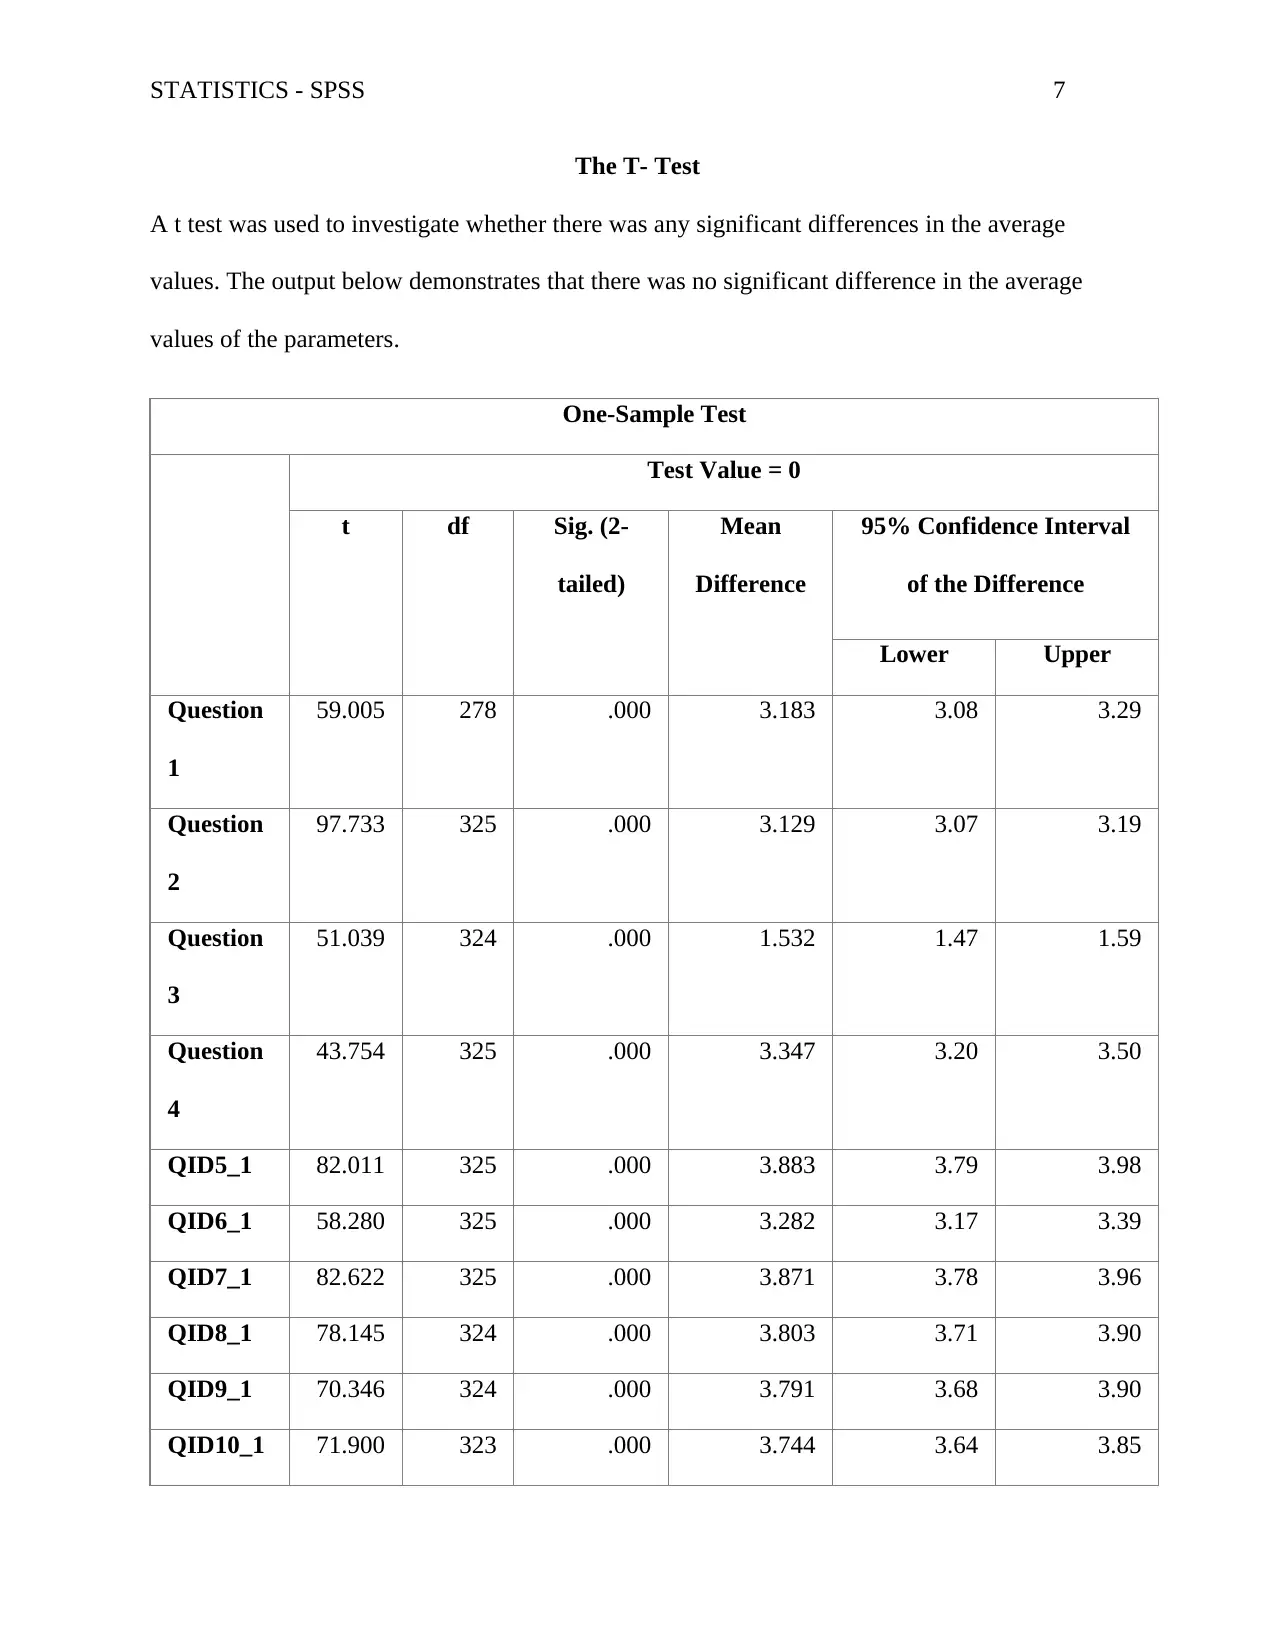
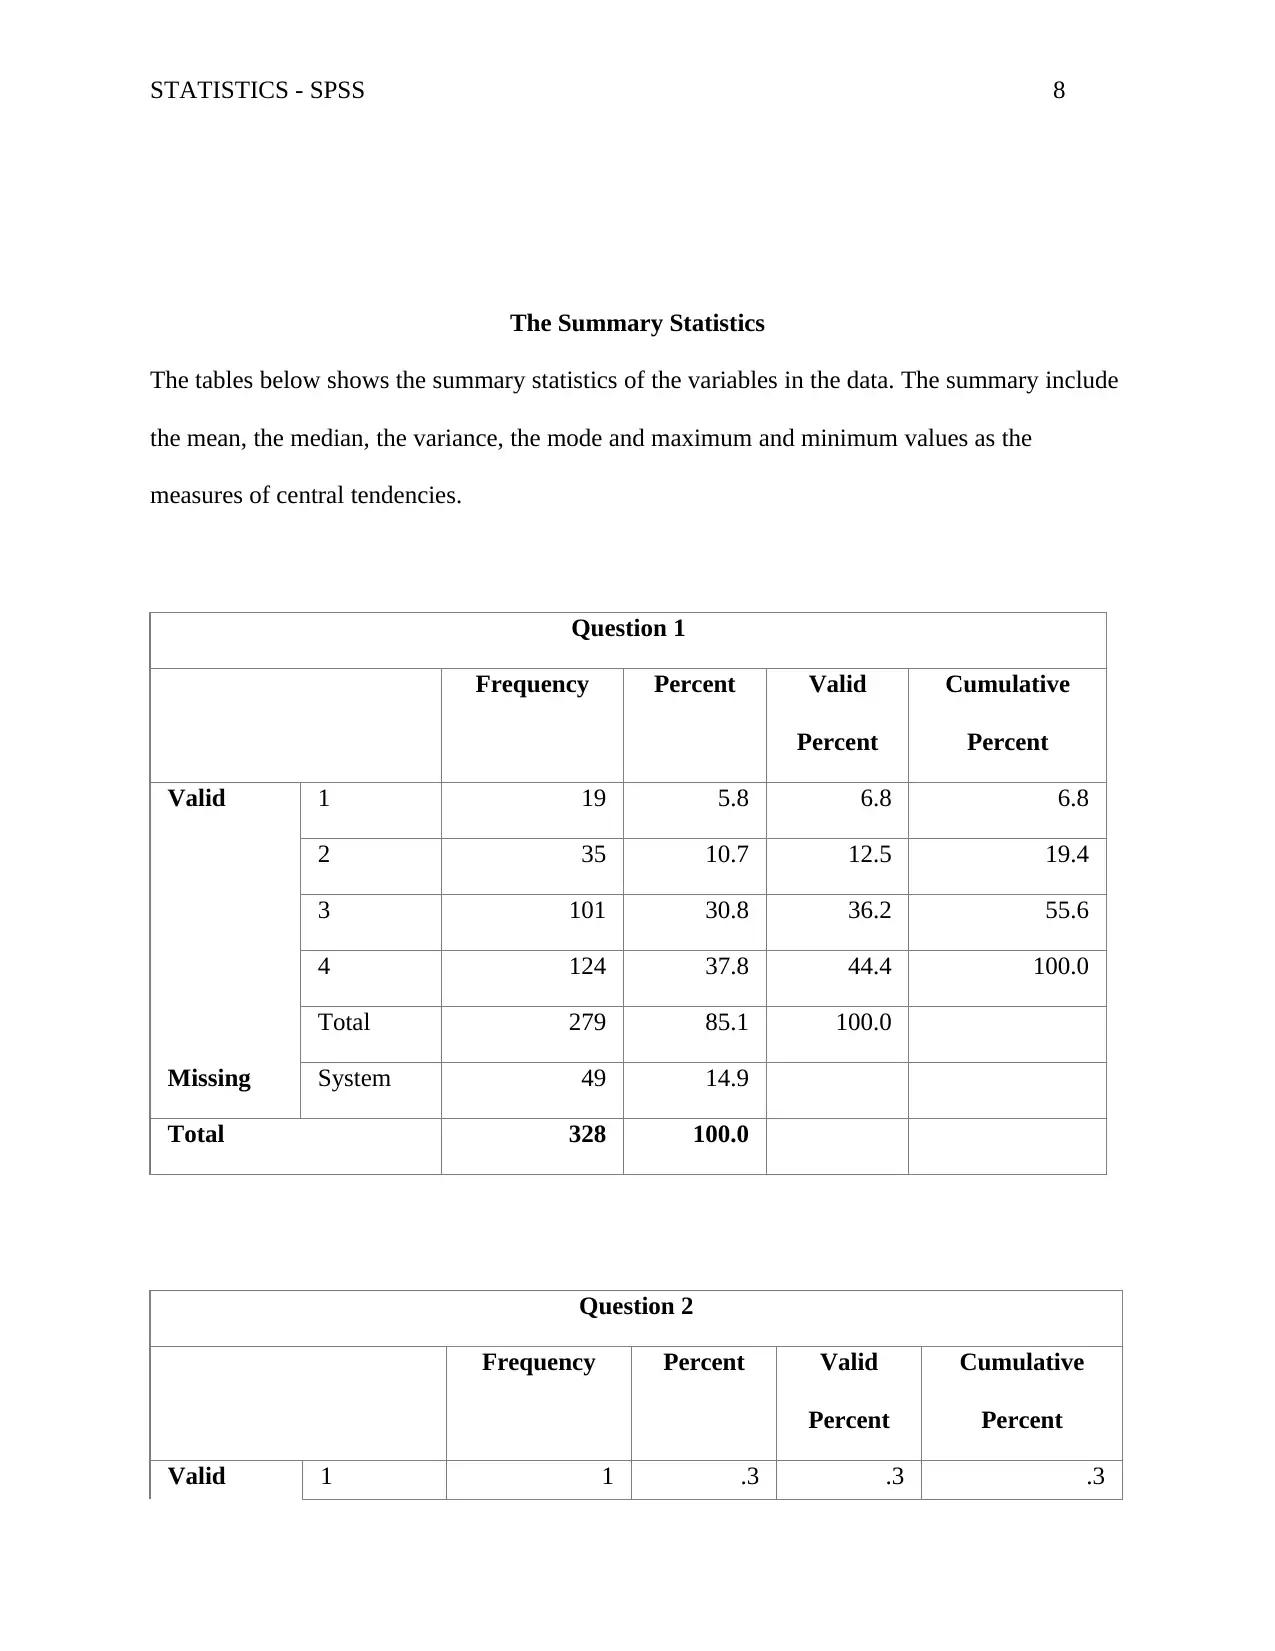
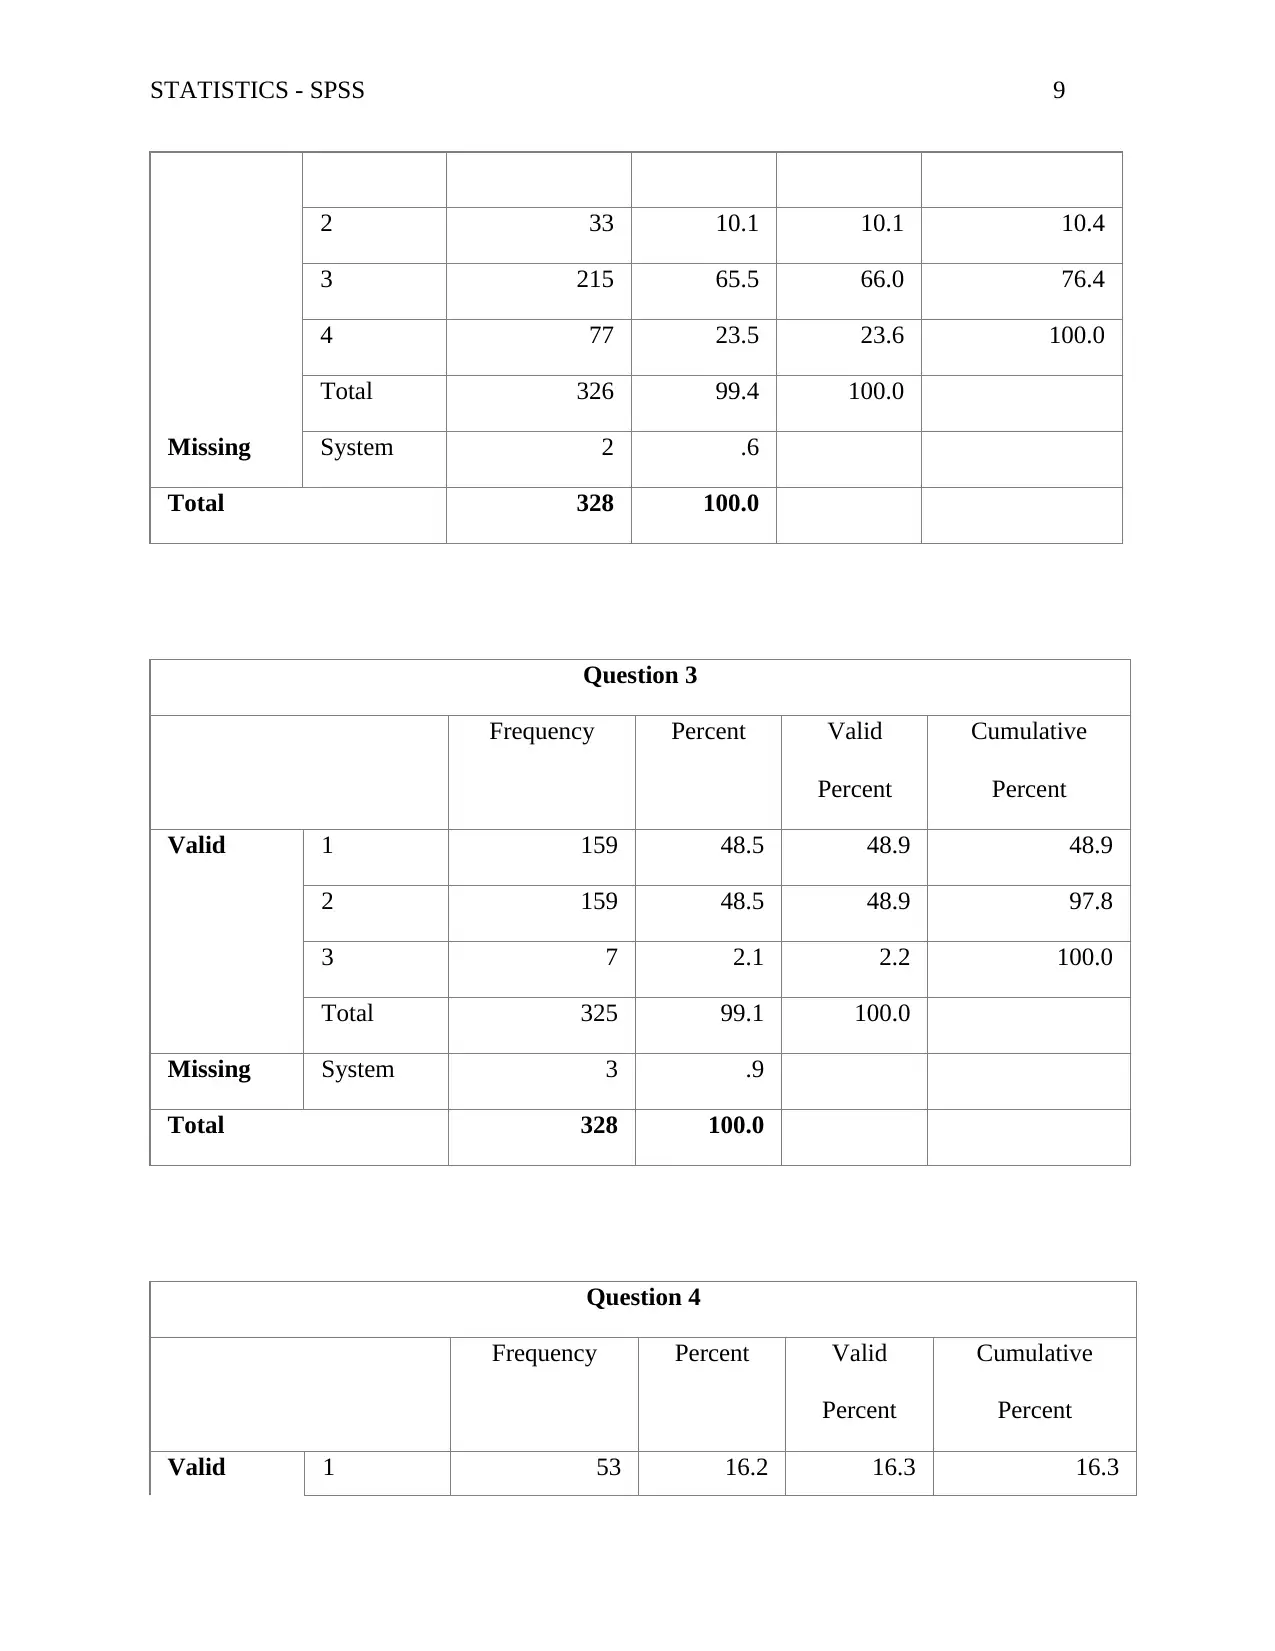
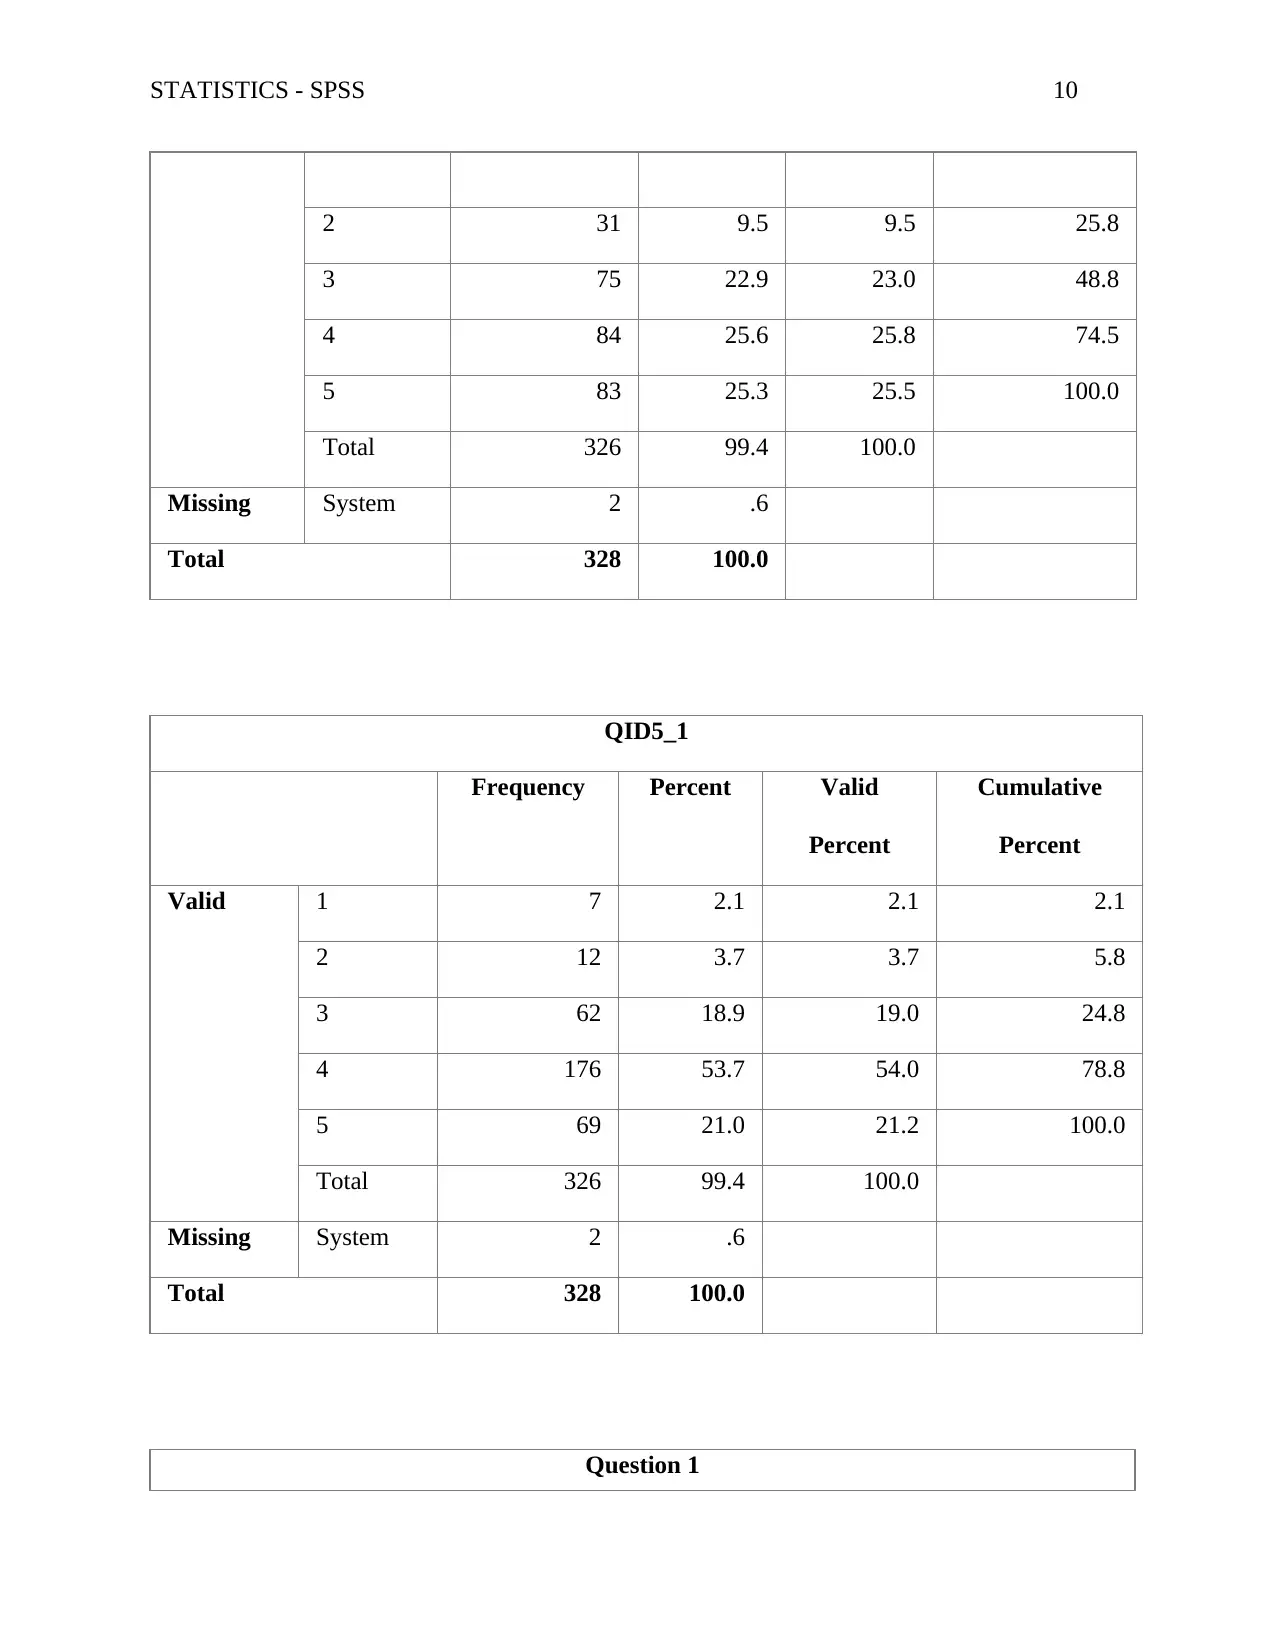
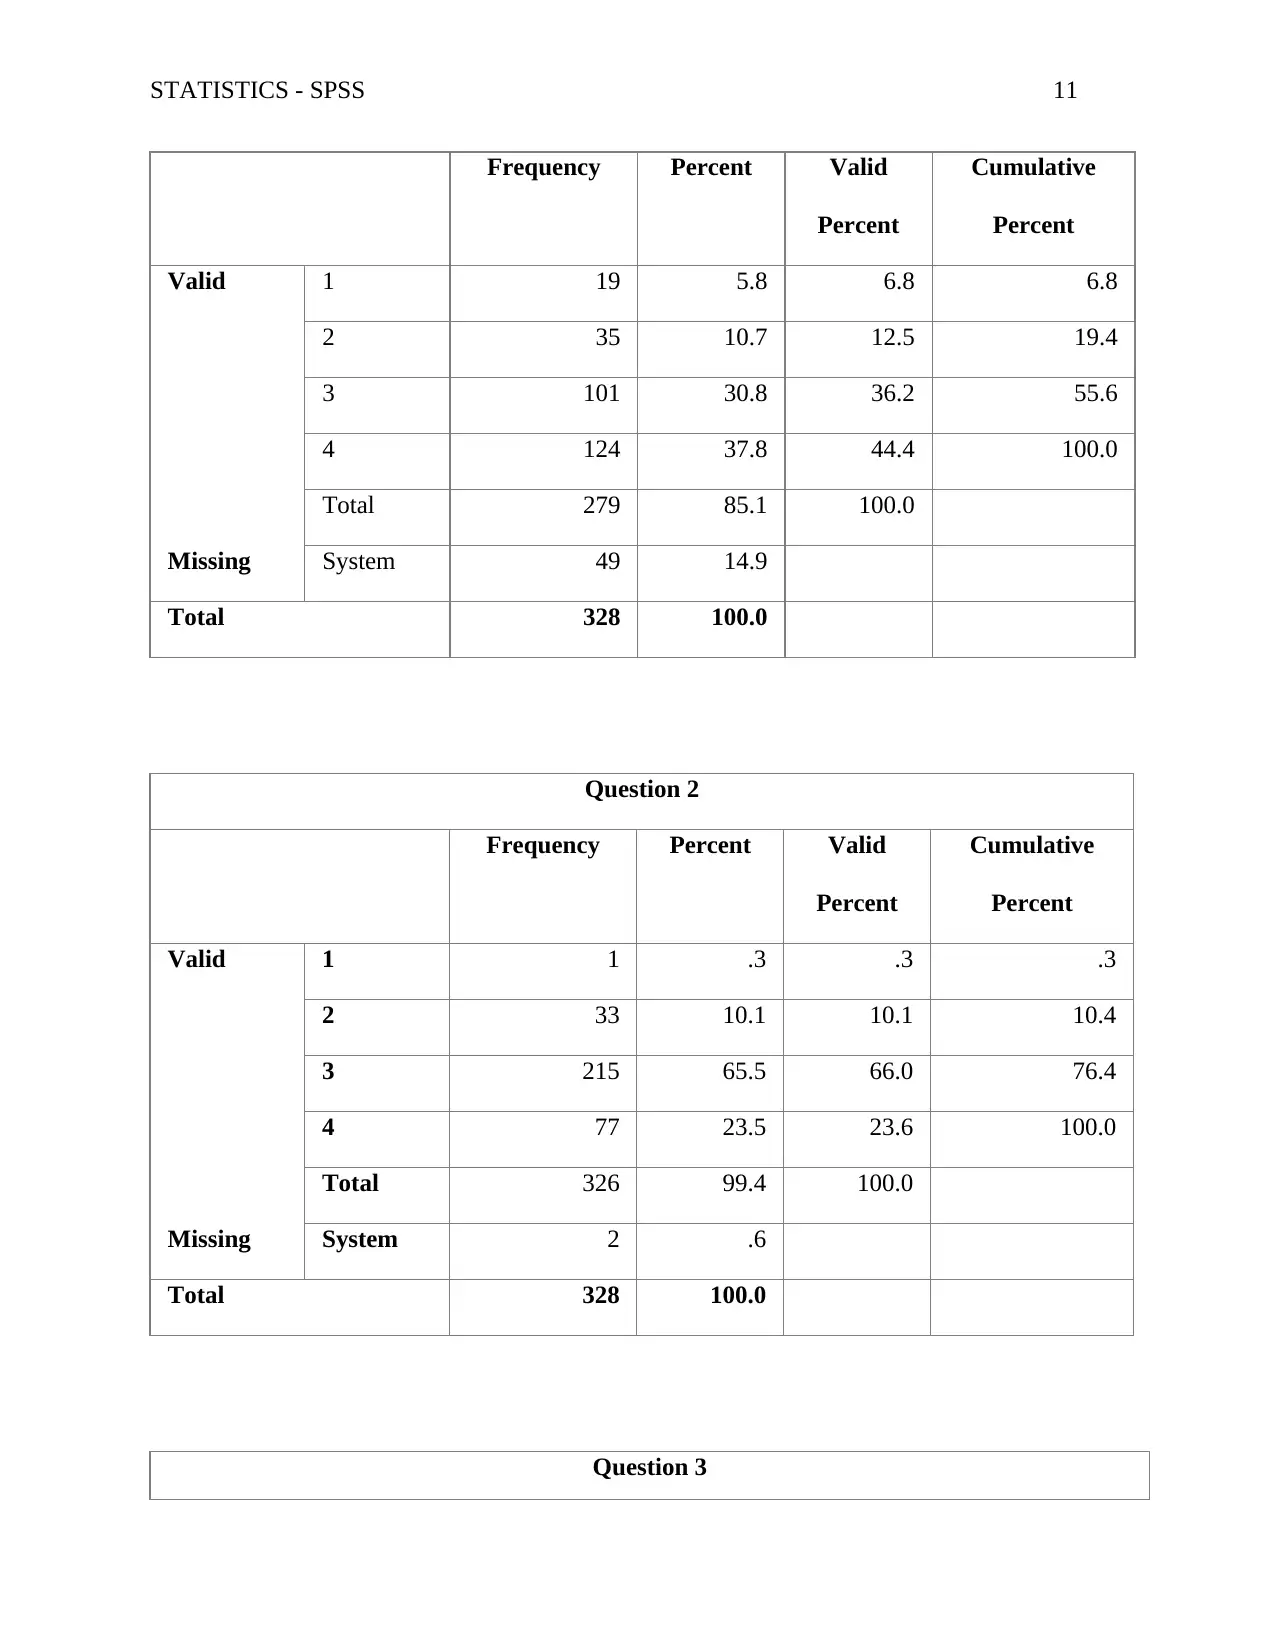
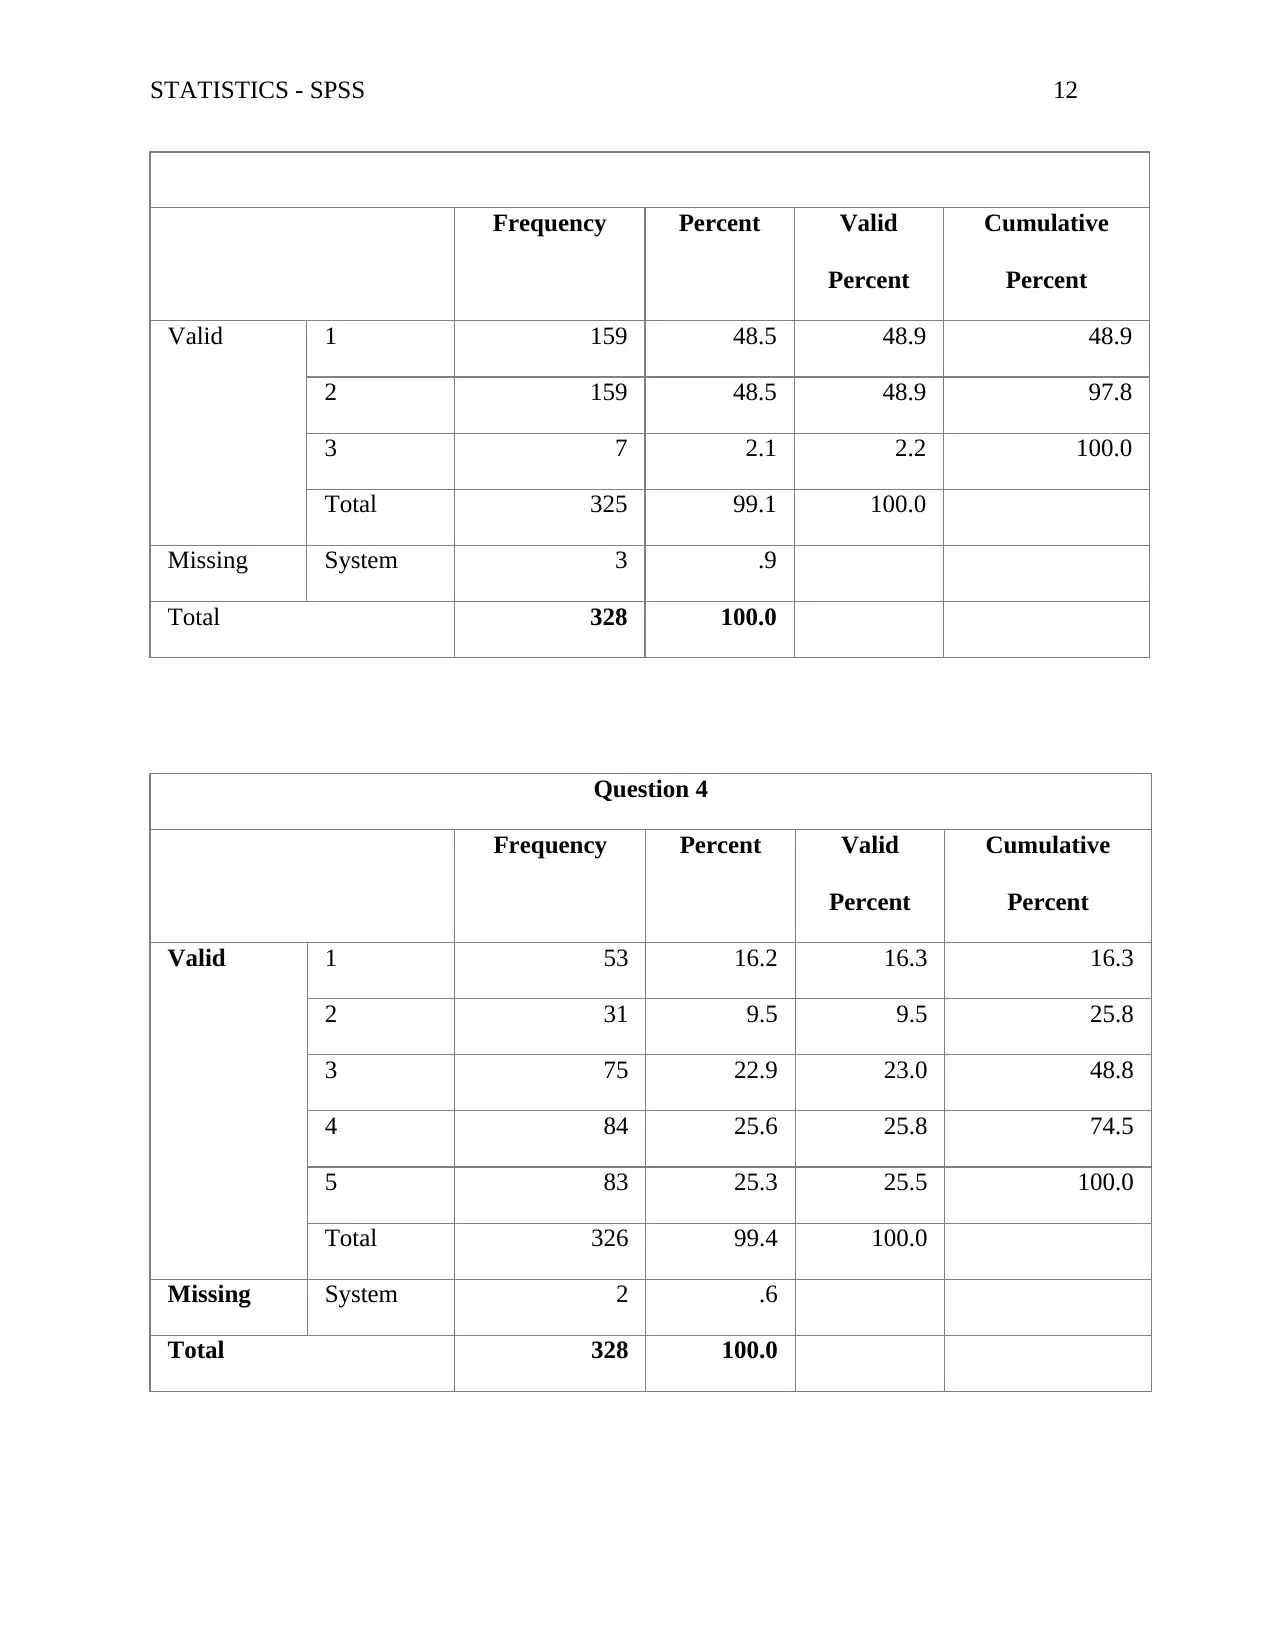
This assignment presents a comprehensive statistical analysis of Learning Management System (LMS) usage and acceptance within Jordanian universities. The research investigates various factors influencing LMS adoption, including IT infrastructure characteristics, cultural characteristics, perceived usefulness, and perceived ease of use. The study employs correlation analysis to examine the relationships between these variables, revealing both strong and weak positive correlations. Furthermore, the assignment includes hypothesis testing to validate claims about the subject matter, along with t-tests to identify any significant differences in average values. The results, presented through tables and descriptive statistics, provide valuable insights into the factors driving LMS acceptance and continued use. The document also includes frequency distributions and summary statistics to provide a detailed overview of the data.

Running head: STATISTICS - SPSS 1
Statistics – SPSS
(Name of Student)
(Institutional Affiliation)
(Date of Submission)
(Course Code)
Statistics – SPSS
(Name of Student)
(Institutional Affiliation)
(Date of Submission)
(Course Code)
Paraphrase This Document
Need a fresh take? Get an instant paraphrase of this document with our AI Paraphraser

STATISTICS - SPSS 2
Data Analysis and Results
The purposes of this research are: To study the level of use and acceptance of LMS at the
universities in Jordan, investigate the existing literatures that can support the enhancement of the
usefulness of LMS at the Universities in Jordan as well as assessing its benefits to the users, to
investigate the factors that have influence on the usage of LMS at the universities in Jordan, to
conduct tests and measures of models that describe the usage of LMS and to provide a report on
the insights new findings for an LMS at the Universities in Jordan.
Hypothesis Testing
Hypothesis testing is statistical technique that is used to investigate the truth value of a claim
about a subject matter. Hypothesis testing process involves the statement of both alternative and
null hypotheses have to be stated. A null hypothesis is stated negatively while an alternative
hypothesis is stated positively (Williamson & Kirsty, 2018). Therefore, an alternative hypothesis
represents the researcher’s view point about the subject matter. A null hypothesis is a stated that
is being tested. A null hypothesis is denoted by H0 while an alternative hypothesis is denoted by
H1 (Iskandar, Ismed, Mohd, & Noraini, 2014). The following hypothesis were tested:
1. H0: IT infrastructure characteristics does not positively affect perceived usefulness of an
LMS
Vs
H1: IT infrastructure characteristics positively affect perceived usefulness of an LMS
2. H0: Cultural characteristics does not positively affect perceived ease of use of an LMS
Vs

STATISTICS - SPSS 3
H1: Cultural characteristics positively affect perceived ease of use of an LMS
3. H0: IT infrastructure characteristics does not positively affect perceived ease of use of an
LMS
Vs
H1: IT infrastructure characteristics positively affect perceived ease of use of an LMS
4. H0: Cultural characteristics does not positively affect perceived usefulness of an LMS
Vs
H1: Cultural characteristics positively affect perceived usefulness of an LMS
5. H0: Perceived usefulness of LMS characteristics does not positively affect acceptance of
an LMS
Vs
H1: Perceived usefulness of LMS characteristics positively affect acceptance of an LMS
6. H0: Perceived ease of use of LMS characteristics does not positively affect acceptance of
the LMS
Vs
H1: Perceived ease of use of LMS characteristics positively affect acceptance of the LMS
7. H0: Acceptance of an LMS characteristics does not positively affects continued use of the
JLMS.
Vs
H1: Acceptance of an LMS characteristics positively affects continued use of the JLMS.
The above hypothesis were tested by running correlation analysis. A correlation analysis is a
statistical technique that is used to investigate the relationship between the variables. A
correlation analysis presents the nature and the strength of the relationship through the
⊘ This is a preview!⊘
Do you want full access?
Subscribe today to unlock all pages.

Trusted by 1+ million students worldwide

STATISTICS - SPSS 4
coefficient of correlation. A perfect positive correlation has a value of 1 while a perfect negative
correlation has a value of -1. Variables that are not correlated have a correlation coefficient of 0.
A correlation coefficient that lies between 0 and 0.5 is a weak positive correlation while a
correlation coefficient that lies between 0.5 and 1 is a strong positive correlation. On the other
hand, a correlation coefficient that lies between 0 and -0.5 is a weak negative correlation while a
correlation that lies between -0.5 and -1 is a strong negative correlation.
The tables below represents the output of the correlation analysis. From the table below.
The correlation coefficient between IT infrastructure characteristics and the perceived
usefulness of an LMS is 0.611. The correlation coefficient is a strong positive correlation
coefficient. The correlation is significant at 0.05 level of significance with a significance value of
0.00. Therefore, it is statistically accurate to conclude that indeed IT infrastructure characteristics
positively affect perceived usefulness of an LMS.
The correlation coefficient between Cultural characteristics and the perceived ease of use
of an LMS is 0.574. The correlation coefficient is a strong positive correlation which is
significant at 0.05 level of significance. Therefore, it is statistically accurate to conclude that
indeed cultural characteristics positively affect perceived ease of use of an LMS.
The correlation coefficient between IT infrastructure characteristics and perceived ease
of use of an LMS is 0.413. The correlation coefficient is a weak positive correlation. Therefore, it
is statistically correct to conclude that IT infrastructure characteristics positively affect perceived
ease of use of an LMS.
The correlation coefficient between cultural characteristics and perceived usefulness of
an LMS is 0.395. The correlation coefficient is a weak positive correlation Therefore, we
conclude that Cultural characteristics positively affect perceived usefulness of an LMS.
Paraphrase This Document
Need a fresh take? Get an instant paraphrase of this document with our AI Paraphraser

STATISTICS - SPSS 5
The correlation coefficient between perceived usefulness of LMS characteristics and
acceptance of an LMS is 0.408. The correlation coefficient is a weak positive correlation.
Therefore, perceived usefulness of LMS characteristics positively affect acceptance of an LMS.
The correlation coefficient between perceived ease of use of LMS and affect acceptance of the
LMS is 0.574. The correlation coefficient is a strong positive correlation. Therefore, perceived
ease of use of LMS characteristics positively affect acceptance of the LMS.
The correlation coefficient between perceived ease of use of LMS characteristics and
acceptance of the LMS is 0.638. The correlation coefficient signifies a strong positive
correlation. Therefore, perceived ease of use of LMS characteristics positively affect acceptance
of the LMS.
Correlations
QID1
0_1
QID10_2 QID10_
3
QID10_4 QID10_
5
QID10_6
QID10_1 Pearson
Correlation
1 .611** .574** .413** .395** .408**
Sig. (2-tailed) .000 .000 .000 .000 .000
N 324 324 324 324 324 324
QID10_2 Pearson
Correlation
.611** 1 .638** .396** .338** .383**

STATISTICS - SPSS 6
Sig. (2-tailed) .000 .000 .000 .000 .000
N 324 325 325 325 325 325
QID10_3 Pearson
Correlation
.574** .638** 1 .436** .494** .423**
Sig. (2-tailed) .000 .000 .000 .000 .000
N 324 325 325 325 325 325
QID10_4 Pearson
Correlation
.413** .396** .436** 1 .634** .304**
Sig. (2-tailed) .000 .000 .000 .000 .000
N 324 325 325 325 325 325
QID10_5 Pearson
Correlation
.395** .338** .494** .634** 1 .418**
Sig. (2-tailed) .000 .000 .000 .000 .000
N 324 325 325 325 325 325
QID10_6 Pearson
Correlation
.408** .383** .423** .304** .418** 1
Sig. (2-tailed) .000 .000 .000 .000 .000
N 324 325 325 325 325 325
**. Correlation is significant at the 0.01 level (2-tailed).
Sig. (2-tailed) .000 .000 .000 .000 .000
N 324 325 325 325 325 325
QID10_3 Pearson
Correlation
.574** .638** 1 .436** .494** .423**
Sig. (2-tailed) .000 .000 .000 .000 .000
N 324 325 325 325 325 325
QID10_4 Pearson
Correlation
.413** .396** .436** 1 .634** .304**
Sig. (2-tailed) .000 .000 .000 .000 .000
N 324 325 325 325 325 325
QID10_5 Pearson
Correlation
.395** .338** .494** .634** 1 .418**
Sig. (2-tailed) .000 .000 .000 .000 .000
N 324 325 325 325 325 325
QID10_6 Pearson
Correlation
.408** .383** .423** .304** .418** 1
Sig. (2-tailed) .000 .000 .000 .000 .000
N 324 325 325 325 325 325
**. Correlation is significant at the 0.01 level (2-tailed).
⊘ This is a preview!⊘
Do you want full access?
Subscribe today to unlock all pages.

Trusted by 1+ million students worldwide

STATISTICS - SPSS 7
The T- Test
A t test was used to investigate whether there was any significant differences in the average
values. The output below demonstrates that there was no significant difference in the average
values of the parameters.
One-Sample Test
Test Value = 0
t df Sig. (2-
tailed)
Mean
Difference
95% Confidence Interval
of the Difference
Lower Upper
Question
1
59.005 278 .000 3.183 3.08 3.29
Question
2
97.733 325 .000 3.129 3.07 3.19
Question
3
51.039 324 .000 1.532 1.47 1.59
Question
4
43.754 325 .000 3.347 3.20 3.50
QID5_1 82.011 325 .000 3.883 3.79 3.98
QID6_1 58.280 325 .000 3.282 3.17 3.39
QID7_1 82.622 325 .000 3.871 3.78 3.96
QID8_1 78.145 324 .000 3.803 3.71 3.90
QID9_1 70.346 324 .000 3.791 3.68 3.90
QID10_1 71.900 323 .000 3.744 3.64 3.85
Paraphrase This Document
Need a fresh take? Get an instant paraphrase of this document with our AI Paraphraser

STATISTICS - SPSS 8
The Summary Statistics
The tables below shows the summary statistics of the variables in the data. The summary include
the mean, the median, the variance, the mode and maximum and minimum values as the
measures of central tendencies.
Question 1
Frequency Percent Valid
Percent
Cumulative
Percent
Valid 1 19 5.8 6.8 6.8
2 35 10.7 12.5 19.4
3 101 30.8 36.2 55.6
4 124 37.8 44.4 100.0
Total 279 85.1 100.0
Missing System 49 14.9
Total 328 100.0
Question 2
Frequency Percent Valid
Percent
Cumulative
Percent
Valid 1 1 .3 .3 .3

STATISTICS - SPSS 9
2 33 10.1 10.1 10.4
3 215 65.5 66.0 76.4
4 77 23.5 23.6 100.0
Total 326 99.4 100.0
Missing System 2 .6
Total 328 100.0
Question 3
Frequency Percent Valid
Percent
Cumulative
Percent
Valid 1 159 48.5 48.9 48.9
2 159 48.5 48.9 97.8
3 7 2.1 2.2 100.0
Total 325 99.1 100.0
Missing System 3 .9
Total 328 100.0
Question 4
Frequency Percent Valid
Percent
Cumulative
Percent
Valid 1 53 16.2 16.3 16.3
⊘ This is a preview!⊘
Do you want full access?
Subscribe today to unlock all pages.

Trusted by 1+ million students worldwide

STATISTICS - SPSS 10
2 31 9.5 9.5 25.8
3 75 22.9 23.0 48.8
4 84 25.6 25.8 74.5
5 83 25.3 25.5 100.0
Total 326 99.4 100.0
Missing System 2 .6
Total 328 100.0
QID5_1
Frequency Percent Valid
Percent
Cumulative
Percent
Valid 1 7 2.1 2.1 2.1
2 12 3.7 3.7 5.8
3 62 18.9 19.0 24.8
4 176 53.7 54.0 78.8
5 69 21.0 21.2 100.0
Total 326 99.4 100.0
Missing System 2 .6
Total 328 100.0
Question 1
Paraphrase This Document
Need a fresh take? Get an instant paraphrase of this document with our AI Paraphraser

STATISTICS - SPSS 11
Frequency Percent Valid
Percent
Cumulative
Percent
Valid 1 19 5.8 6.8 6.8
2 35 10.7 12.5 19.4
3 101 30.8 36.2 55.6
4 124 37.8 44.4 100.0
Total 279 85.1 100.0
Missing System 49 14.9
Total 328 100.0
Question 2
Frequency Percent Valid
Percent
Cumulative
Percent
Valid 1 1 .3 .3 .3
2 33 10.1 10.1 10.4
3 215 65.5 66.0 76.4
4 77 23.5 23.6 100.0
Total 326 99.4 100.0
Missing System 2 .6
Total 328 100.0
Question 3
Frequency Percent Valid
Percent
Cumulative
Percent
Valid 1 19 5.8 6.8 6.8
2 35 10.7 12.5 19.4
3 101 30.8 36.2 55.6
4 124 37.8 44.4 100.0
Total 279 85.1 100.0
Missing System 49 14.9
Total 328 100.0
Question 2
Frequency Percent Valid
Percent
Cumulative
Percent
Valid 1 1 .3 .3 .3
2 33 10.1 10.1 10.4
3 215 65.5 66.0 76.4
4 77 23.5 23.6 100.0
Total 326 99.4 100.0
Missing System 2 .6
Total 328 100.0
Question 3

STATISTICS - SPSS 12
Frequency Percent Valid
Percent
Cumulative
Percent
Valid 1 159 48.5 48.9 48.9
2 159 48.5 48.9 97.8
3 7 2.1 2.2 100.0
Total 325 99.1 100.0
Missing System 3 .9
Total 328 100.0
Question 4
Frequency Percent Valid
Percent
Cumulative
Percent
Valid 1 53 16.2 16.3 16.3
2 31 9.5 9.5 25.8
3 75 22.9 23.0 48.8
4 84 25.6 25.8 74.5
5 83 25.3 25.5 100.0
Total 326 99.4 100.0
Missing System 2 .6
Total 328 100.0
Frequency Percent Valid
Percent
Cumulative
Percent
Valid 1 159 48.5 48.9 48.9
2 159 48.5 48.9 97.8
3 7 2.1 2.2 100.0
Total 325 99.1 100.0
Missing System 3 .9
Total 328 100.0
Question 4
Frequency Percent Valid
Percent
Cumulative
Percent
Valid 1 53 16.2 16.3 16.3
2 31 9.5 9.5 25.8
3 75 22.9 23.0 48.8
4 84 25.6 25.8 74.5
5 83 25.3 25.5 100.0
Total 326 99.4 100.0
Missing System 2 .6
Total 328 100.0
⊘ This is a preview!⊘
Do you want full access?
Subscribe today to unlock all pages.

Trusted by 1+ million students worldwide
1 out of 28
Related Documents
Your All-in-One AI-Powered Toolkit for Academic Success.
 +13062052269
info@desklib.com
Available 24*7 on WhatsApp / Email
Unlock your academic potential
Copyright © 2020–2026 A2Z Services. All Rights Reserved. Developed and managed by ZUCOL.


