Quantitative Methods & Individual Differences: Statistical Report
VerifiedAdded on 2023/03/30
|28
|3448
|136
Report
AI Summary
This document presents a comprehensive statistical analysis of four research questions related to quantitative methods and individual differences. Each exercise includes clearly stated hypotheses, detailed results presented in APA style, and thorough testing of assumptions. The analysis covers topics such as life satisfaction across countries and genders, the relationship between freedom of choice and life satisfaction, and the importance of leisure and work. Appropriate statistical tests, including Kruskal-Wallis, multiple linear regression, and ANOVA, were selected based on the nature of the variables and research questions. The findings are discussed in the context of existing literature, with relevant appendices providing detailed statistical outputs and visualizations. This resource offers students a valuable reference for understanding and applying statistical methods in social science research. Desklib provides access to this and other solved assignments.

1
Quantitative Methods & Individual Differences
Quantitative Methods & Individual Differences
Paraphrase This Document
Need a fresh take? Get an instant paraphrase of this document with our AI Paraphraser
2
Table of Contents
Introduction................................................................................................................................4
Statistical Exercises....................................................................................................................4
Exercise 1...................................................................................................................................4
Hypotheses.............................................................................................................................4
Results....................................................................................................................................5
Variables.............................................................................................................................5
Choice of test......................................................................................................................5
Testing of Assumptions......................................................................................................5
Findings..............................................................................................................................5
Discussion...............................................................................................................................6
Appendices - 1........................................................................................................................6
Country wise analysis.........................................................................................................6
Sex wise analysis................................................................................................................8
Exercise 2.................................................................................................................................10
Hypotheses...........................................................................................................................10
Results..................................................................................................................................11
Variables...........................................................................................................................11
Choice of test....................................................................................................................11
Testing of Assumptions....................................................................................................11
Findings............................................................................................................................12
Discussion.............................................................................................................................13
Appendices – 2.....................................................................................................................13
Exercise 3.................................................................................................................................16
Hypotheses...........................................................................................................................16
Results..................................................................................................................................17
Variables...........................................................................................................................17
3
Choice of test....................................................................................................................17
Testing of Assumptions....................................................................................................17
Findings............................................................................................................................18
Discussion.............................................................................................................................19
Appendices - 3......................................................................................................................19
Exercise 4.................................................................................................................................22
Hypotheses...........................................................................................................................22
Results..................................................................................................................................22
Variables...........................................................................................................................22
Choice of test....................................................................................................................22
Testing of Assumptions....................................................................................................22
Findings............................................................................................................................23
Discussion.............................................................................................................................24
Appendices - 4......................................................................................................................24
References................................................................................................................................26
⊘ This is a preview!⊘
Do you want full access?
Subscribe today to unlock all pages.
Trusted by 1+ million students worldwide
4
Introduction
In this study of statistical exercises, statistical analysis of four study problems was
carried out. Each task was appropriately analysed and the results are presented in APA style
in line the module. Test of assumptions was carried out before each statistical analysis, and
relevant statistical information together with appropriate estimates has been reported.
Appropriate set of hypotheses with proper choice of statistical test has been clearly stated.
Each exercise has been answered with checking of assumptions, construction of hypotheses,
results analysis, and discussion with respect to existing literatures.
Statistical Exercises
Exercise 1
Hypotheses
Countries:
Null hypothesis: H01 : M A =M B : There is no difference in median of “life
satisfaction” between people of Argentina and Brazil.
Alternate hypothesis: H A 1 : M A≠ M B : There is significant difference in median of
“life satisfaction” between people of Argentina and Brazil (two tailed).
Sexes:
Null hypothesis: H02 : M m=M f : There is no difference in median of “life
satisfaction” between male and females.
Alternate hypothesis: H A 2 : M m≠M f : There is significant difference in median of
“life satisfaction” between male and females (two tailed).
Paraphrase This Document
Need a fresh take? Get an instant paraphrase of this document with our AI Paraphraser
5
Results
Variables
DV: “life satisfaction” (Ordinal), IVs: Country and Sex (both categorical)
Choice of test
Due to non-normality of the distribution of “life satisfaction” and presence of outliers,
Kruskal-Wallis Test (non-parametric) was chosen, although, homogeneity of variances for
both the categorical variables was satisfied.
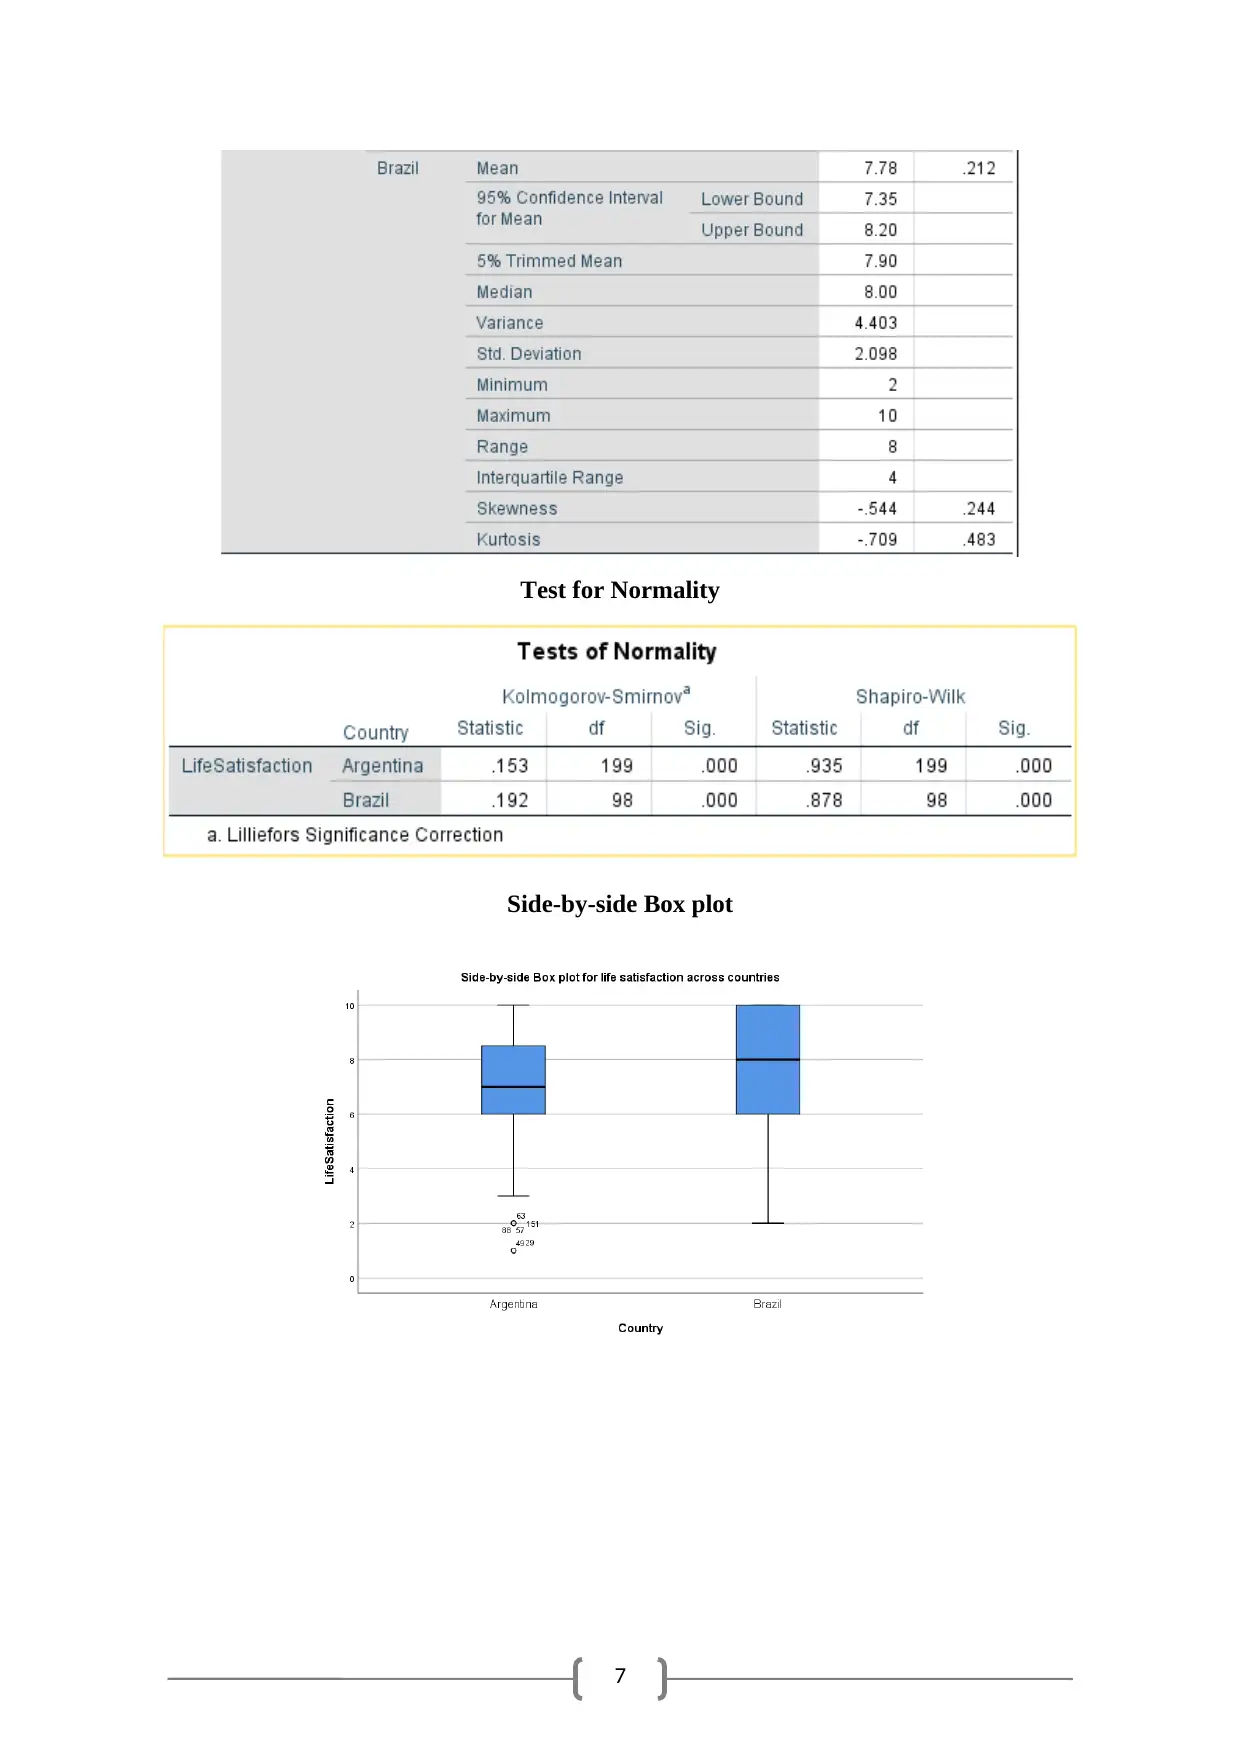
Testing of Assumptions
Shapiro Wilk test confirmed that distribution of “life satisfaction” was not normal for
Argentina (W (199) = 0.93, p < 0.01) and Brazil (W (98) = 0.88, p < 0.01). Presence of six
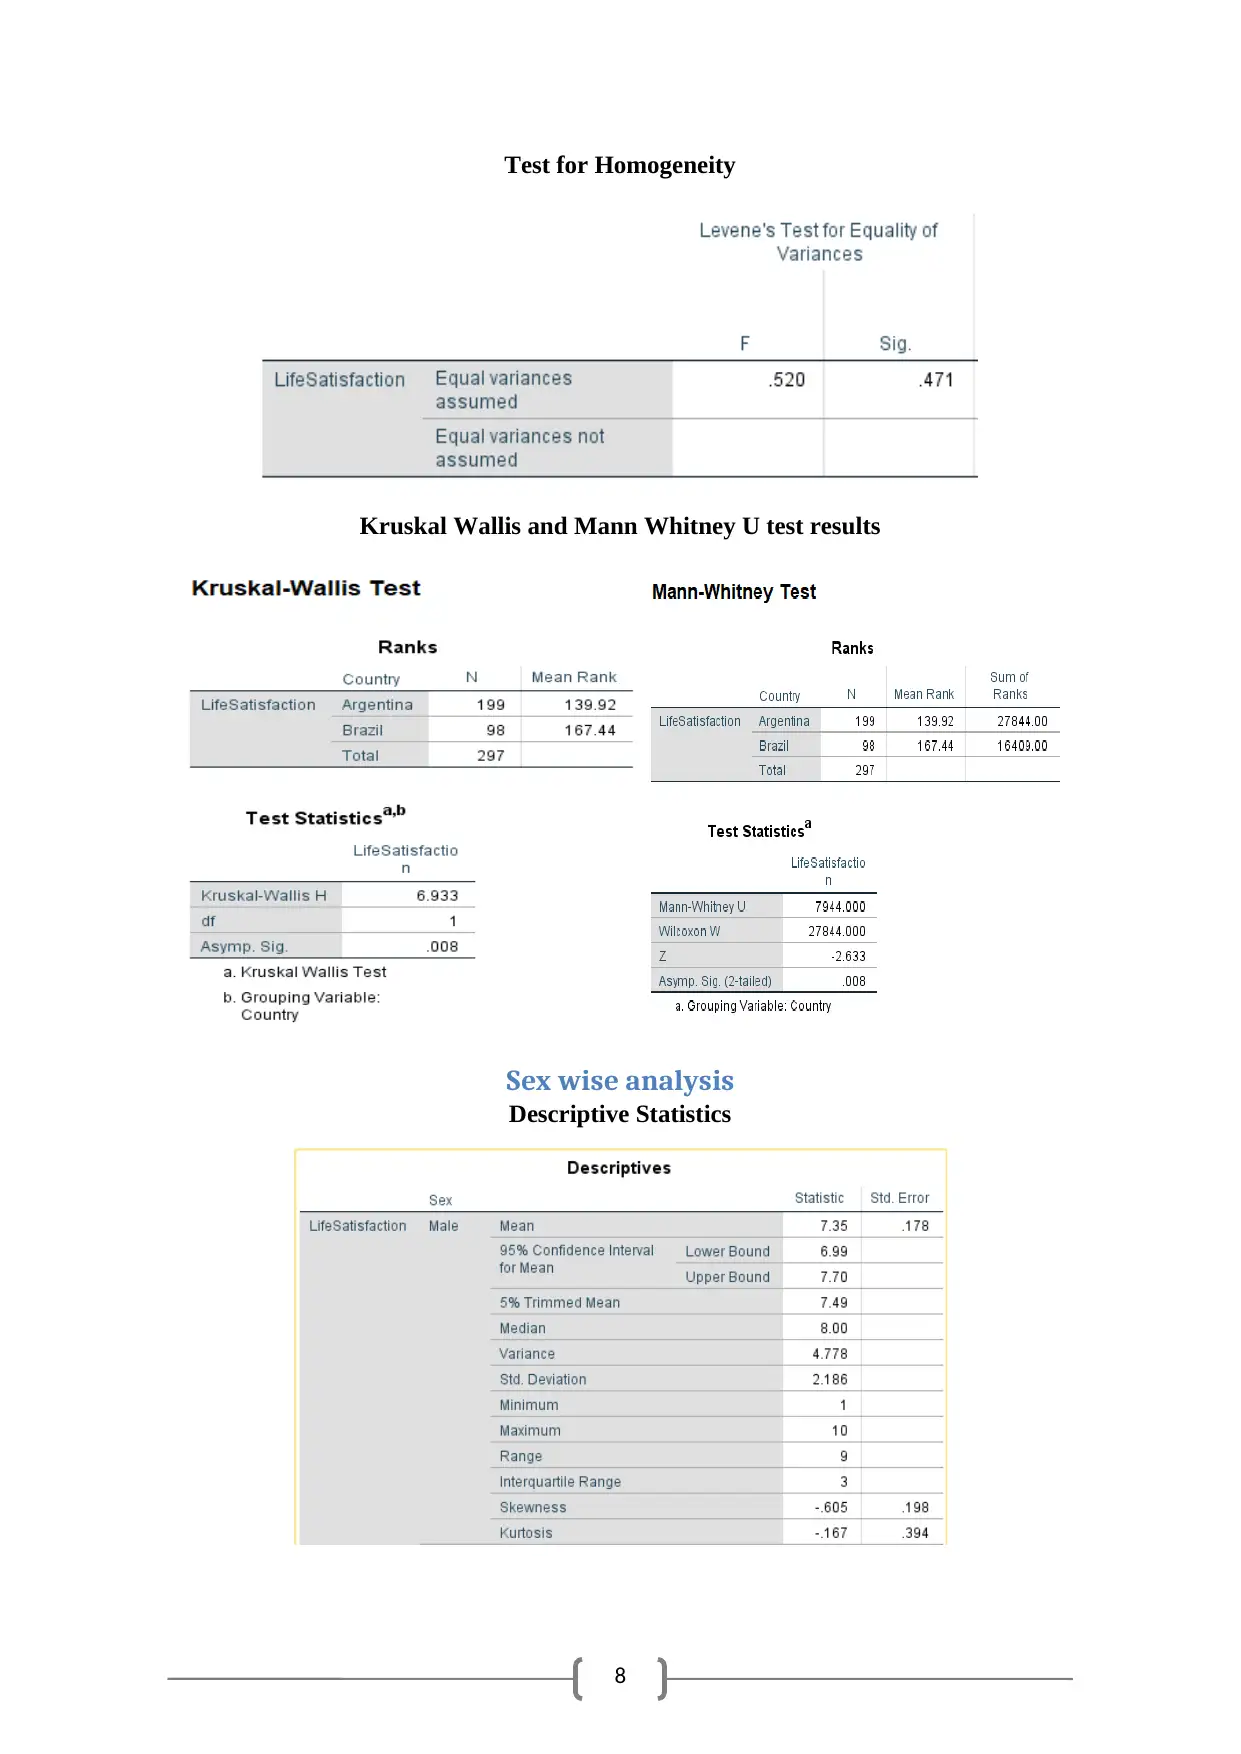
outlier observations was detected for Argentina. Levene’s test for equality of variances
implied that there was homogeneity of variances (F (199) = 0.52, p = 0.47) between “life
satisfaction” of two countries.
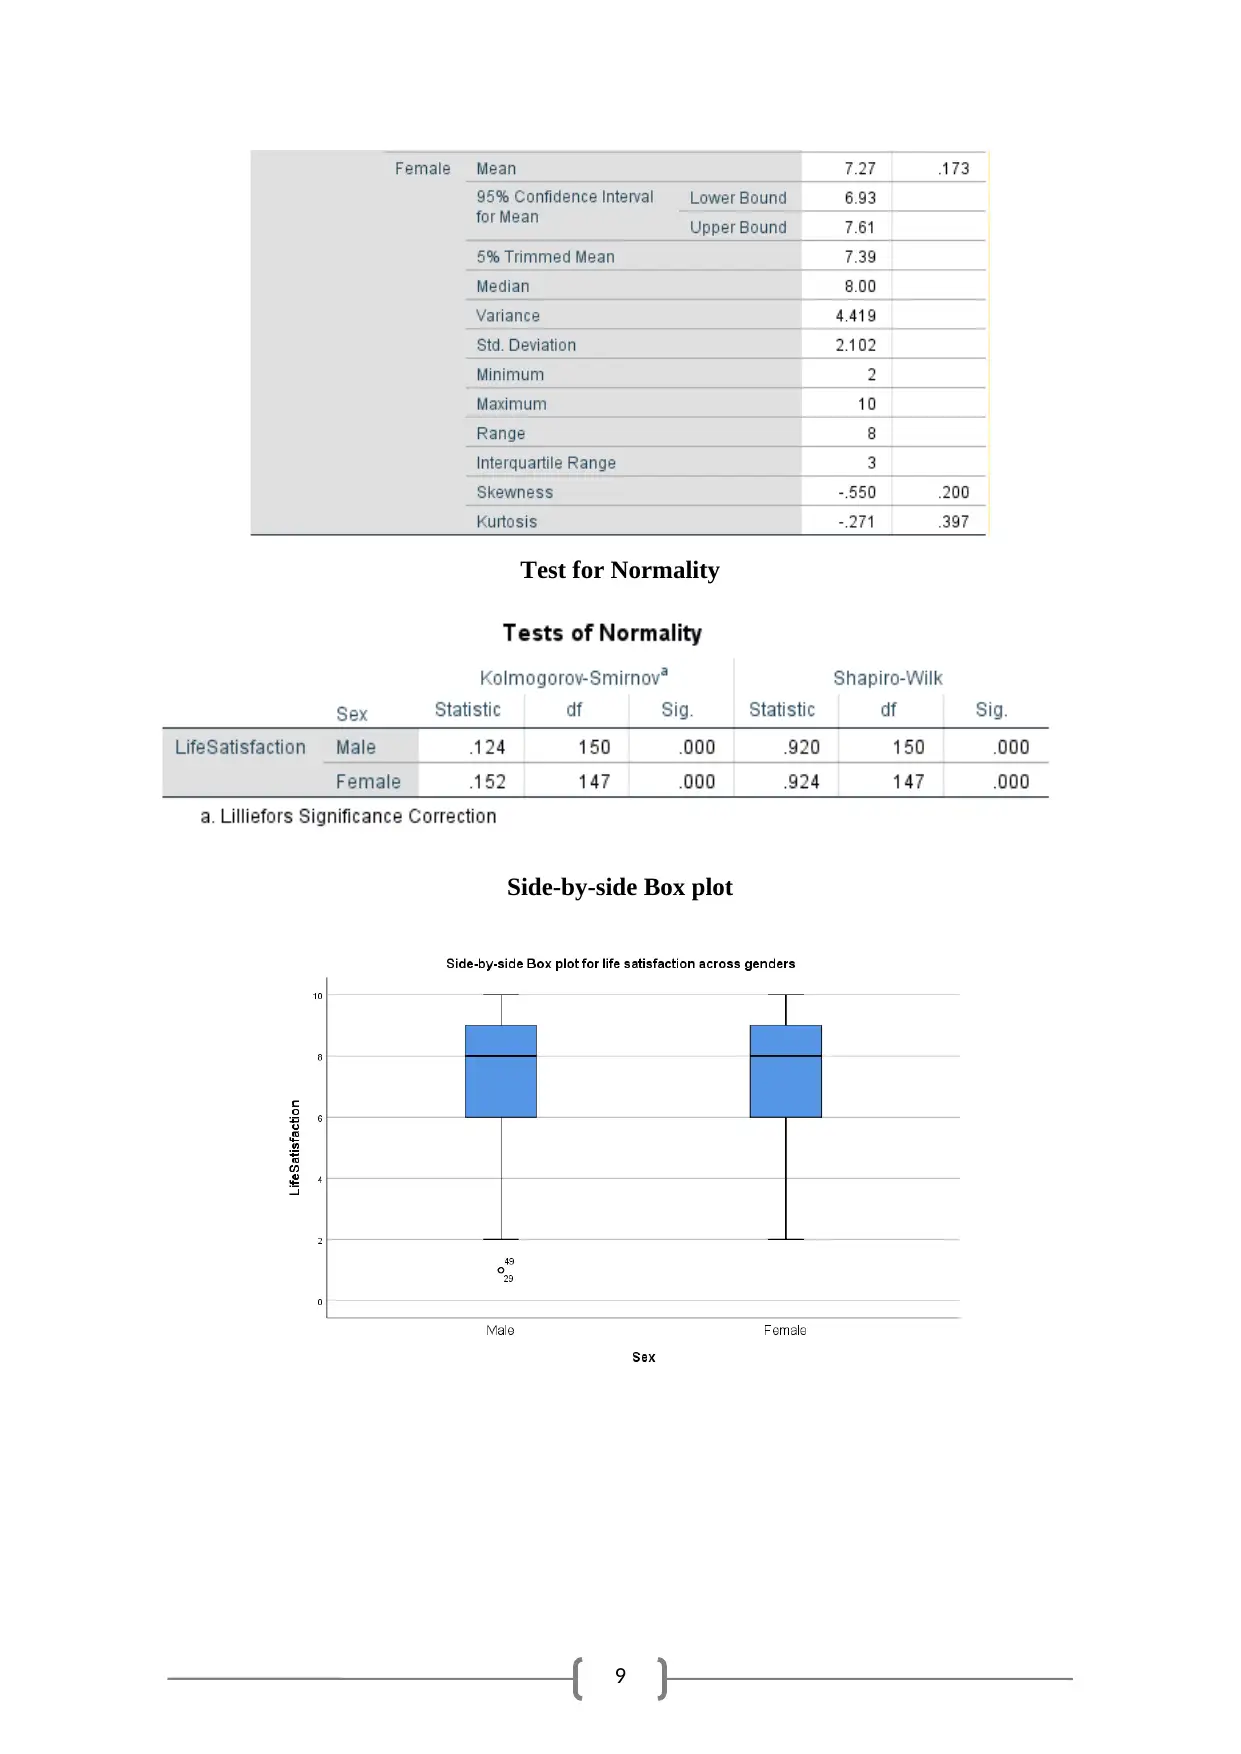
Shapiro Wilk test confirmed that distribution of “life satisfaction” was not normal for
men (W (150) = 0.92, p < 0.01) and women (W (147) = 0.92, p < 0.01). Presence of two
outlier observations was detected for males. Levene’s test for equality of variances implied
that there was homogeneity of variances (F (98) = 0.40, p = 0.53) between “life satisfaction”
of two sexes.
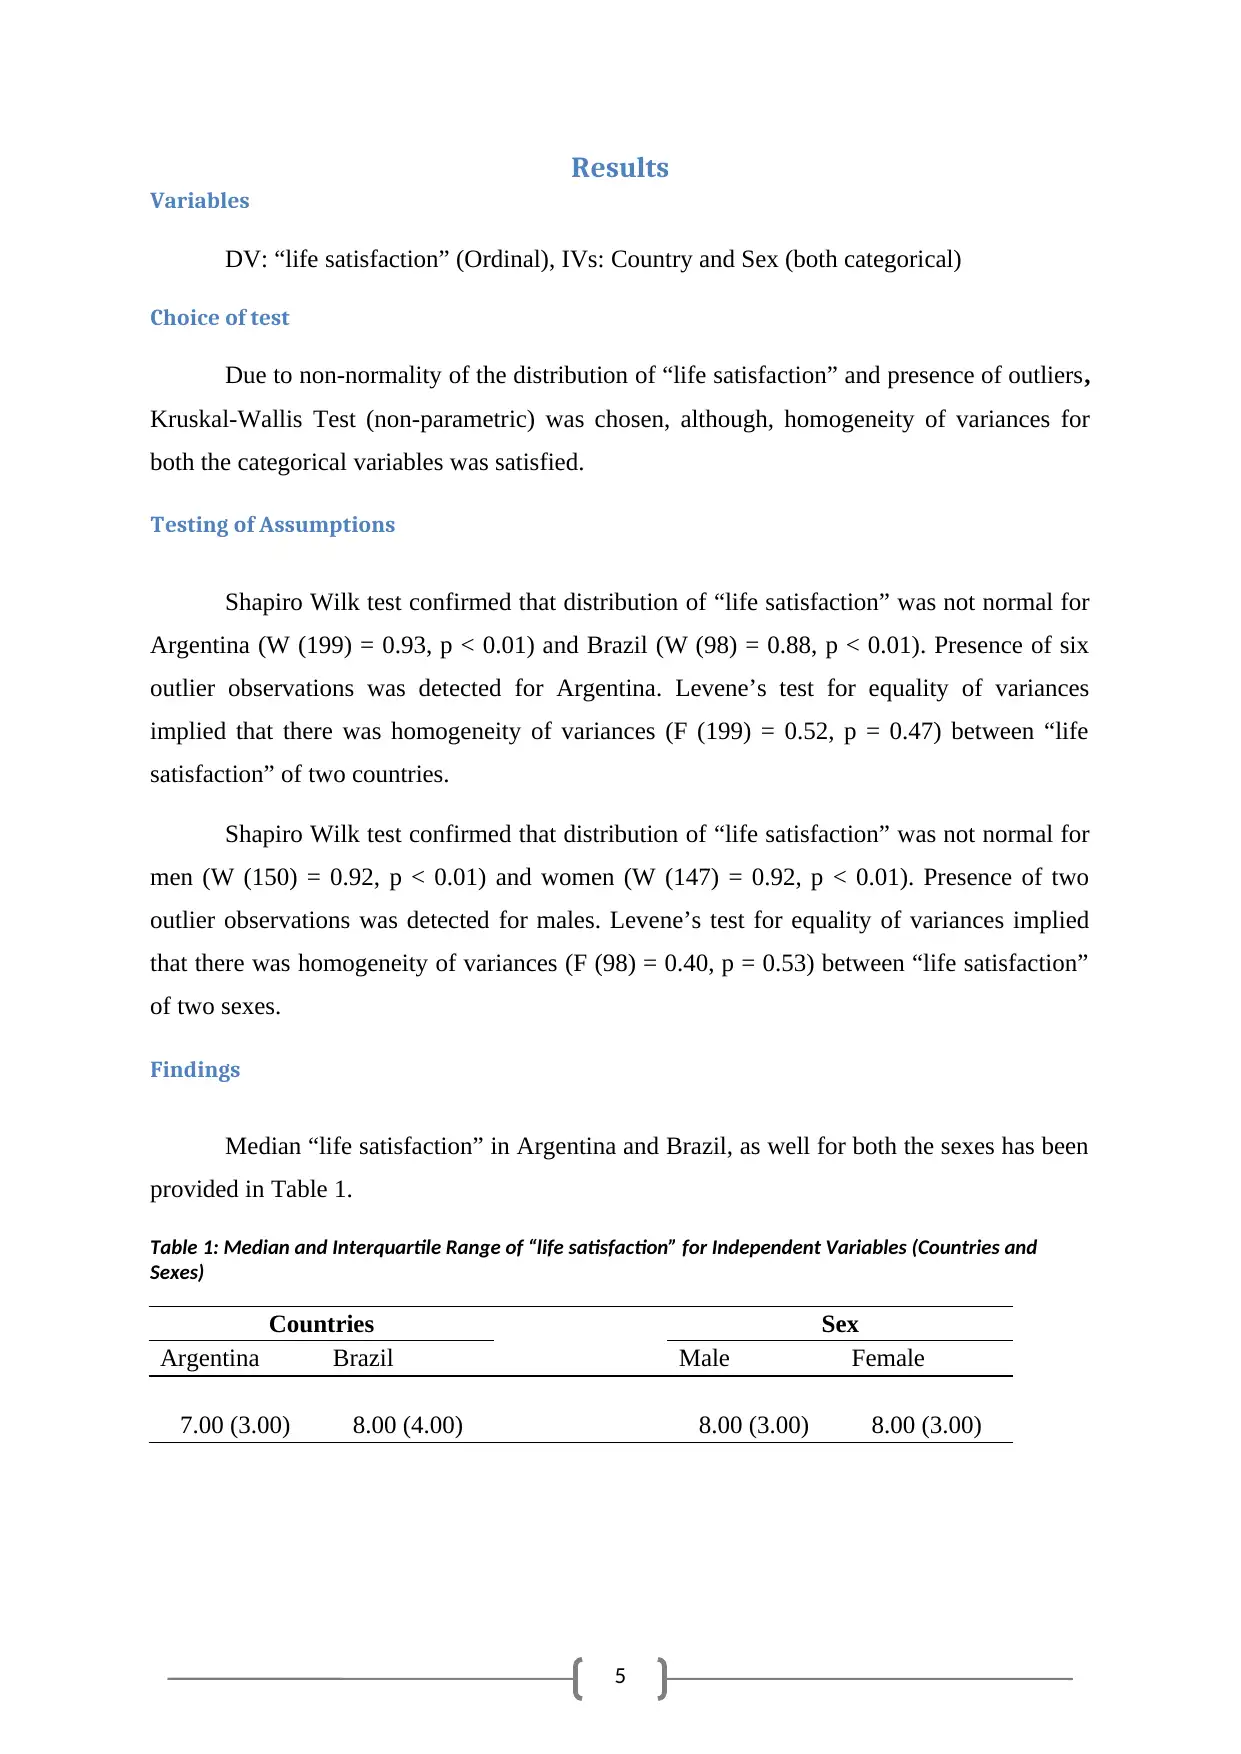
Findings
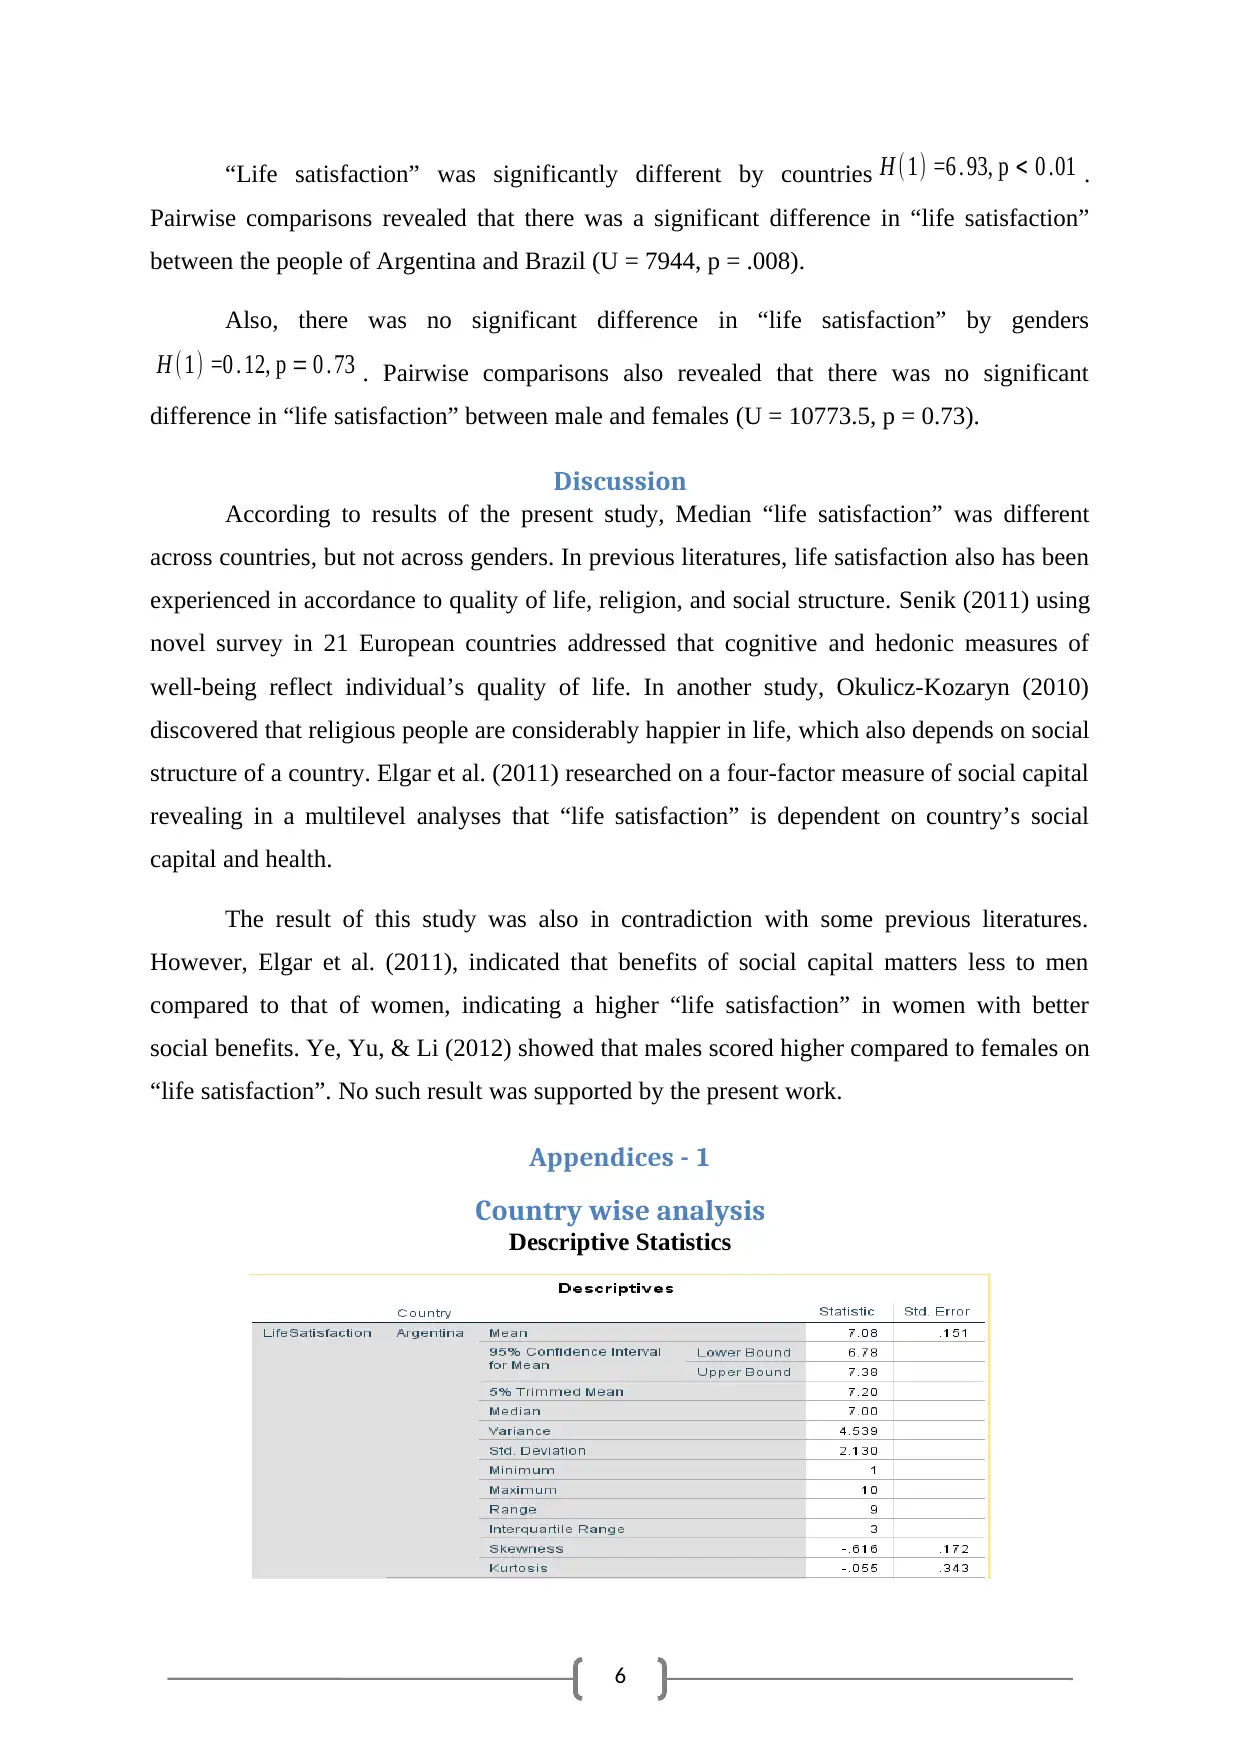
Median “life satisfaction” in Argentina and Brazil, as well for both the sexes has been
provided in Table 1.
Table 1: Median and Interquartile Range of “life satisfaction” for Independent Variables (Countries and
Sexes)
Countries Sex
Argentina Brazil Male Female
7.00 (3.00) 8.00 (4.00) 8.00 (3.00) 8.00 (3.00)
Results
Variables
DV: “life satisfaction” (Ordinal), IVs: Country and Sex (both categorical)
Choice of test
Due to non-normality of the distribution of “life satisfaction” and presence of outliers,
Kruskal-Wallis Test (non-parametric) was chosen, although, homogeneity of variances for
both the categorical variables was satisfied.
Testing of Assumptions
Shapiro Wilk test confirmed that distribution of “life satisfaction” was not normal for
Argentina (W (199) = 0.93, p < 0.01) and Brazil (W (98) = 0.88, p < 0.01). Presence of six
outlier observations was detected for Argentina. Levene’s test for equality of variances
implied that there was homogeneity of variances (F (199) = 0.52, p = 0.47) between “life
satisfaction” of two countries.
Shapiro Wilk test confirmed that distribution of “life satisfaction” was not normal for
men (W (150) = 0.92, p < 0.01) and women (W (147) = 0.92, p < 0.01). Presence of two
outlier observations was detected for males. Levene’s test for equality of variances implied
that there was homogeneity of variances (F (98) = 0.40, p = 0.53) between “life satisfaction”
of two sexes.
Findings
Median “life satisfaction” in Argentina and Brazil, as well for both the sexes has been
provided in Table 1.
Table 1: Median and Interquartile Range of “life satisfaction” for Independent Variables (Countries and
Sexes)
Countries Sex
Argentina Brazil Male Female
7.00 (3.00) 8.00 (4.00) 8.00 (3.00) 8.00 (3.00)
6
“Life satisfaction” was significantly different by countries H ( 1) =6 . 93, p < 0 .01 .
Pairwise comparisons revealed that there was a significant difference in “life satisfaction”
between the people of Argentina and Brazil (U = 7944, p = .008).
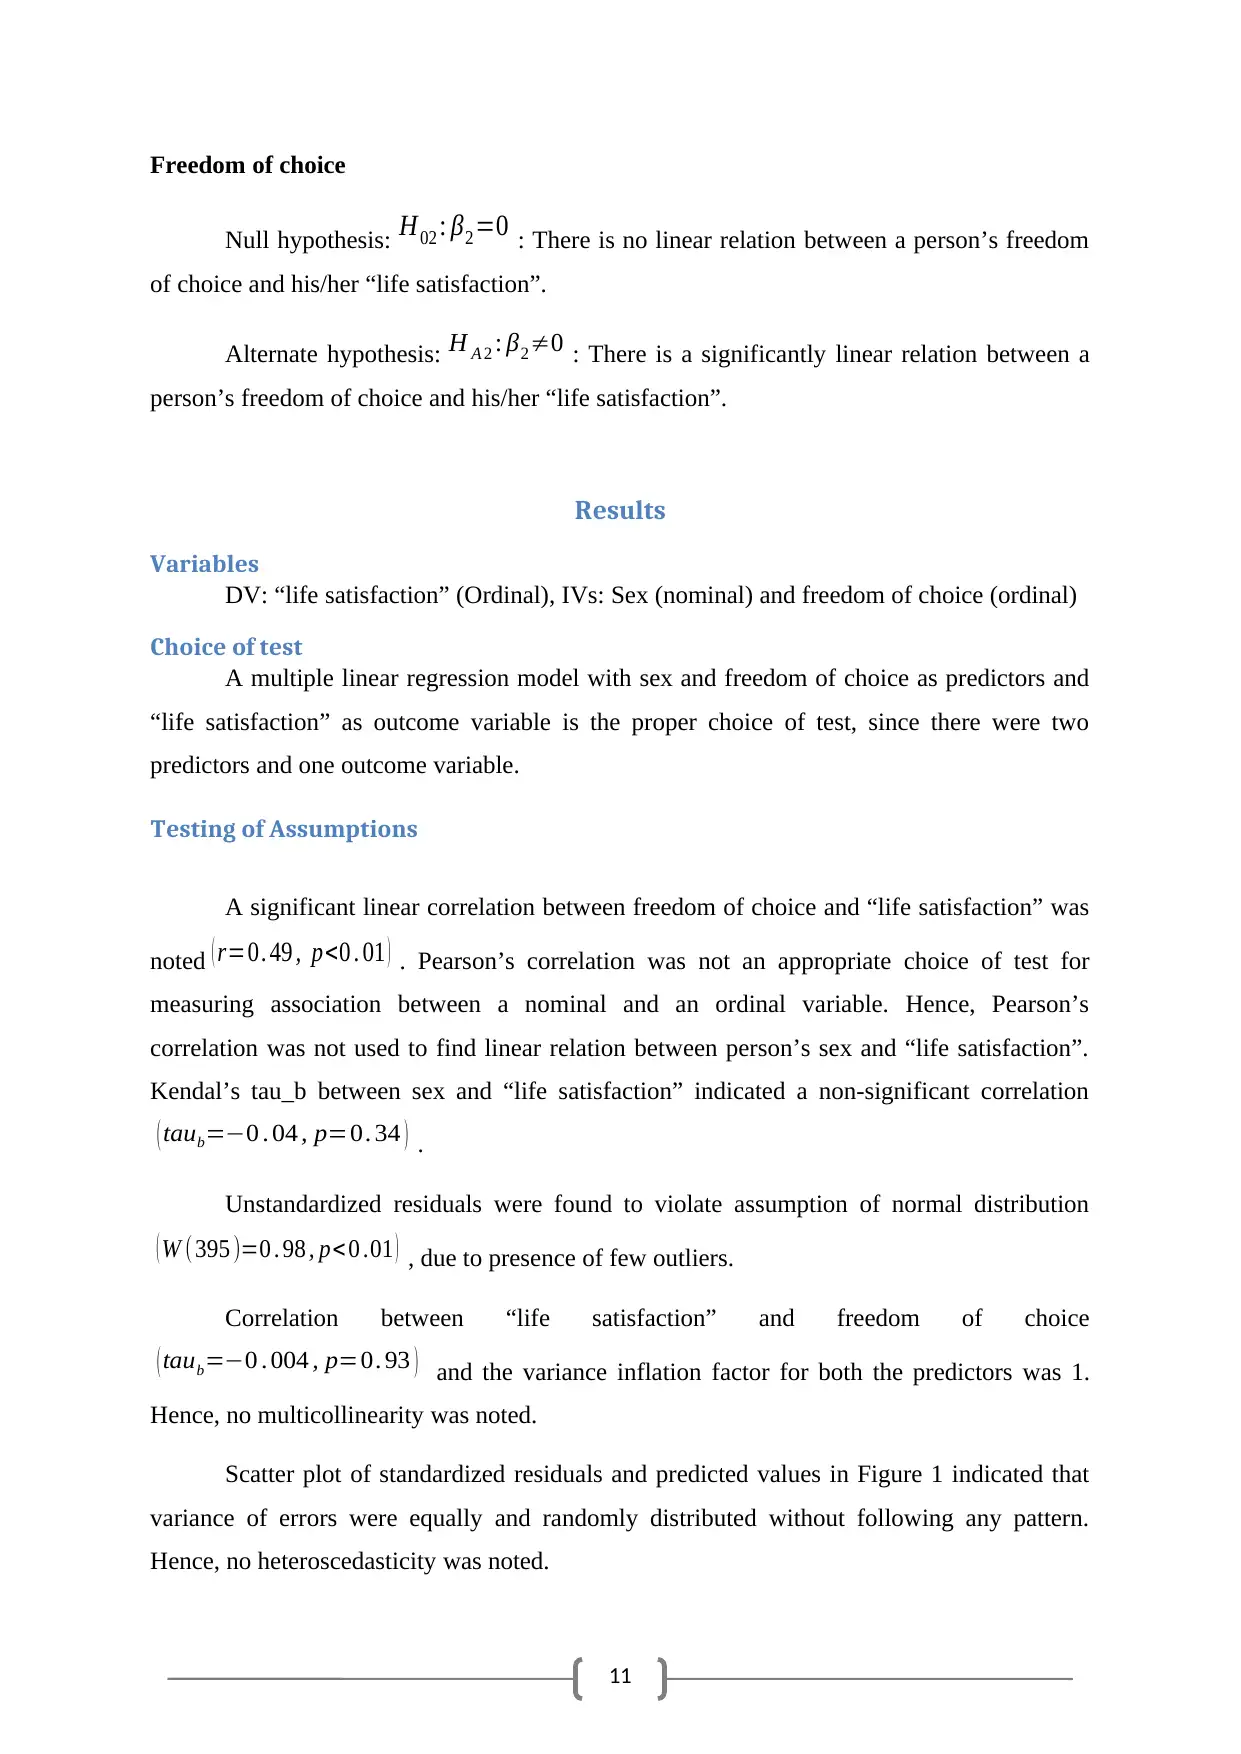
Also, there was no significant difference in “life satisfaction” by genders
H (1) =0 . 12, p = 0 . 73 . Pairwise comparisons also revealed that there was no significant
difference in “life satisfaction” between male and females (U = 10773.5, p = 0.73).
Discussion
According to results of the present study, Median “life satisfaction” was different
across countries, but not across genders. In previous literatures, life satisfaction also has been
experienced in accordance to quality of life, religion, and social structure. Senik (2011) using
novel survey in 21 European countries addressed that cognitive and hedonic measures of
well-being reflect individual’s quality of life. In another study, Okulicz-Kozaryn (2010)
discovered that religious people are considerably happier in life, which also depends on social
structure of a country. Elgar et al. (2011) researched on a four-factor measure of social capital
revealing in a multilevel analyses that “life satisfaction” is dependent on country’s social
capital and health.
The result of this study was also in contradiction with some previous literatures.
However, Elgar et al. (2011), indicated that benefits of social capital matters less to men
compared to that of women, indicating a higher “life satisfaction” in women with better
social benefits. Ye, Yu, & Li (2012) showed that males scored higher compared to females on
“life satisfaction”. No such result was supported by the present work.
Appendices - 1
Country wise analysis
Descriptive Statistics
“Life satisfaction” was significantly different by countries H ( 1) =6 . 93, p < 0 .01 .
Pairwise comparisons revealed that there was a significant difference in “life satisfaction”
between the people of Argentina and Brazil (U = 7944, p = .008).
Also, there was no significant difference in “life satisfaction” by genders
H (1) =0 . 12, p = 0 . 73 . Pairwise comparisons also revealed that there was no significant
difference in “life satisfaction” between male and females (U = 10773.5, p = 0.73).
Discussion
According to results of the present study, Median “life satisfaction” was different
across countries, but not across genders. In previous literatures, life satisfaction also has been
experienced in accordance to quality of life, religion, and social structure. Senik (2011) using
novel survey in 21 European countries addressed that cognitive and hedonic measures of
well-being reflect individual’s quality of life. In another study, Okulicz-Kozaryn (2010)
discovered that religious people are considerably happier in life, which also depends on social
structure of a country. Elgar et al. (2011) researched on a four-factor measure of social capital
revealing in a multilevel analyses that “life satisfaction” is dependent on country’s social
capital and health.
The result of this study was also in contradiction with some previous literatures.
However, Elgar et al. (2011), indicated that benefits of social capital matters less to men
compared to that of women, indicating a higher “life satisfaction” in women with better
social benefits. Ye, Yu, & Li (2012) showed that males scored higher compared to females on
“life satisfaction”. No such result was supported by the present work.
Appendices - 1
Country wise analysis
Descriptive Statistics
⊘ This is a preview!⊘
Do you want full access?
Subscribe today to unlock all pages.
Trusted by 1+ million students worldwide
7
Test for Normality
Side-by-side Box plot
Test for Normality
Side-by-side Box plot
Paraphrase This Document
Need a fresh take? Get an instant paraphrase of this document with our AI Paraphraser
8
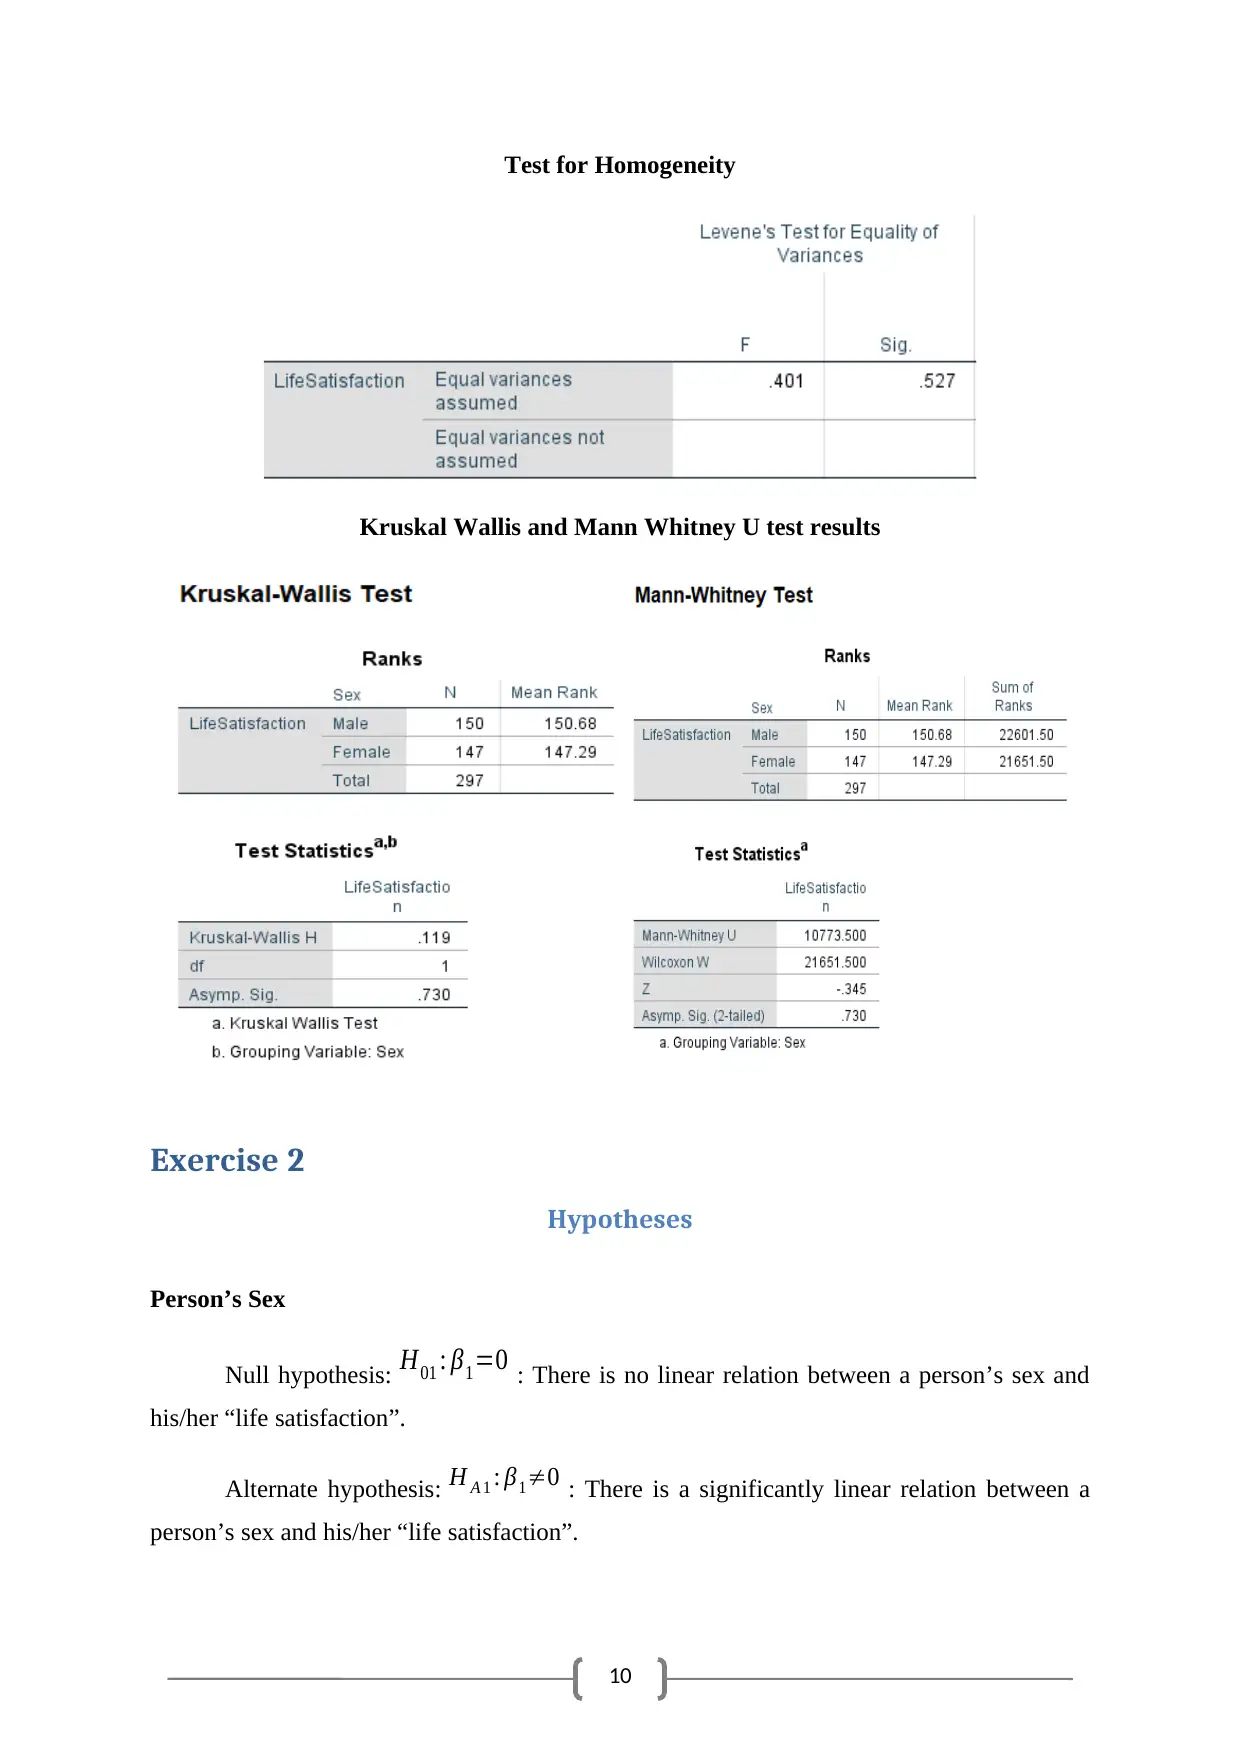
Test for Homogeneity
Kruskal Wallis and Mann Whitney U test results
Sex wise analysis
Descriptive Statistics
Test for Homogeneity
Kruskal Wallis and Mann Whitney U test results
Sex wise analysis
Descriptive Statistics
9
Test for Normality
Side-by-side Box plot
Test for Normality
Side-by-side Box plot
⊘ This is a preview!⊘
Do you want full access?
Subscribe today to unlock all pages.
Trusted by 1+ million students worldwide
10
Test for Homogeneity
Kruskal Wallis and Mann Whitney U test results
Exercise 2
Hypotheses
Person’s Sex
Null hypothesis: H01 : β1=0 : There is no linear relation between a person’s sex and
his/her “life satisfaction”.
Alternate hypothesis: H A 1 : β1≠0 : There is a significantly linear relation between a
person’s sex and his/her “life satisfaction”.
Paraphrase This Document
Need a fresh take? Get an instant paraphrase of this document with our AI Paraphraser
11
Freedom of choice
Null hypothesis: H02 : β2=0 : There is no linear relation between a person’s freedom
of choice and his/her “life satisfaction”.
Alternate hypothesis: H A 2 : β2≠0 : There is a significantly linear relation between a
person’s freedom of choice and his/her “life satisfaction”.
Results
Variables
DV: “life satisfaction” (Ordinal), IVs: Sex (nominal) and freedom of choice (ordinal)
Choice of test
A multiple linear regression model with sex and freedom of choice as predictors and
“life satisfaction” as outcome variable is the proper choice of test, since there were two
predictors and one outcome variable.
Testing of Assumptions
A significant linear correlation between freedom of choice and “life satisfaction” was
noted ( r=0. 49 , p<0 . 01 ) . Pearson’s correlation was not an appropriate choice of test for
measuring association between a nominal and an ordinal variable. Hence, Pearson’s
correlation was not used to find linear relation between person’s sex and “life satisfaction”.
Kendal’s tau_b between sex and “life satisfaction” indicated a non-significant correlation
( taub=−0 . 04 , p=0. 34 ) .
Unstandardized residuals were found to violate assumption of normal distribution
( W (395 )=0 . 98 , p< 0 .01 ) , due to presence of few outliers.
Correlation between “life satisfaction” and freedom of choice
( taub=−0 . 004 , p=0. 93 ) and the variance inflation factor for both the predictors was 1.
Hence, no multicollinearity was noted.
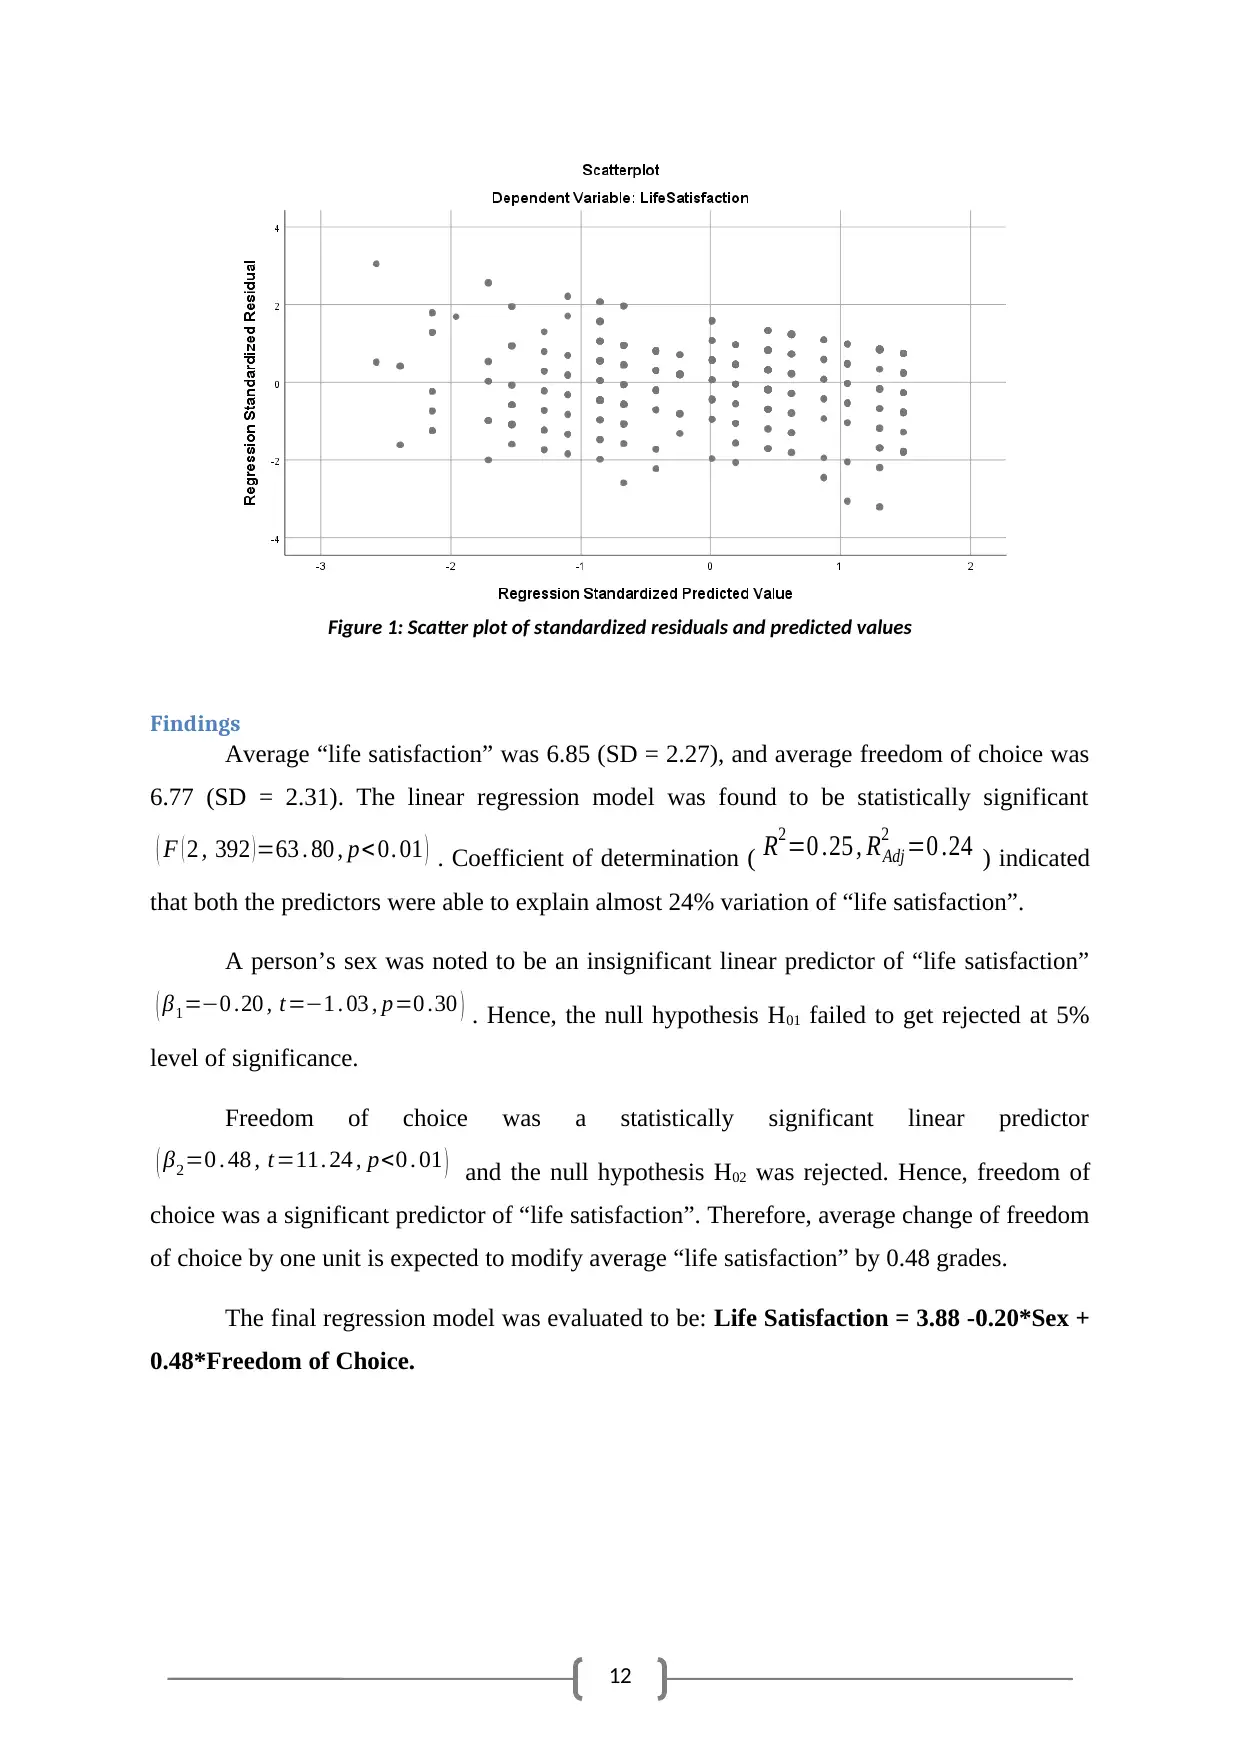
Scatter plot of standardized residuals and predicted values in Figure 1 indicated that
variance of errors were equally and randomly distributed without following any pattern.
Hence, no heteroscedasticity was noted.
Freedom of choice
Null hypothesis: H02 : β2=0 : There is no linear relation between a person’s freedom
of choice and his/her “life satisfaction”.
Alternate hypothesis: H A 2 : β2≠0 : There is a significantly linear relation between a
person’s freedom of choice and his/her “life satisfaction”.
Results
Variables
DV: “life satisfaction” (Ordinal), IVs: Sex (nominal) and freedom of choice (ordinal)
Choice of test
A multiple linear regression model with sex and freedom of choice as predictors and
“life satisfaction” as outcome variable is the proper choice of test, since there were two
predictors and one outcome variable.
Testing of Assumptions
A significant linear correlation between freedom of choice and “life satisfaction” was
noted ( r=0. 49 , p<0 . 01 ) . Pearson’s correlation was not an appropriate choice of test for
measuring association between a nominal and an ordinal variable. Hence, Pearson’s
correlation was not used to find linear relation between person’s sex and “life satisfaction”.
Kendal’s tau_b between sex and “life satisfaction” indicated a non-significant correlation
( taub=−0 . 04 , p=0. 34 ) .
Unstandardized residuals were found to violate assumption of normal distribution
( W (395 )=0 . 98 , p< 0 .01 ) , due to presence of few outliers.
Correlation between “life satisfaction” and freedom of choice
( taub=−0 . 004 , p=0. 93 ) and the variance inflation factor for both the predictors was 1.
Hence, no multicollinearity was noted.
Scatter plot of standardized residuals and predicted values in Figure 1 indicated that
variance of errors were equally and randomly distributed without following any pattern.
Hence, no heteroscedasticity was noted.
12
Figure 1: Scatter plot of standardized residuals and predicted values
Findings
Average “life satisfaction” was 6.85 (SD = 2.27), and average freedom of choice was
6.77 (SD = 2.31). The linear regression model was found to be statistically significant
( F ( 2 , 392 ) =63 . 80 , p< 0. 01 ) . Coefficient of determination ( R2=0 .25 , RAdj
2 =0 .24 ) indicated
that both the predictors were able to explain almost 24% variation of “life satisfaction”.
A person’s sex was noted to be an insignificant linear predictor of “life satisfaction”
( β1=−0 .20 , t=−1 . 03 , p=0 .30 ) . Hence, the null hypothesis H01 failed to get rejected at 5%
level of significance.
Freedom of choice was a statistically significant linear predictor
( β2=0 . 48 , t=11. 24 , p<0 . 01 ) and the null hypothesis H02 was rejected. Hence, freedom of
choice was a significant predictor of “life satisfaction”. Therefore, average change of freedom
of choice by one unit is expected to modify average “life satisfaction” by 0.48 grades.
The final regression model was evaluated to be: Life Satisfaction = 3.88 -0.20*Sex +
0.48*Freedom of Choice.
⊘ This is a preview!⊘
Do you want full access?
Subscribe today to unlock all pages.
Trusted by 1+ million students worldwide
1 out of 28
Related Documents


Your All-in-One AI-Powered Toolkit for Academic Success.
+13062052269
info@desklib.com
Available 24*7 on WhatsApp / Email
![[object Object]](/_next/static/media/star-bottom.7253800d.svg)
Unlock your academic potential
Copyright © 2020–2026 A2Z Services. All Rights Reserved. Developed and managed by ZUCOL.