Statistical Methods: Meeting Business Objectives & Gaining Advantage
VerifiedAdded on 2021/04/23
|19
|5266
|150
Report
AI Summary
This report provides an overview of statistical methods and their importance in achieving business objectives and gaining a competitive advantage. It begins by defining statistics and outlining its key characteristics, such as being an aggregate of facts, influenced by multiple causes, represented numerically, and gathered systematically. The report then discusses the benefits of statistical data for business objectives, including reporting, prediction, and prescriptive analytics. It further explores the sources and types of data available to businesses, including internal data, external data, primary data, secondary data, economic data, political data, and technological data. The report highlights the advantages and disadvantages of each data source. Finally, it emphasizes the value of employing statistical methods in meeting business objectives, using the example of VINACAFÉ BIEN HOA JOINT STOCK to illustrate how statistics can aid in inventory management, cost control, and market prediction, ultimately leading to a competitive edge.
1. The introduction of statistics
1.1 Definition of statistic
1.2 Key characteristics of statistic
Statistics are aggregate of facts:
Only facts that can be explored in relation to time, place, or frequency are classified as statistics.
Individual, isolated, or unconnected figures are not statistics; they cannot be compared to one
another. As a result, only aggregates of facts, such as data pertaining to a group of students' I.Q.,
academic performance of students, and so on, are referred to as statistics and are analysed in
relation to one another. (Disha, 2008)
Multiplicity of Causes has a significant impact on statistics:
Statistical data is most closely related to social sciences, and as a result, improvements are
influenced by a variety of factors. Researchers are unable to investigate the impact of a specific
cause on a phenomenon. Individual causes can only be traced and their effect is obviously
known in physical sciences. They learn about the combined impact of various causes through
statistical social scientific research. (Disha, 2008)
For example, certain students' academic achievement scores may decline not only due to a lack
of interest in school subjects, but also caused by lack of incentive, successful teaching practices,
student attitudes toward school subjects, a defective scoring procedure, and so on.
Numbers are used to represent statistics:
Statistics cannot represent qualitative phenomena that cannot be numerically expressed, such as
honesty, goodness, and ability. However, if a numerical expression is assigned, it may be
referred to as ‘statistics.' (Disha, 2008)
Reasonable standards of accuracy are used to enumerate or quantify statistics:
From one inquiry to the next, or from one purpose to the next, the standard of estimation and
precision varies. There can't be a single uniform standard for all kinds of inquiries and purposes.
1
Paraphrase This Document
Need a fresh take? Get an instant paraphrase of this document with our AI Paraphraser
When calculating the I.Q. of a group of 100 students, a single student cannot be overlooked,
while 10 soldiers can be readily overlooked when calculating the I.Q. of all soldiers in the
country. From one inquiry to the next, or from one purpose to the next, the standard of
estimation and precision varies. There cannot be a single uniform standard for all kinds of
inquiries and purposes. When calculating the I.Q. of a group of 100 students, a single student
cannot be overlooked, while 10 soldiers can be readily overlooked when calculating the I.Q. of
all soldiers in the country. (Disha, 2008)
Statistics are gathered in a methodical manner:
Statistics must be gathered in a very comprehensive way in order to have a fair standard of
accuracy. Any haphazard and sloppy method of data collection is undesirable because it may
lead to erroneous and incorrect conclusions. Accuracy can still be ambiguous and, as a result,
cannot be trusted. (Disha, 2008)
Statistics for a pre-determined Purpose:
The investigator must first establish a goal before beginning the collection process. Data
gathered without a specific purpose is useless. If researchers want to learn about the intelligence
of a group of individuals, they should not gather information about their wealth, attitudes, or
hobbies. They will not be able to differentiate between required and unnecessary data, or
pertinent and irrelevant data, unless they have a clear idea of the intention. (Disha, 2008)
Statistics can be compared to one another in the following way:
Statistics is a technique for comparing and analysing data. It must be able to be compared;
otherwise, much of its value and importance will be lost. Only if the data is homogeneous will a
comparison be made. Memory test results can be likened to I.Q. but not to parent's pay status.
researchers can only represent changes that are related to time, place, frequency, or any other
character using contrast, and statistical devices are used for this purpose. (Disha, 2008)
1.3 Benefits of statistical data for business objectives
2
reporting what has occurred to developing the most accurate predictions for what will occur.
Predictive analysis is used in a variety of situations, including fraud detection and security, threat
assessment, marketing, and operations.
The stage of choosing the best course of action in a given business situation is known as
prescriptive analytics. This requires understanding what might go wrong, why it may go wrong, and
how to deal with it. Continuously updated data alters prescriptive analysis, allowing managers to
retain real-time action plans for their companies.
2. The sources and types of data and information businesses can access
2.1 Sources of data/information
2.1.1 Internal data/information
Definition
Internal data is information, figures, and patterns found by companies as a result of their
activities. Facts and statistics gleaned from internal files, applications, clients, decision-making,
and publications are used. (Sammy, 2021)
Advantages
Customer value: Educational content that tells them what they have not seen before is common
with audiences. Businesses may generate useful content that educates, promotes new concepts,
and/or supports current ideas by using internal data.
Brand authority: The publication of helpful data aids the brand's status as an expert.
Journalists and market observers may frequently quote the company's data-centric content
because it is seen as a go-to source for data about its industry.
Company worth: Internal data may also be used to promote the brand and demonstrate its
worth. The company can use internal data to explain how the goods or services help consumers.
The information will demonstrate how the business distinguishes and stands out from rivals,
allowing the brand to connect with prospective buyers.
Disadvantages
Lack of expertise: It's possible that the company lacks the necessary expertise to develop a
productive workforce. Marketing analysis is a difficult task that necessitates a thorough
understanding of methodological methodology and marketing principles. A small company does
not have the financial or manpower capital to finance or handle such an undertaking. Hiring
third-party consultants to advise on a case-by-case basis may be a safer choice in this case.
3
⊘ This is a preview!⊘
Do you want full access?
Subscribe today to unlock all pages.
Trusted by 1+ million students worldwide
Cost: According to the book "Marketing Analysis," by Jan Wiid and Colin Diggines, recruiting
foreign experts cost more than getting an internal marketing research group. Since all depends
on the particular needs and resources of a given sector, hiring in-house expertise may or may
not be a cost-effective choice. It's possible that establishing an internal communications analysis
agency is overkill.
2.1.2 External data/information
Definition
External data is often correlated with particular debates such as "open data," "linked open data,"
or "data market sites" in reality. Customers and rivals have external data, which is gathered
from the industry. Statistics from polls, questionnaires, studies, and consumer reviews are
sources. (Worthwhile, 2019)
Advantages
- External data sources allow high-quality data and information accessible for companies to
use in their strategic planning.
- The data retained is of high quality.
- The websites of data providers make large amounts of data publicly accessible to
organizations.
- When more comprehensive data is needed, bespoke services are delivered.
- Any providers provide hard copies of their regular publications.
- Comparisons should be rendered using high-level data on peer organizations.
- Training in the use of data is offered by some providers
- Allows a company to compare specific facets of its own success to those of its peers and/or
competitors.
Disadvantages
- Some managers also view dealing with data as a challenge rather than a profit.
- Working with statistics is also seen by some managers as a role reserved for the IT
department.
- It may be difficult to frame the correct question to ask external suppliers if the company
does not have any prior information.
- It is difficult to obtain data at a sufficient level of detail for making useful comparisons with
competitors.
- Providers should offer further reuse advice and case studies to the industry.
2.1.3 Primary data
Definition
4
Paraphrase This Document
Need a fresh take? Get an instant paraphrase of this document with our AI Paraphraser
Primary data is information gathered directly from primary sources by researchers using
methods such as interviews, surveys, and experiments. Primary data is generally taken right
from the source—the place where the data originated from—and is considered the best form of
data in research. (Formpl, 2021)
Primary data sources are normally selected and customized to satisfy the demands or
specifications of a particular research project. Before deciding on a data collection source, it can
often be important to figure out what the research's goal is and who the target population is.
(Formpl, 2021)
Advantage
Primary research has the advantage of allowing the researcher to collect original data that is
both recent and extremely applicable to his or her purposes.
Disadvantage
Primary analysis can take a long time to complete due to the processes involved, often months
or even years. It may also be an incredibly expensive procedure.
2.1.4 Secondary data
Definition
Secondary data is information that has already been gathered from primary sources and made
available to researchers for use in their own studies. It's a kind of information that has already
been gathered. (Formpl, 2021)
A researcher could have gathered data for a single project and then made it available for other
researchers to use. As in the case of the national census, the data could have been gathered for
general use rather than for particular testing purposes. (Formpl, 2021)
Advantage
Secondary research can be completed more efficiently and at a reduced cost since it is primarily
focused on already existing data obtained from previous studies.
Disadvantage
Secondary research has the drawback of making it impossible for the researcher to provide data
that is unique to his or her necessities. Furthermore, existing research data could lack the
currency required to be useful.
2.1.5 Type of data
Economic data: Statistics (quantitative measures) representing an actual economy,
historical or current, are referred to as economic data or economic statistics. Data may also
5
be gathered from polls of individuals and businesses, or aggregated to markets and
industries within a single economy or across the globe.
Political: The term "data politics" refers to the political implications of data, which covers
issues such as data advocacy, transparent data, and open government. Owing to a multitude
of reasons concerning political issues, the ways in which data is processed, obtained, and
what analysts do with the data has changed in modern society.
Technological: Data technologies are being used to handle ever-growing data sets all over
the world. Year after year, humans and computers produce massive amounts of data.
Companies want appropriate technology to monitor data and benefit from it.
3. The value of employing statistical methods when meeting business objectives and achieving
competitive advantage.
3.1 Introduction
In the process of doing business, a lot of businesses gather a lot of data. This is particularly true in
the Internet era, where it's always easy to collect precise details on when consumer open emails or
view certain products on a company's website. In addition, statistics supports business owners in
planning output based on customer expectations, and statistical tools can also be used to more
effectively check product consistency. As a result, the businessman's whole operation is dependent
on statistical data. In business, figures are used to evaluate all of this data to assess what it means
for the company's activities and policy. (Bianca, 2019)
For example, inventory is one of the most important aspect for any manufacturing company like
VINACAFÉ BIEN HOA JOINT STOCK. When this aspect is not managing effectively, it can lead
to a lot of problems such as: lacking of material, goods are in excess and so on. In this case statistic
is significantly important; it makes sure that the inventory can be well managed and cost is always
at a safety level. Moreover, statistic also helps the company measure and evaluate future by figures
which is very useful for predicting the coffee market segment in order to gain the competitive
advantage.
3.2 Value/advantages of using the statistic method in business
The macro index of the market that VINACAFÉ BIEN HOA JOINT STOCK is
operating
- Vietnam is the second-largest coffee manufacturer and exporter in the world. If the country's
population continues to rise at a rate of about one million people per year, the country's
coffee industry is projected to grow steadily over the forecast period.
- The rapid rise in sales of Vietnamese instant coffee paints a positive picture for the coffee
6
⊘ This is a preview!⊘
Do you want full access?
Subscribe today to unlock all pages.
Trusted by 1+ million students worldwide
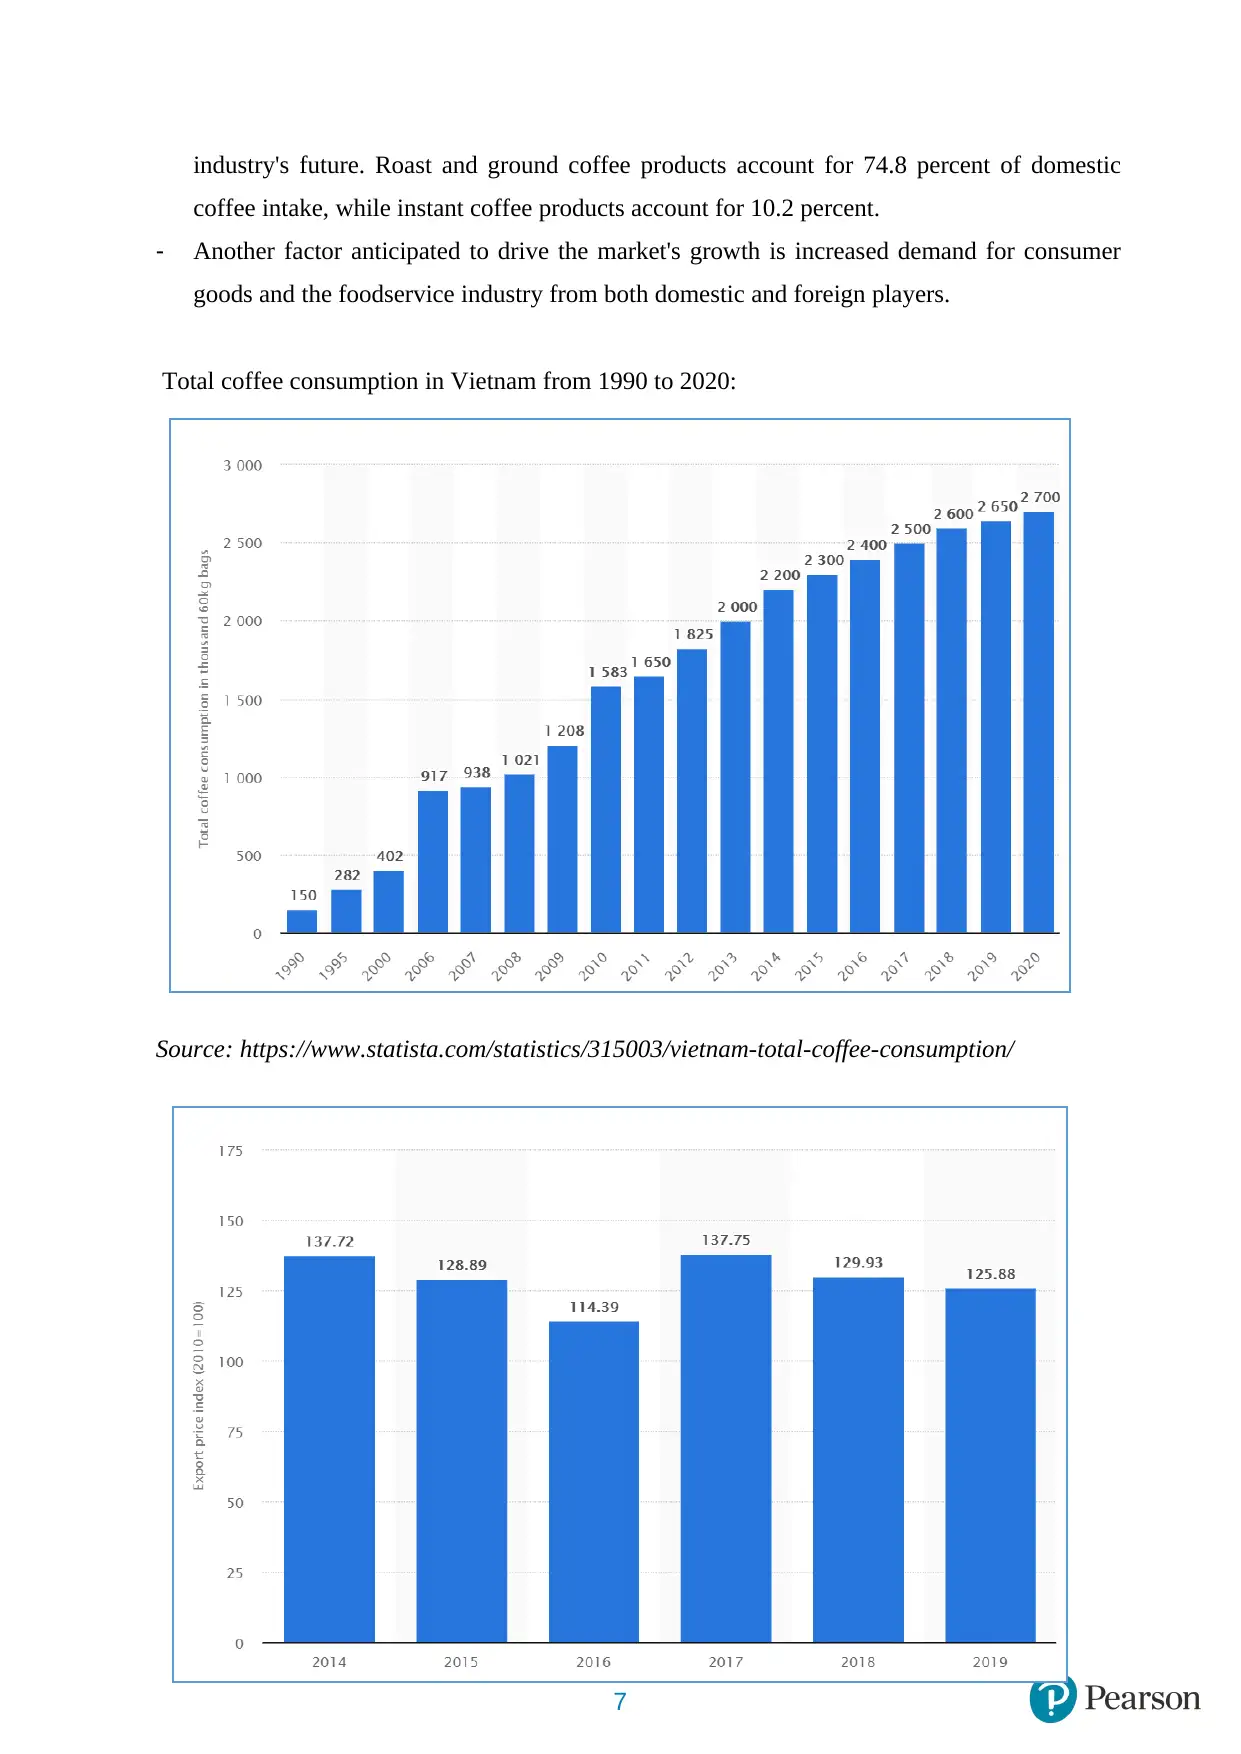
industry's future. Roast and ground coffee products account for 74.8 percent of domestic
coffee intake, while instant coffee products account for 10.2 percent.
- Another factor anticipated to drive the market's growth is increased demand for consumer
goods and the foodservice industry from both domestic and foreign players.
Total coffee consumption in Vietnam from 1990 to 2020:
Source: https://www.statista.com/statistics/315003/vietnam-total-coffee-consumption/
7
Paraphrase This Document
Need a fresh take? Get an instant paraphrase of this document with our AI Paraphraser
Merchandise export price index for coffee in Vietnam from 2014 to 2019:
Source: https://www.statista.com/statistics/1088031/vietnam-merchandise-export-price-index-
coffee/
The whole picture of the industry that organization is operating
Coffee has played a major role in Vietnam's agriculture and industry over the past three
decades. The coffee industry has generated over half a million jobs and is the primary source of
income for thousands of families. Coffee exports typically account for around 15% of overall
agricultural export turnover, and its share of agricultural GDP has consistently exceeded 10% in
recent years. (Vietnamcredit, 2020)
In 1857, the French brought coffee to Vietnam for the first time. With government funding,
Vietnam's coffee production rose from 5900 hectares in the early 1990s to half a million
hectares in 2010, with an annual yield of more than 25 million bags, making Vietnam the
world's second largest coffee producer. (Vietnamcredit, 2020)
In Vietnam, there are two varieties of coffee: Robusta and Arabica. Though Robusta varieties
account for 92.9 percent of total coffee region (and 97 percent of total production), Arabica
varieties account for just a few percent. A gross area of 600,000 ha is expected to be occupied
by coffee plantations. Dak Lak (190,000 ha), Lam Dong (162,000 ha), Dak Nong (135,000 ha),
Gia Lai (82,000 ha), and Kon Tum (82,000 ha) are the most popular coffee-growing areas in the
Central Highlands (13,500 ha). (Vietnamcredit, 2020)
The information of the trend in industry
According to the coffee drinking habit of Vietnamese people, they tend to drink the coffee that
is fast and convenient to make. This is the reason why baking and instant coffee deep processing
with high added value are becoming more common. Consumers are familiar with the coffee
brands Vinacafe, Trung Nguyen, An Thai, Me Trang, and Phuong Vy. (Researchandmarkets,
2017)
Vietnamese coffee is widespread all over the world, according to the survey. The volume and
value of exports are rapidly increasing. Between 1991 and 1995, Vietnam's annual coffee bean
export volume was just 142,000 tons, with an annual export value of only USD 210 million. The
export volume exceeded 1 million tons from 2006 to 2016, with the peak annual export value
reaching USD 3 billion. (Researchandmarkets, 2017)
Information about competitors/customers in industry
Along with Vinacafé, a number of new coffee brands have entered the Vietnamese market,
which include Highlands, The Coffee House, and Starbucks. According to ing.vn, there are
8
reportedly 60 Trung Nguyen coffee shops, which is less than half the number of Highlands
outlets (150). However, in terms of instant coffee Vinacafé is stronger than its long-term
competitors like Trung Nguyen and Nestlé. Furthermore, the Coffee House, a new coffee
company, has increased its store count to 80 and has begun exporting coffee purchased from
Cau Dat Farm. (Vir, 2018)
In addition, NutiFood, a company previously unknown to the coffee industry, has entered the
domestic market. NutiFood announced in 2017 that it will spend VND1 trillion ($44 million) in
the Central Highlands province of Dak Lak to grow coffee plants. This company is also a major
shareholder in Phuoc An Coffee JSC, a Dak Lak-based coffee company with an annual export
revenue of $12-15 million. (Vir, 2018)
For the customers of coffee industry, especially who are interested in instant coffee product like
Vinacafé. The size of customer can be widespread, from households to workers, particularly for
those who have job and do not have much time to make filtered coffee.
In conclusion, the consumption of Vietnamese people for coffee market is more and more
increasing. For the busy life nowadays that creates a great opportunity for instant coffee product
of Vinacafé. However, the company should make some differences in this product segment like
adding more options for product design in other to make instant coffee product can be more
diverse. Finally, the organization could launch coffee can to the market to increase the
competitive advance.
4. Deductive and inductive approaches and the implications for business intelligence.
4.1. Deductive approaches
Definition
9
⊘ This is a preview!⊘
Do you want full access?
Subscribe today to unlock all pages.
Trusted by 1+ million students worldwide
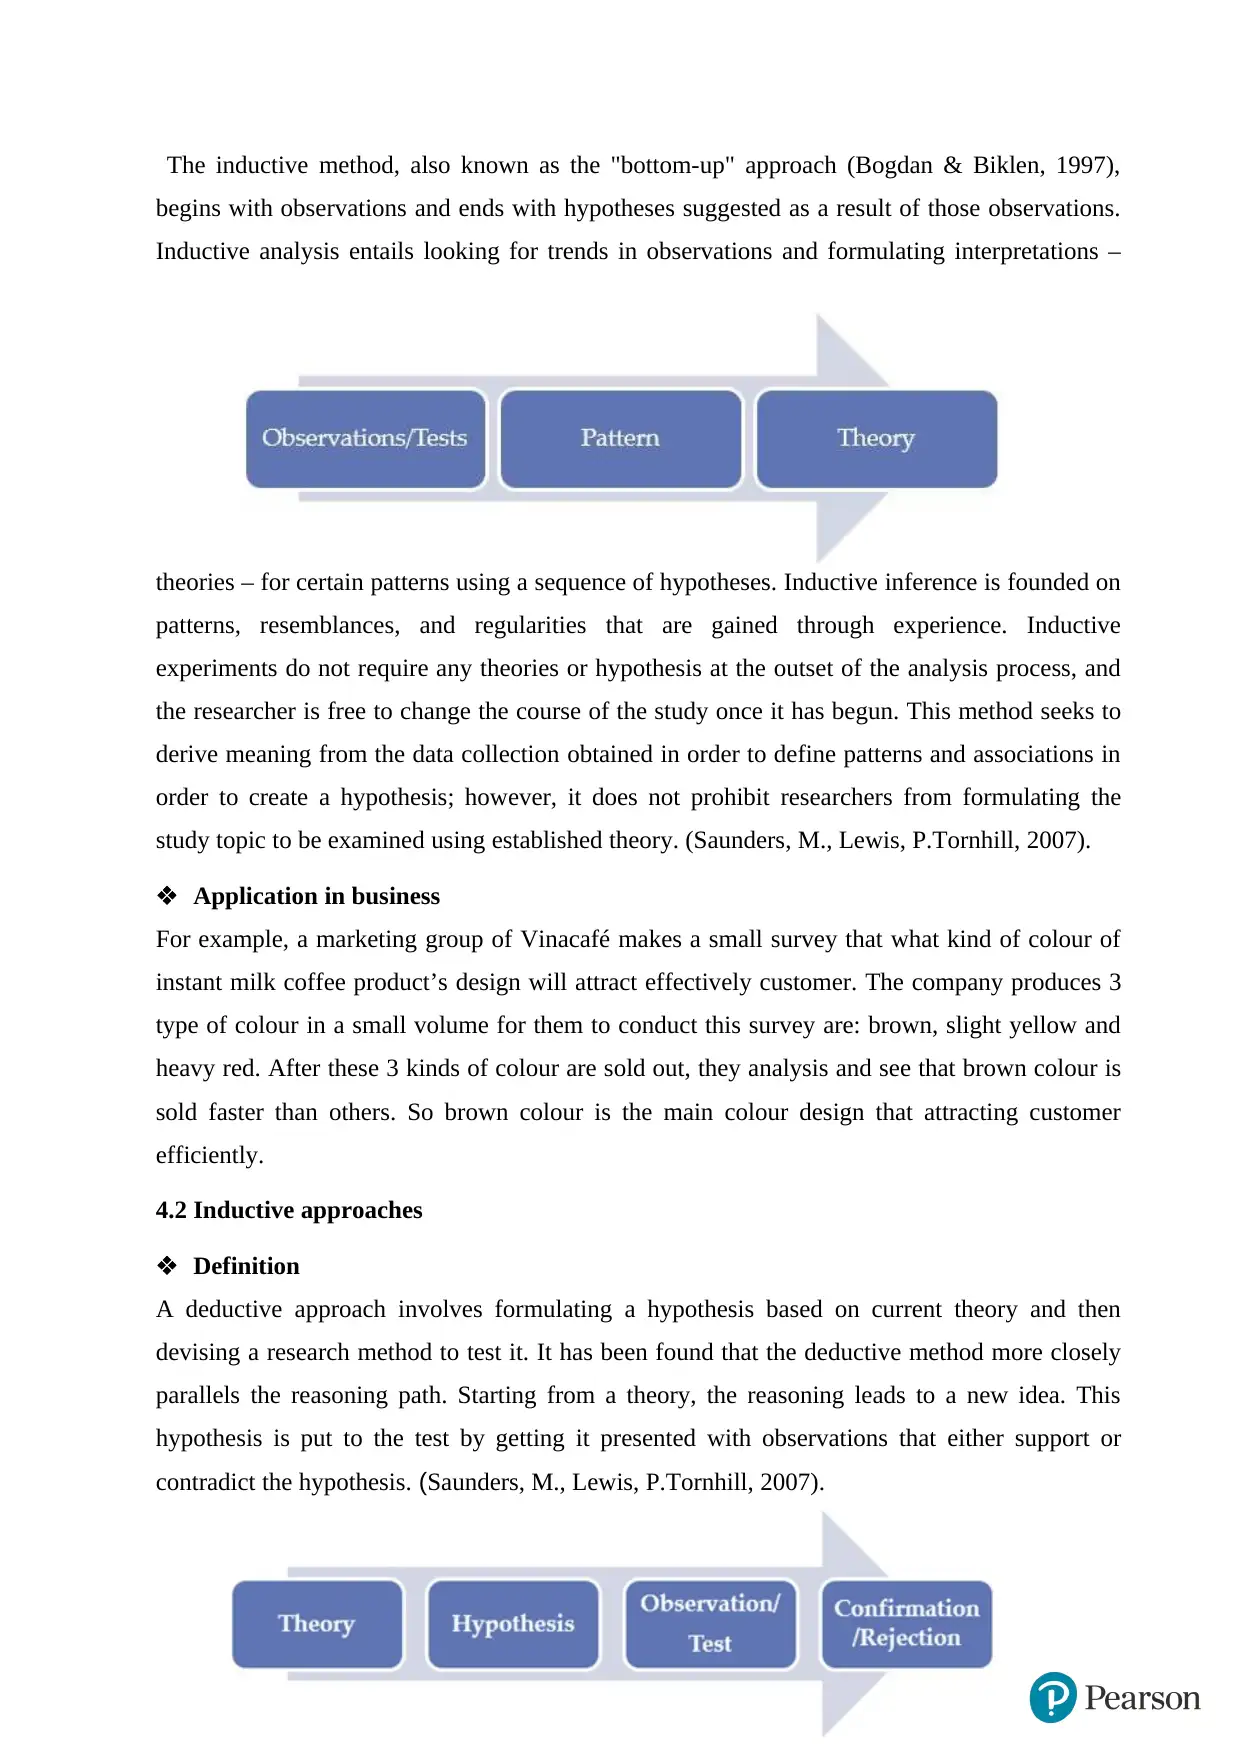
The inductive method, also known as the "bottom-up" approach (Bogdan & Biklen, 1997),
begins with observations and ends with hypotheses suggested as a result of those observations.
Inductive analysis entails looking for trends in observations and formulating interpretations –
theories – for certain patterns using a sequence of hypotheses. Inductive inference is founded on
patterns, resemblances, and regularities that are gained through experience. Inductive
experiments do not require any theories or hypothesis at the outset of the analysis process, and
the researcher is free to change the course of the study once it has begun. This method seeks to
derive meaning from the data collection obtained in order to define patterns and associations in
order to create a hypothesis; however, it does not prohibit researchers from formulating the
study topic to be examined using established theory. (Saunders, M., Lewis, P.Tornhill, 2007).
Application in business
For example, a marketing group of Vinacafé makes a small survey that what kind of colour of
instant milk coffee product’s design will attract effectively customer. The company produces 3
type of colour in a small volume for them to conduct this survey are: brown, slight yellow and
heavy red. After these 3 kinds of colour are sold out, they analysis and see that brown colour is
sold faster than others. So brown colour is the main colour design that attracting customer
efficiently.
4.2 Inductive approaches
Definition
A deductive approach involves formulating a hypothesis based on current theory and then
devising a research method to test it. It has been found that the deductive method more closely
parallels the reasoning path. Starting from a theory, the reasoning leads to a new idea. This
hypothesis is put to the test by getting it presented with observations that either support or
contradict the hypothesis. (Saunders, M., Lewis, P.Tornhill, 2007).
10
Paraphrase This Document
Need a fresh take? Get an instant paraphrase of this document with our AI Paraphraser
Application in business
For example, there is no doubt that instant coffee is almost purchased by people for those who
are busy, especially having jobs. By this reason, Vinacafé will make a research that the
company would sell the instant coffee product in 2 kind of different places: one is where has a
lot of households and another is nearby offices. After these products are sold out, the
organization realizes that products of place where contains many offices are sold faster than
another one. Therefore, Vinacafé has the conclusion that people who have jobs like officers or
workers are the main value customers of the company.
5. Example of external and internal data and analysis
5.1 Example of external data
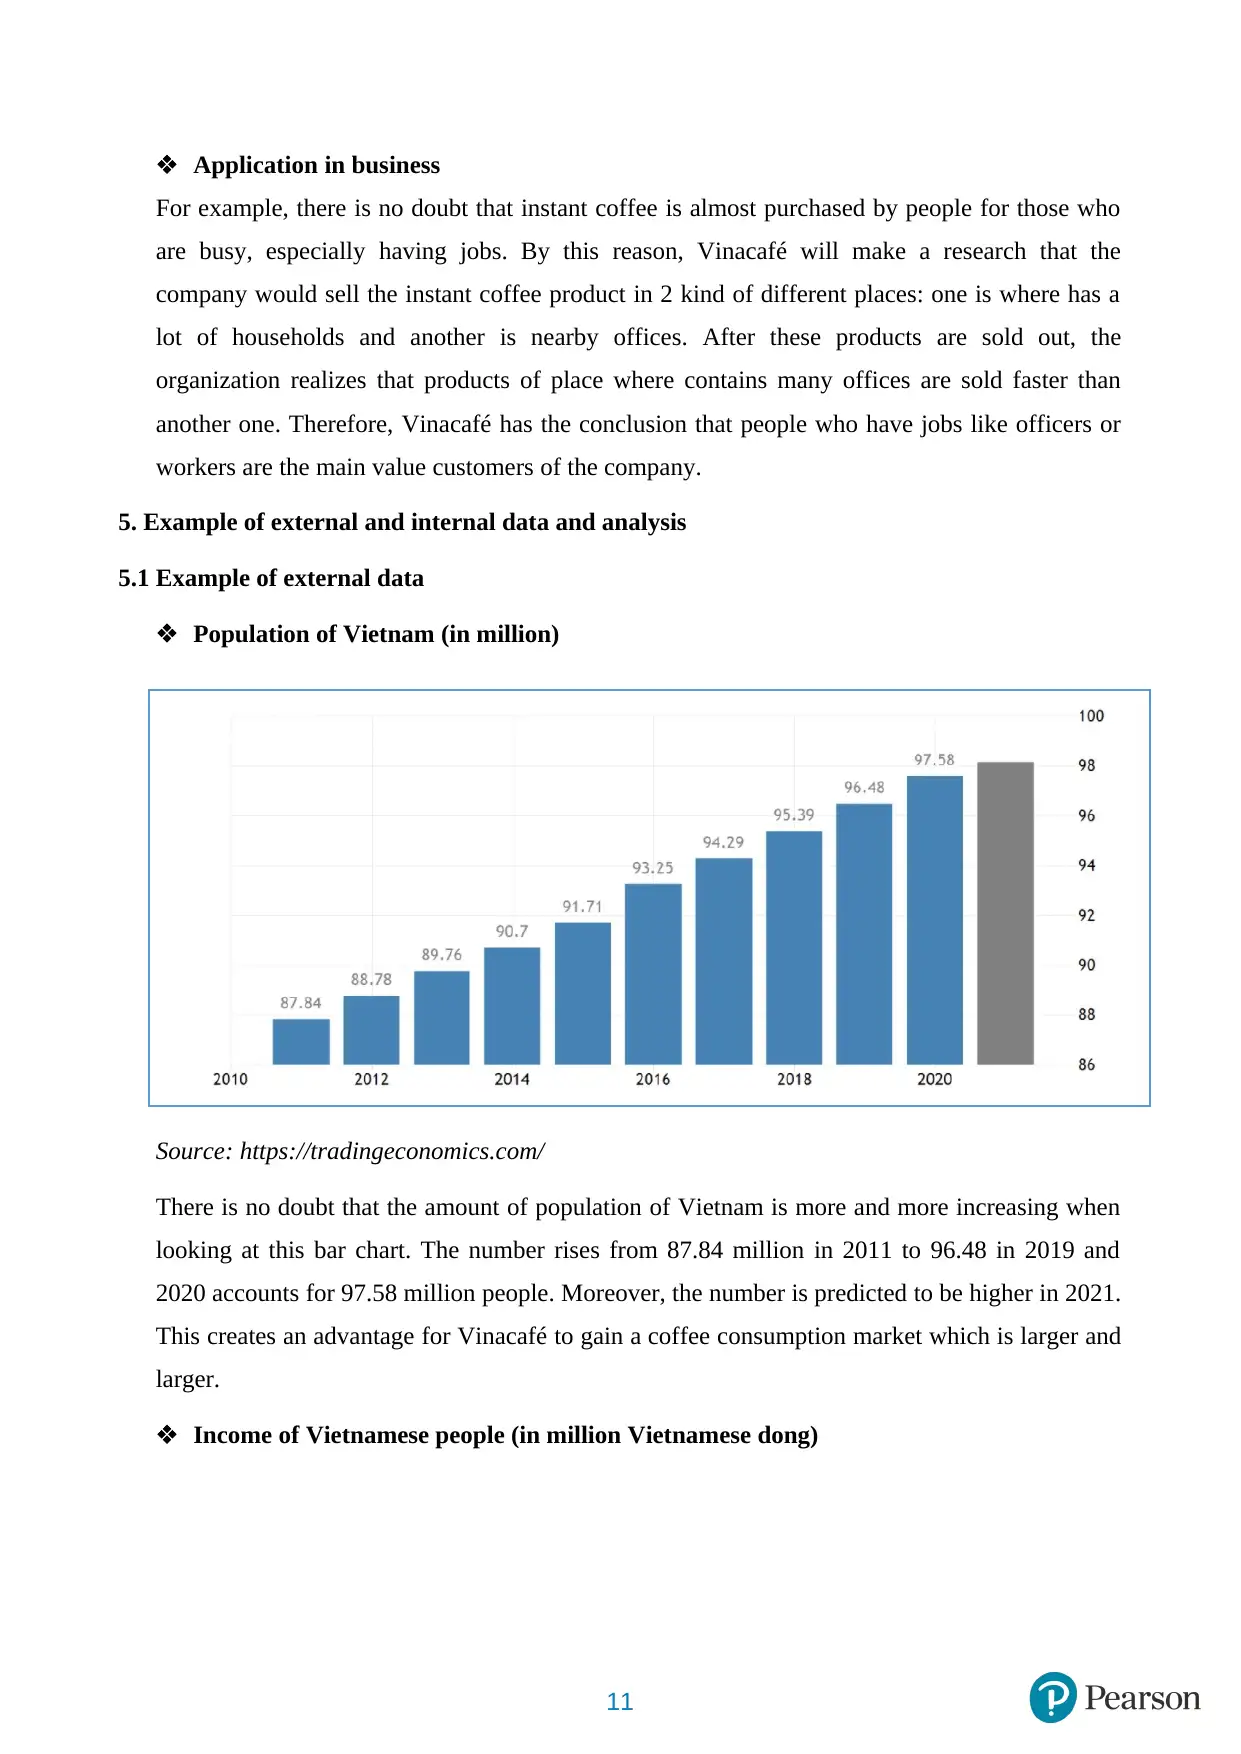
Population of Vietnam (in million)
Source: https://tradingeconomics.com/
There is no doubt that the amount of population of Vietnam is more and more increasing when
looking at this bar chart. The number rises from 87.84 million in 2011 to 96.48 in 2019 and
2020 accounts for 97.58 million people. Moreover, the number is predicted to be higher in 2021.
This creates an advantage for Vinacafé to gain a coffee consumption market which is larger and
larger.
Income of Vietnamese people (in million Vietnamese dong)
11
For example, there is no doubt that instant coffee is almost purchased by people for those who
are busy, especially having jobs. By this reason, Vinacafé will make a research that the
company would sell the instant coffee product in 2 kind of different places: one is where has a
lot of households and another is nearby offices. After these products are sold out, the
organization realizes that products of place where contains many offices are sold faster than
another one. Therefore, Vinacafé has the conclusion that people who have jobs like officers or
workers are the main value customers of the company.
5. Example of external and internal data and analysis
5.1 Example of external data
Population of Vietnam (in million)
Source: https://tradingeconomics.com/
There is no doubt that the amount of population of Vietnam is more and more increasing when
looking at this bar chart. The number rises from 87.84 million in 2011 to 96.48 in 2019 and
2020 accounts for 97.58 million people. Moreover, the number is predicted to be higher in 2021.
This creates an advantage for Vinacafé to gain a coffee consumption market which is larger and
larger.
Income of Vietnamese people (in million Vietnamese dong)
11
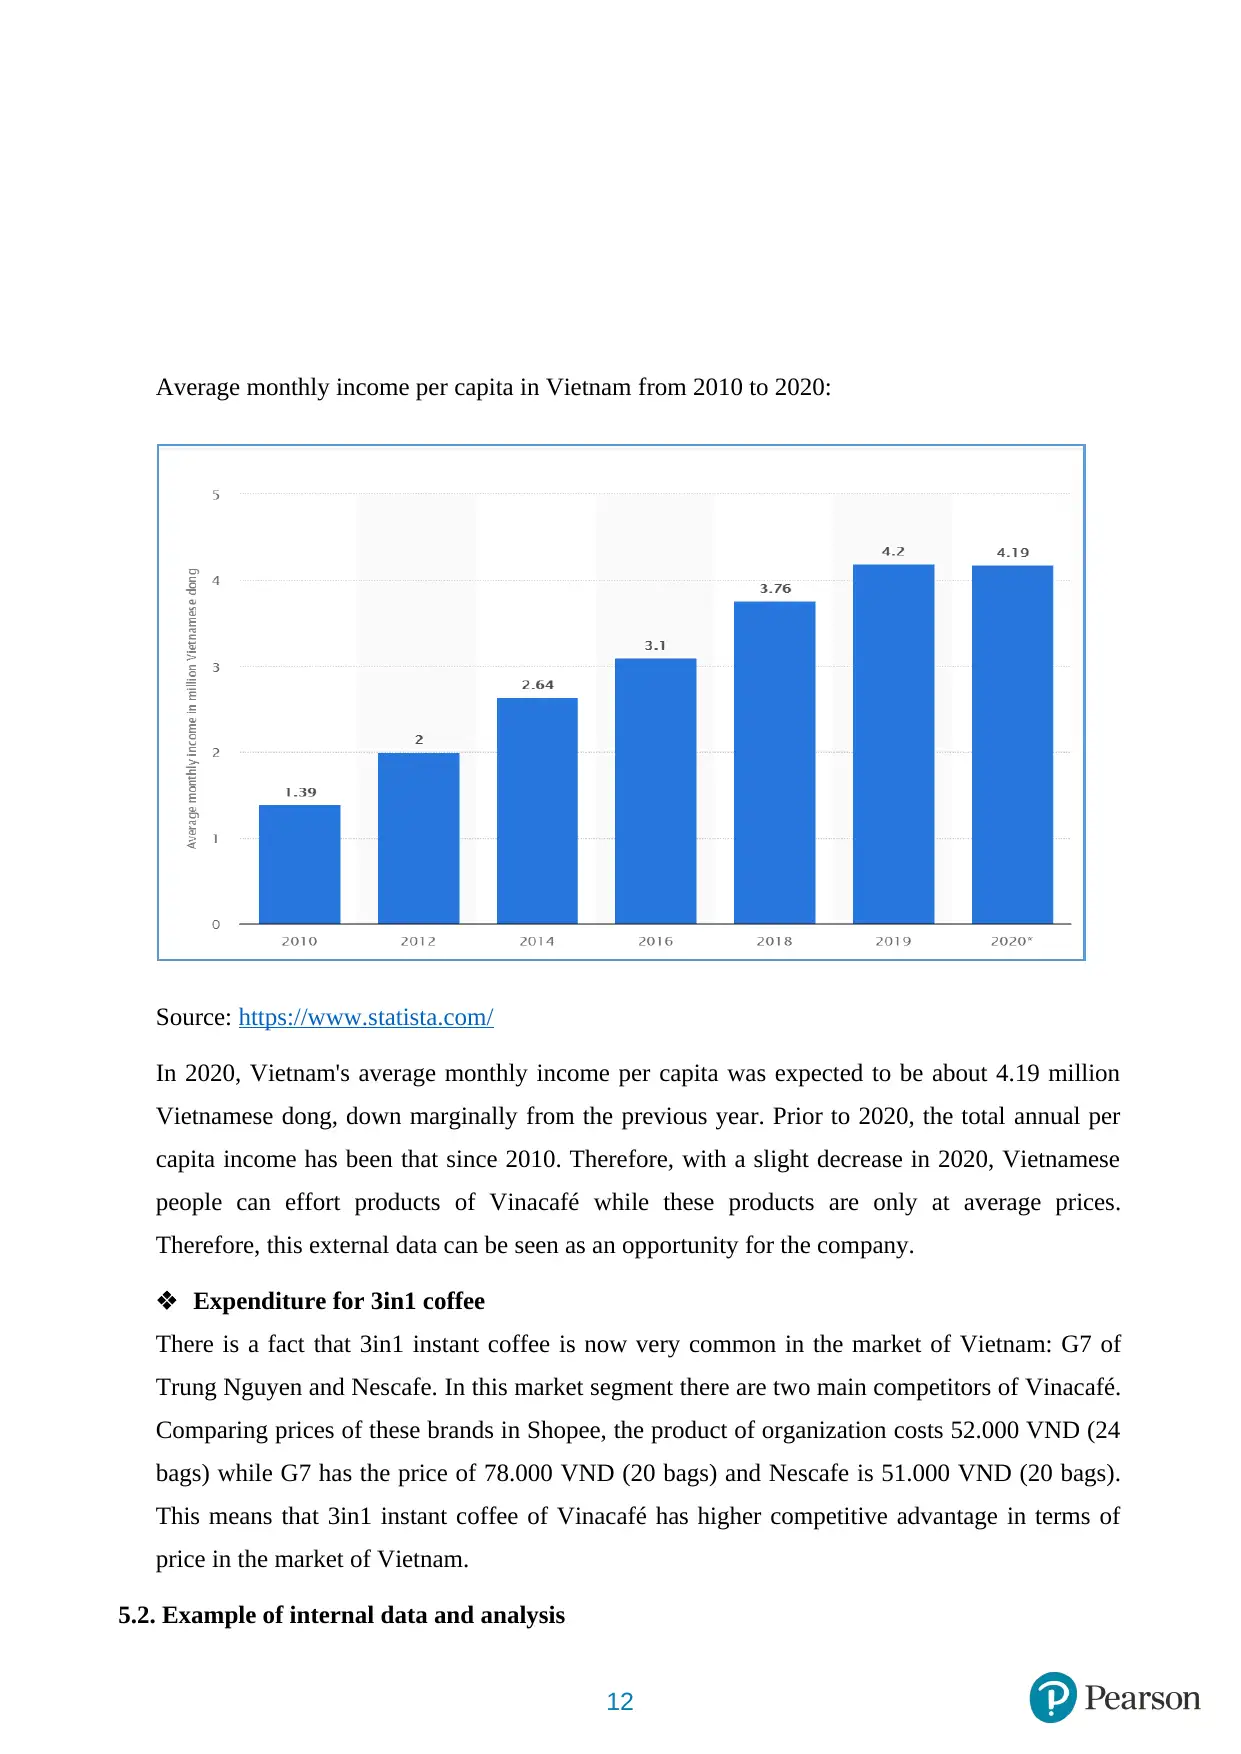
Average monthly income per capita in Vietnam from 2010 to 2020:
Source: https://www.statista.com/
In 2020, Vietnam's average monthly income per capita was expected to be about 4.19 million
Vietnamese dong, down marginally from the previous year. Prior to 2020, the total annual per
capita income has been that since 2010. Therefore, with a slight decrease in 2020, Vietnamese
people can effort products of Vinacafé while these products are only at average prices.
Therefore, this external data can be seen as an opportunity for the company.
Expenditure for 3in1 coffee
There is a fact that 3in1 instant coffee is now very common in the market of Vietnam: G7 of
Trung Nguyen and Nescafe. In this market segment there are two main competitors of Vinacafé.
Comparing prices of these brands in Shopee, the product of organization costs 52.000 VND (24
bags) while G7 has the price of 78.000 VND (20 bags) and Nescafe is 51.000 VND (20 bags).
This means that 3in1 instant coffee of Vinacafé has higher competitive advantage in terms of
price in the market of Vietnam.
5.2. Example of internal data and analysis
12
⊘ This is a preview!⊘
Do you want full access?
Subscribe today to unlock all pages.
Trusted by 1+ million students worldwide
1 out of 19

Your All-in-One AI-Powered Toolkit for Academic Success.
+13062052269
info@desklib.com
Available 24*7 on WhatsApp / Email
![[object Object]](/_next/static/media/star-bottom.7253800d.svg)
Unlock your academic potential
Copyright © 2020–2026 A2Z Services. All Rights Reserved. Developed and managed by ZUCOL.