Business Statistics: Data Analysis, Planning, and Communication
VerifiedAdded on 2024/04/26
|26
|4401
|483
Report
AI Summary
This report evaluates the use of statistical methods in analyzing business and economic data for effective business planning. It assesses data from various published sources using descriptive, inferential, and exploratory statistical methods. The report analyzes both qualitative and quantitative raw business data, including sales and customer retention, using measures of central tendency and correlation coefficients. It critically evaluates the differences between descriptive, inferential, exploratory, and confirmatory data analysis techniques. The application of statistical methods in business planning, specifically for quality, inventory (EOQ), and capacity management, is justified with organizational examples. The report concludes by emphasizing the importance of choosing appropriate charts and tables to communicate findings effectively. Desklib provides students access to this document along with numerous solved assignments and past papers.
Statistics for management
1
1
Paraphrase This Document
Need a fresh take? Get an instant paraphrase of this document with our AI Paraphraser
Contents
Introduction................................................................................................................................3
LO1 Evaluate business and economic data/ information obtained from published sources......4
P1 Evaluate the nature and process of business and economic data/ information from a
range of different published sources......................................................................................4
P2 Evaluate data from a variety of sources using different methods of analysis...................5
M1: Critically evaluate the methods of analysis used to present business and economic
data/ information from a range of different published sources..............................................6
LO2 Analyse and evaluate qualitative and quantitative raw business data from a range of
examples using appropriate statistical methods.........................................................................8
P3 Analyse and evaluate qualitative and quantitative raw business data from a range of
examples using appropriate statistical methods.....................................................................8
M2: evaluate the differences in application between descriptive statistics, inferential
statistics and measuring association.....................................................................................11
D1 Critically evaluates the differences in application between methods of descriptive,
exploratory and confirmatory analysis of business and economic data...............................12
LO3 Apply statistical methods in business planning...........................................................13
P4 Apply a range of statistical methods used in business planning for quality, inventory
and capacity management....................................................................................................13
M3 evaluate and justify the use of appropriate statistical methods supported by specific
organisational examples.......................................................................................................15
D2 Make valid recommendations and judgement for improving business planning through
the application of statistical methods...................................................................................22
LO4 Communicate findings using appropriate charts/ table....................................................23
P5 using appropriate charts/ tables communicate findings for a number of given variables
..............................................................................................................................................23
M4 Justify the rationale for choosing the method of communication.................................25
D3 Critically evaluate the use of different types of charts and tables for communicating
given variables.....................................................................................................................26
Conclusion................................................................................................................................27
References................................................................................................................................28
2
Introduction:
This assignment is prepared to understand the usefulness of statistical methods in defining
business and economic information. There are varied sources for collection of business
information such as business statistics information, publicised information. Over this
information, statistical analysis tools are applied for extracting some useful detailed
information. The techniques mostly used are exploratory technique, descriptive analysis, and
exploratory analysis. The assignment provides in-depth detail regarding statistical techniques
for effective and proper analysis of information. There is also analysis of the communicating
methods which are used by businesses to independently define their business figures.
3
⊘ This is a preview!⊘
Do you want full access?
Subscribe today to unlock all pages.
Trusted by 1+ million students worldwide
LO1 Evaluate business and economic data/ information obtained from published
sources:
P1 Evaluate the nature and process of business and economic data/ information from a
range of different published sources
Nature: Business and economic data are the numerical data of the economic process which is
used for further economic statistics. Economic statistics contains a number of the
phenomenon for development of concepts and classifications which are useful for
understanding economic state. The business and economic data which are interpreted through
economic statistics defines economic behavior, economic movements, economic policies and
economic business decisions. The knowledge of business and economic data are extracted
through a number of sources which are available economy facts and figures which are
developed through in the ICT (Information and communication technologies) (George, et. al.,
2014).
Process: business or economic data process can be understood as a mechanism which
consists of entire channels from extraction to production to the utilization of available
resources for ultimate human consumption. The process defines the total process of
converting raw material into final product (George, et. al., 2014).
4
Paraphrase This Document
Need a fresh take? Get an instant paraphrase of this document with our AI Paraphraser
P2 Evaluate data from a variety of sources using different methods of analysis
The business/ economic data which can are used for making propositions and analysis are
taken from mainly from two sources namely internal and external source. An organization
can internally get information about its business trends and business financial information
such as revenues, costs, and profitability and thus, the data is mainly quantitative. Also, the
data can be extracted from external sources which mainly relates to the wider perspective and
are associated with sectors like political, economic, social, technological and competitive
information. For instance: if a Volkswagen needs to know the economic possibility of sales
in near future, it would need to collect and interpret the social data (for knowing the trend).
The data can be further classified into primary data and secondary data (Peirson, et. al.,
2014).
The different kinds of data are collected through a number of sources such as published
statistics by a number of agencies, formal/ informal interviews conducted at a different
interval of time, self/ team investigation regarding a subject, and through questionnaire
technique (Peirson, et. al., 2014).
Published statistics: various organizations such as an office for national statistics, Eurostat,
newspaper authorities like financial times etc. publish data. The data can be further
implemented through statistical tools and techniques and interpretation can be made (Peirson,
et. al., 2014).
Formal/ informal interviews: Interviews are done for developing and extracting new data/
information.
Self-investigation: Self-investigation can also be done through questionnaire technique
which is to formulate and interpret the result (Peirson, et. al., 2014).
5
M1: Critically evaluate the methods of analysis used to present business and economic
data/ information from a range of different published sources
The varied methods of analysis are descriptive statistical analysis, confirmatory data analysis,
and exploratory data analysis.
The descriptive statistical analysis is a method which includes series of actions like
collection, summarization, and interpretation of financial data/ information through charts
and tables. This explanation is restricted to the sample part and might or might not apply to
the entire population. Though, it quite useful as it presents the raw data into meaningful
information. The main tools of descriptive analysis are measures of central tendency and
measures of spread. The former is used for describing the central position for a data while the
latter describes the spread of data (Collis, and Hussey, 2013).
Confirmatory data analysis technique is useful for making interpretation through the
establishment of facts, hypothesis and implementing traditional tools like inference,
confidence, and inference, also through precision, variance, and regression. It is quite useful
as this technique makes use of findings for trial test and use tools like regression analysis,
variance analysis, hypothesis tests etc. It also has certain limitations such as it makes focus
only on hypothesis and its analysis is also restricted to that point (Collis, and Hussey, 2013).
Exploratory data analysis is a different segment. It makes use of presumptions, assumptions
and another hypothesis. It applies tools like quantitative tools and visuals/ graphic tools for
presenting the data. It also establishes uses confidence interval and margin of error
techniques (Collis, and Hussey, 2013).
6
⊘ This is a preview!⊘
Do you want full access?
Subscribe today to unlock all pages.
Trusted by 1+ million students worldwide
LO2 Analyse and evaluate qualitative and quantitative raw business data from a range
of examples using appropriate statistical methods.
Introduction:
This report presents usefulness of the business economic data and implementation of
statistical methods for analyzing the data and inferring data. Being a business data analyst,
the qualitative and quantitative raw data has been converted. The quantitative data includes
sales and net income and the tools applied are measures of central tendency.
P3 Analyse and evaluate qualitative and quantitative raw business data from a range of
examples using appropriate statistical methods.
There are mainly two types of data namely quantitative data and qualitative data. Qualitative
data can be understood as the data which cannot be measured numerically but can be tested
through the implementation of hypothesis and assumptions. Quantitative data can be
presented as the data which can be measured numerically and also can be mathematically
solved (Houghton, 2013).
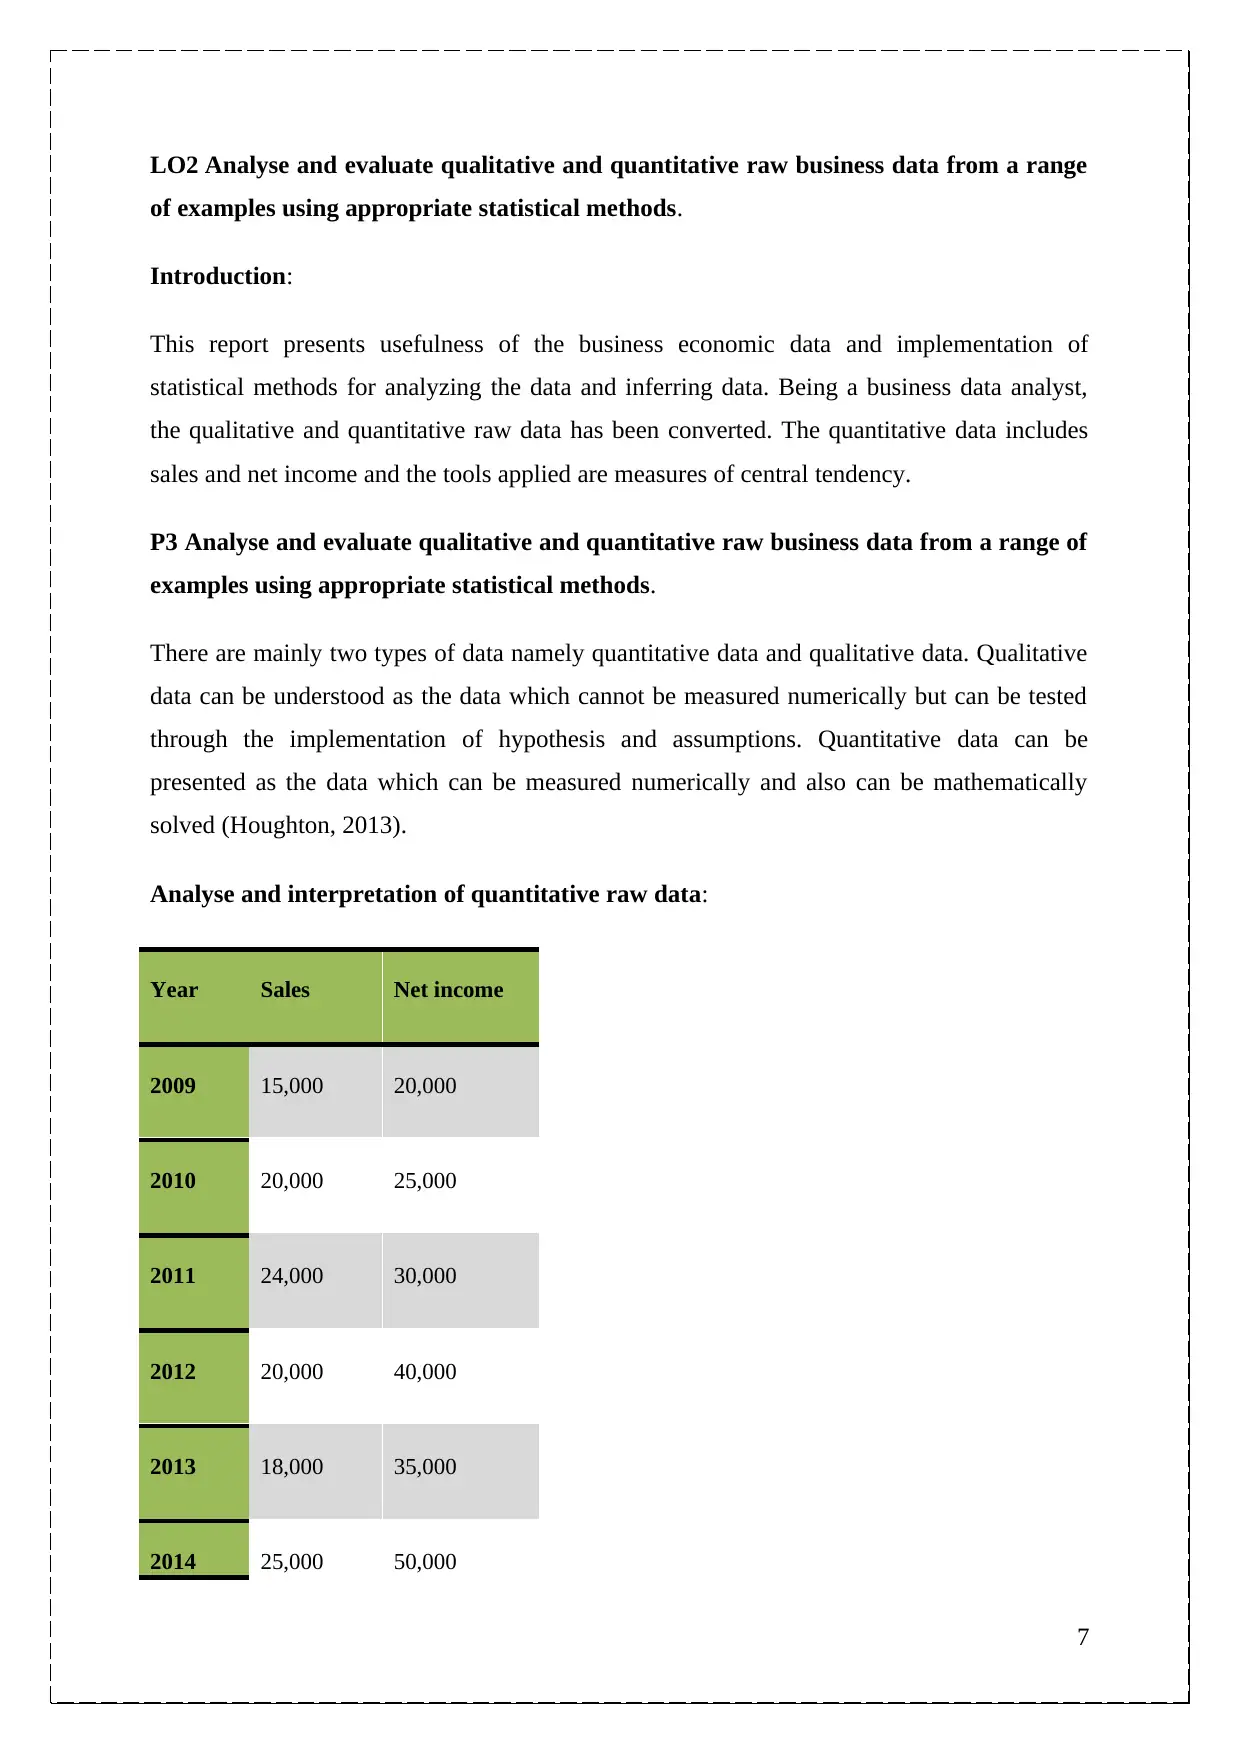
Analyse and interpretation of quantitative raw data:
Year Sales Net income
2009 15,000 20,000
2010 20,000 25,000
2011 24,000 30,000
2012 20,000 40,000
2013 18,000 35,000
2014 25,000 50,000
7
of examples using appropriate statistical methods.
Introduction:
This report presents usefulness of the business economic data and implementation of
statistical methods for analyzing the data and inferring data. Being a business data analyst,
the qualitative and quantitative raw data has been converted. The quantitative data includes
sales and net income and the tools applied are measures of central tendency.
P3 Analyse and evaluate qualitative and quantitative raw business data from a range of
examples using appropriate statistical methods.
There are mainly two types of data namely quantitative data and qualitative data. Qualitative
data can be understood as the data which cannot be measured numerically but can be tested
through the implementation of hypothesis and assumptions. Quantitative data can be
presented as the data which can be measured numerically and also can be mathematically
solved (Houghton, 2013).
Analyse and interpretation of quantitative raw data:
Year Sales Net income
2009 15,000 20,000
2010 20,000 25,000
2011 24,000 30,000
2012 20,000 40,000
2013 18,000 35,000
2014 25,000 50,000
7
Paraphrase This Document
Need a fresh take? Get an instant paraphrase of this document with our AI Paraphraser
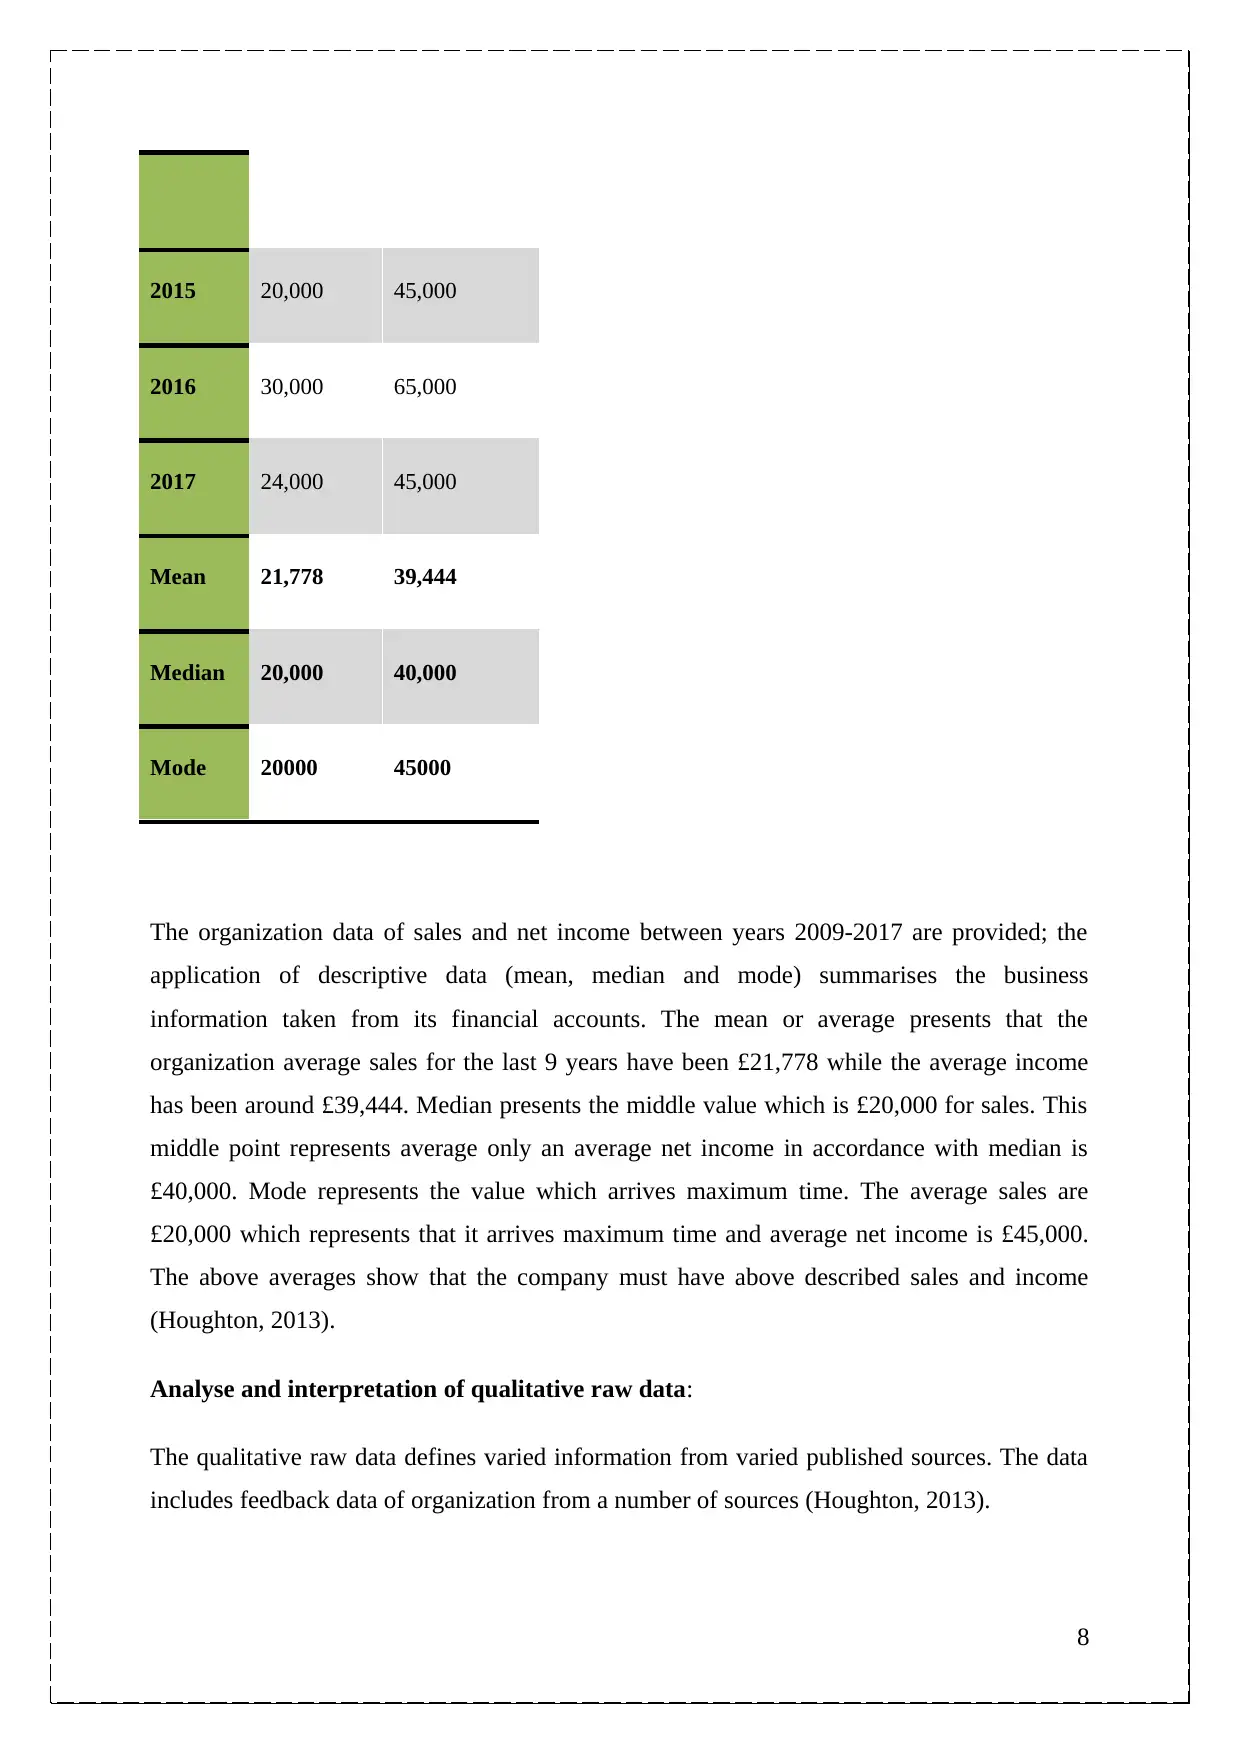
2015 20,000 45,000
2016 30,000 65,000
2017 24,000 45,000
Mean 21,778 39,444
Median 20,000 40,000
Mode 20000 45000
The organization data of sales and net income between years 2009-2017 are provided; the
application of descriptive data (mean, median and mode) summarises the business
information taken from its financial accounts. The mean or average presents that the
organization average sales for the last 9 years have been £21,778 while the average income
has been around £39,444. Median presents the middle value which is £20,000 for sales. This
middle point represents average only an average net income in accordance with median is
£40,000. Mode represents the value which arrives maximum time. The average sales are
£20,000 which represents that it arrives maximum time and average net income is £45,000.
The above averages show that the company must have above described sales and income
(Houghton, 2013).
Analyse and interpretation of qualitative raw data:
The qualitative raw data defines varied information from varied published sources. The data
includes feedback data of organization from a number of sources (Houghton, 2013).
8
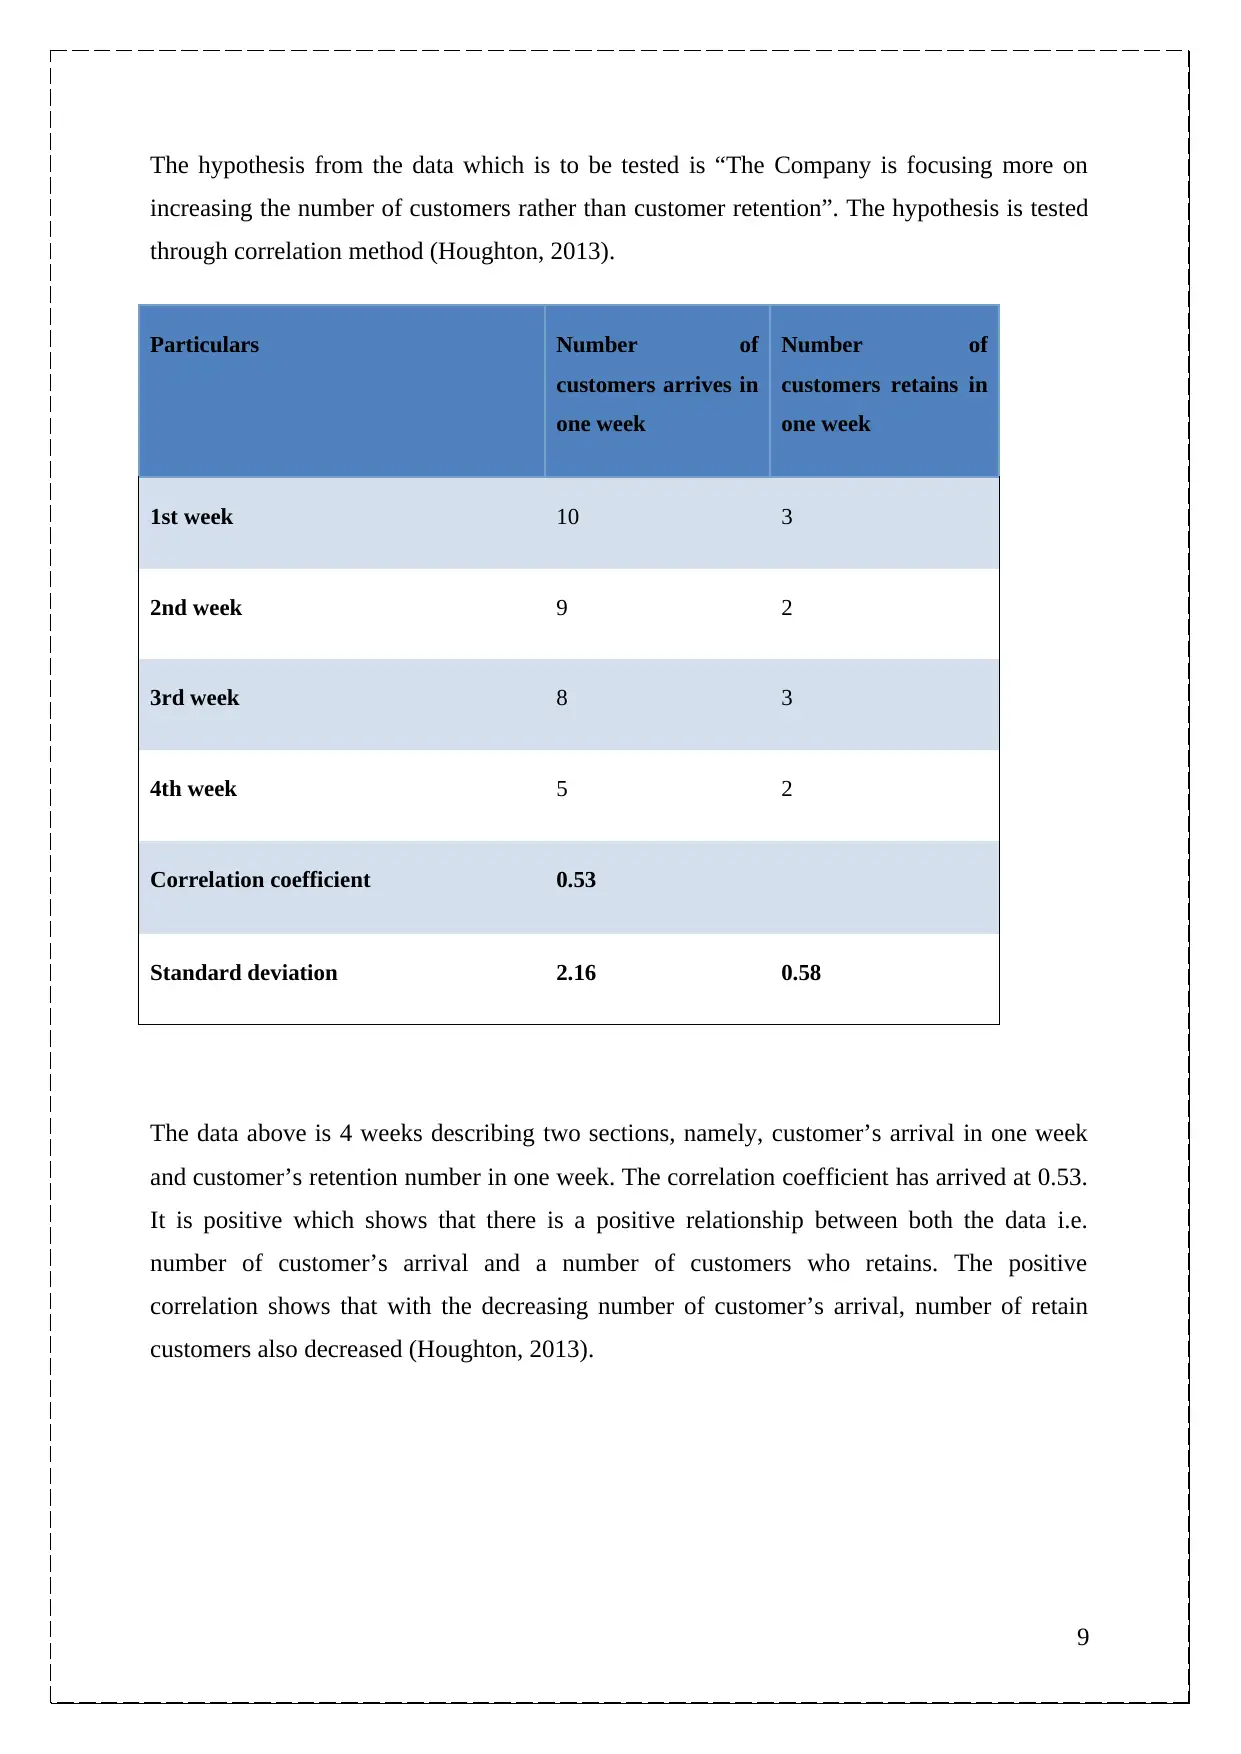
The hypothesis from the data which is to be tested is “The Company is focusing more on
increasing the number of customers rather than customer retention”. The hypothesis is tested
through correlation method (Houghton, 2013).
Particulars Number of
customers arrives in
one week
Number of
customers retains in
one week
1st week 10 3
2nd week 9 2
3rd week 8 3
4th week 5 2
Correlation coefficient 0.53
Standard deviation 2.16 0.58
The data above is 4 weeks describing two sections, namely, customer’s arrival in one week
and customer’s retention number in one week. The correlation coefficient has arrived at 0.53.
It is positive which shows that there is a positive relationship between both the data i.e.
number of customer’s arrival and a number of customers who retains. The positive
correlation shows that with the decreasing number of customer’s arrival, number of retain
customers also decreased (Houghton, 2013).
9
⊘ This is a preview!⊘
Do you want full access?
Subscribe today to unlock all pages.
Trusted by 1+ million students worldwide
M2: evaluate the differences in application between descriptive statistics, inferential
statistics and measuring association.
Differences in the application of descriptive and inferential statistics:
Descriptive statistics: This segment of statistics mainly uses the procedure of collecting,
summarising and presenting the data. It describes characteristics of a data and it mainly deals
with evaluating the frequency, distribution, and spread of a given sample. The main tools of
descriptive statistics are mean, median, and mode. All these tools deal with a given sample
and present a conclusion for the sample data only. Lastly, it can be analyzed that it deals with
summarising and presenting the data (Wildemuth, 2016).
Descriptive statistics describe the data through summarization and classification of data. It
analyses the data through classification and further implementation of varied measures such
as mean, median, and mode. These techniques are implemented over the data and frequency
and spread are measured. This technique is very popular and quite useful in case of analyzing
a sample from a given set of population’s data. It provides an average figure for analyzing the
sample and making a conclusion for the entire population (Wildemuth, 2016).
Inferential statistics: In this statistical tool, the sample data is analyzed for hypothesis
testing, formulating predictions and extracting inferences from the existing data. This
segment is used when a data has to be inferred and analyzed.
Inferential statistics is mainly used for establishing a relationship between two or more
variables. It sets out certain hypothesis and tests it accordingly. This statistics is quite useful
in describing the relationship between variables (Wildemuth, 2016).
Exploratory statistics: It is implemented to ascertain or development of relationship among
different variables through setting varied variables. This statistics is useful in terms of stating
relationship through different patterns (Wildemuth, 2016).
Conclusion:
From this report, it can be concluded that the different set of statistics such as descriptive,
exploratory and inferential statistics. Different statistics segments are used at the
implementation of statistical tools and define varied statistics patterns.
10
Paraphrase This Document
Need a fresh take? Get an instant paraphrase of this document with our AI Paraphraser
D1 Critically evaluates the differences in application between methods of descriptive,
exploratory and confirmatory analysis of business and economic data.
The three statistical methods namely descriptive, exploratory and confirmatory are quite
different from each other.
Descriptive is the most common and simplest to apply to a range of data. This method mainly
applies to a selected sample extracted from a sample. Its major tools are measures of central
tendency and measures of spread. These tools provide central and deviation point from
average and it provides the simplest interpretation of data which can shorten a large set of
population and also advice for future decision making (Jackson, 2015).
On the other hand, confirmatory data analysis is a tool in which researcher makes their
findings and put their arguments for testing. It uses hypothesis for evaluation and
interpretation. It uses tools like variance analysis, regression analysis etc. The difference lies
that the descriptive is restricted to interpretation of sample (and the population) while the
confirmatory restricts the research to its assumption and argument put over testing and trial.
Exploratory analysis is on another hand, puts up few assumptions and further works for
formation of hypothesis and assumptions and it uses tools like visual tools, quantitative
methods such as of descriptive tools only. But since it is a statistical thinking, it might not
provide accurate answers (Jackson, 2015).
11
LO3 Apply statistical methods in business planning
P4 Apply a range of statistical methods used in business planning for quality, inventory
and capacity management
The different range of statistical methods which are to be applied to the business planning
including inventory and capacity management, quality management are as follows:
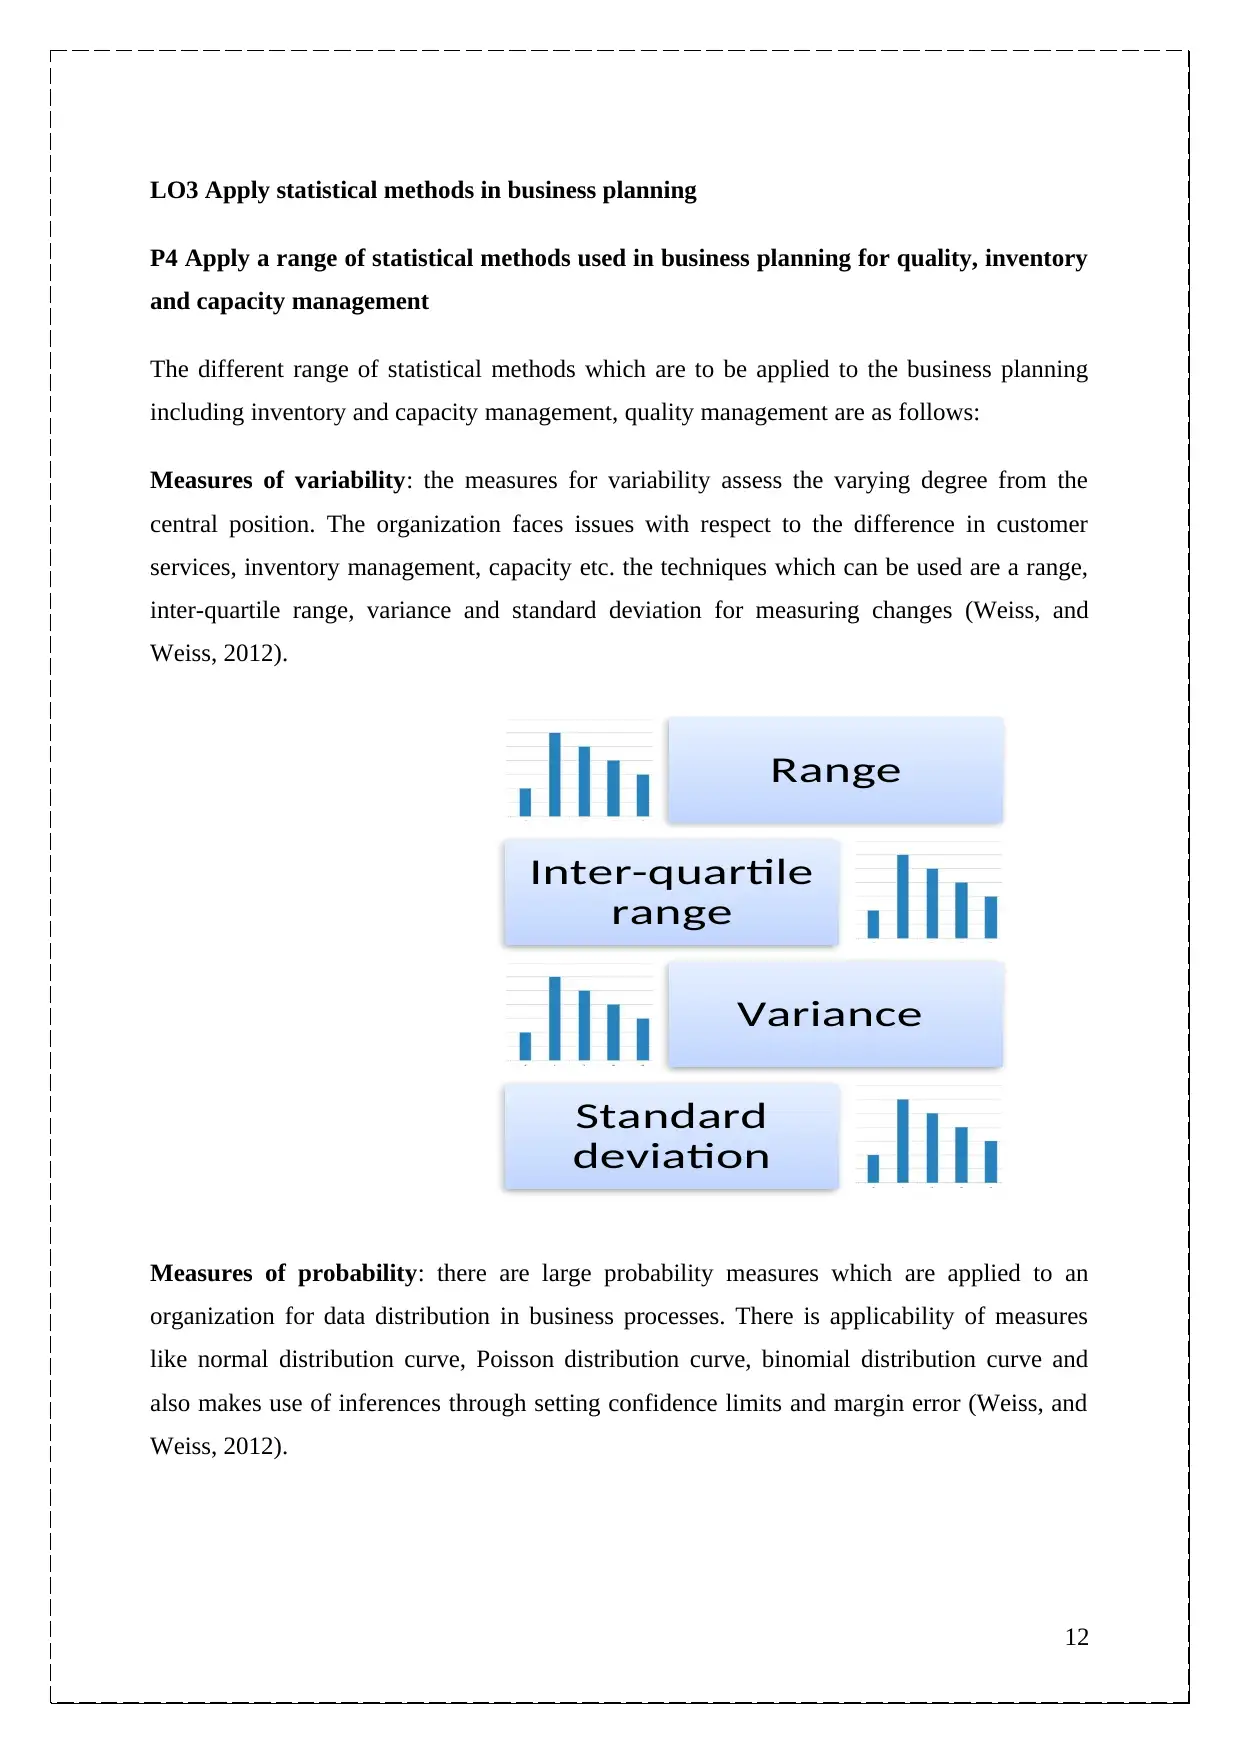
Measures of variability: the measures for variability assess the varying degree from the
central position. The organization faces issues with respect to the difference in customer
services, inventory management, capacity etc. the techniques which can be used are a range,
inter-quartile range, variance and standard deviation for measuring changes (Weiss, and
Weiss, 2012).
Measures of probability: there are large probability measures which are applied to an
organization for data distribution in business processes. There is applicability of measures
like normal distribution curve, Poisson distribution curve, binomial distribution curve and
also makes use of inferences through setting confidence limits and margin error (Weiss, and
Weiss, 2012).
12
Range
Inter-quartile
range
Variance
Standard
deviation
P4 Apply a range of statistical methods used in business planning for quality, inventory
and capacity management
The different range of statistical methods which are to be applied to the business planning
including inventory and capacity management, quality management are as follows:
Measures of variability: the measures for variability assess the varying degree from the
central position. The organization faces issues with respect to the difference in customer
services, inventory management, capacity etc. the techniques which can be used are a range,
inter-quartile range, variance and standard deviation for measuring changes (Weiss, and
Weiss, 2012).
Measures of probability: there are large probability measures which are applied to an
organization for data distribution in business processes. There is applicability of measures
like normal distribution curve, Poisson distribution curve, binomial distribution curve and
also makes use of inferences through setting confidence limits and margin error (Weiss, and
Weiss, 2012).
12
Range
Inter-quartile
range
Variance
Standard
deviation
⊘ This is a preview!⊘
Do you want full access?
Subscribe today to unlock all pages.
Trusted by 1+ million students worldwide
1 out of 26
Related Documents


Your All-in-One AI-Powered Toolkit for Academic Success.
+13062052269
info@desklib.com
Available 24*7 on WhatsApp / Email
![[object Object]](/_next/static/media/star-bottom.7253800d.svg)
Unlock your academic potential
Copyright © 2020–2026 A2Z Services. All Rights Reserved. Developed and managed by ZUCOL.