Statistical Modelling Assignment 2016/17 - ACES Module
VerifiedAdded on 2019/09/16
|8
|1927
|580
Homework Assignment
AI Summary
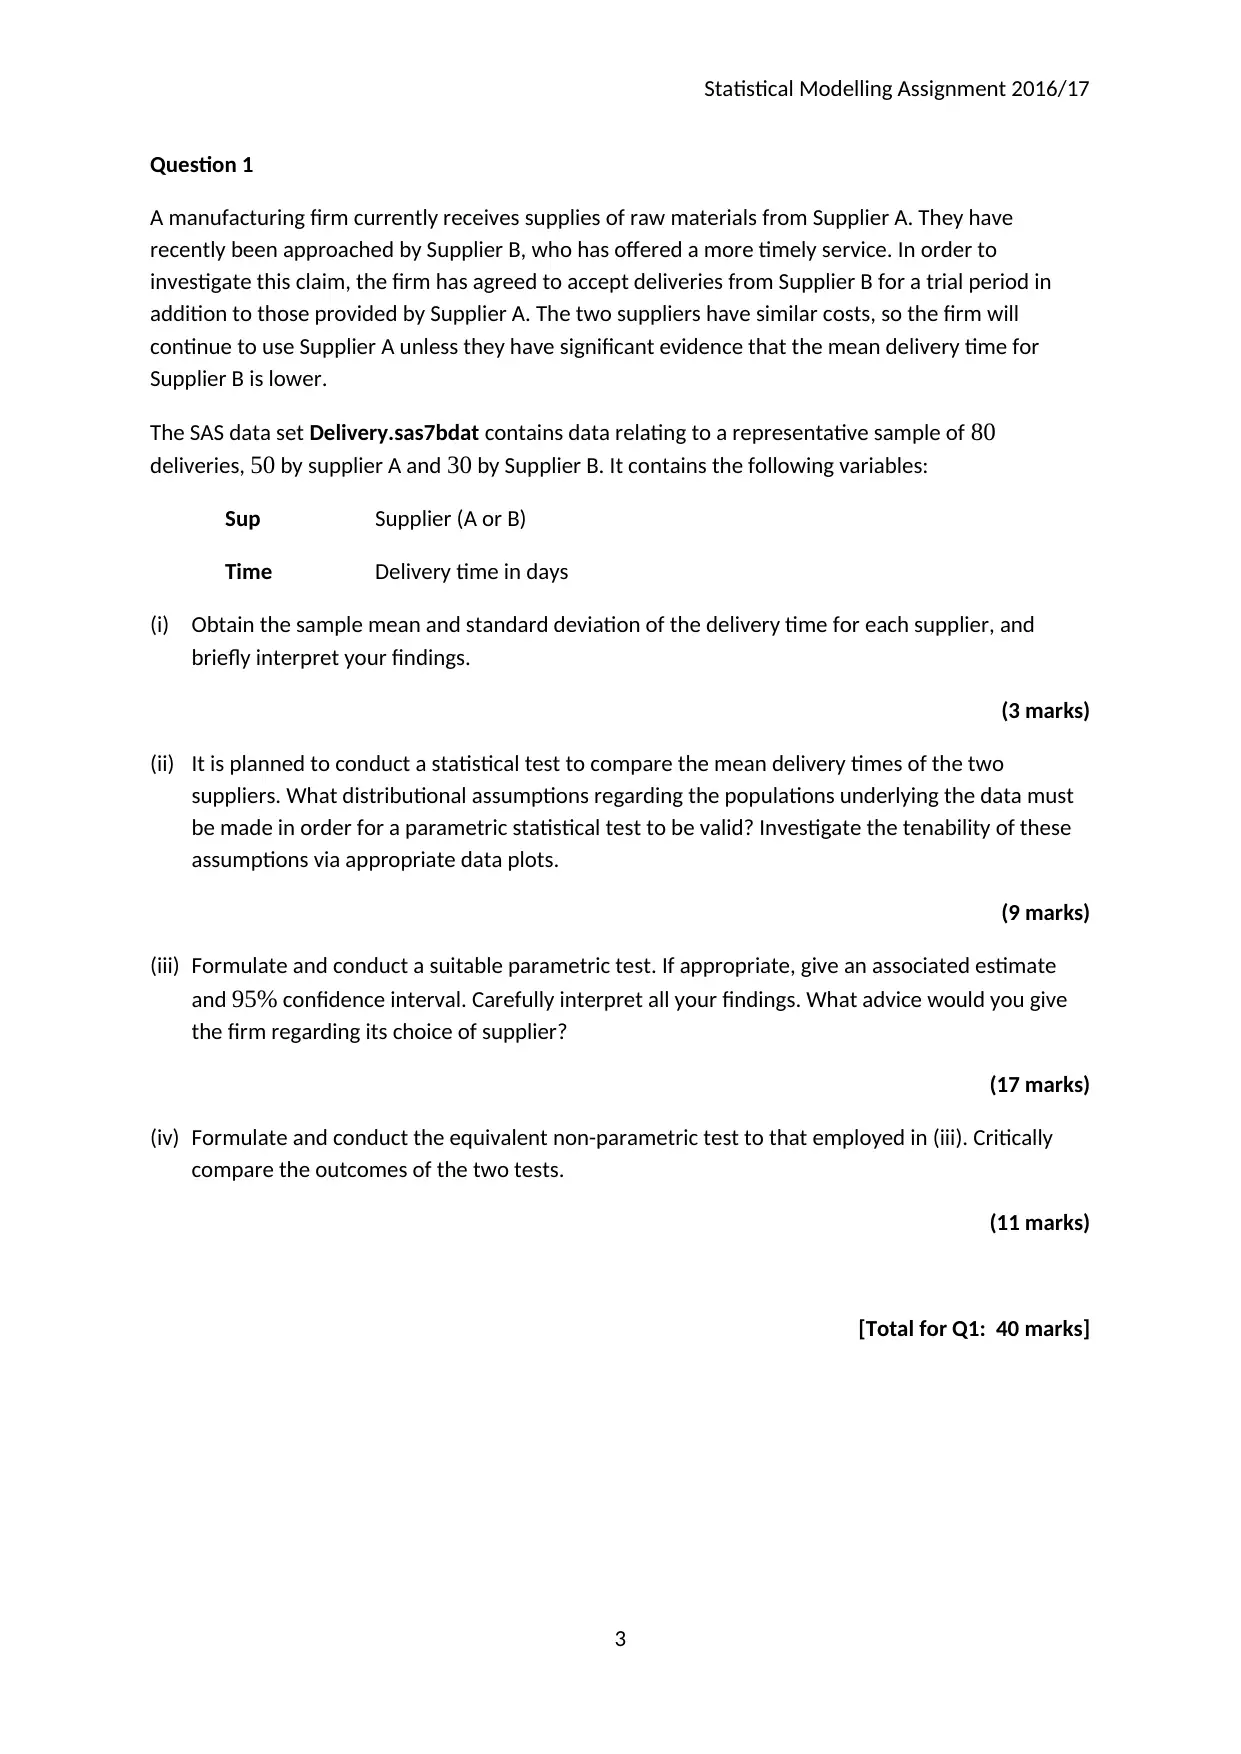
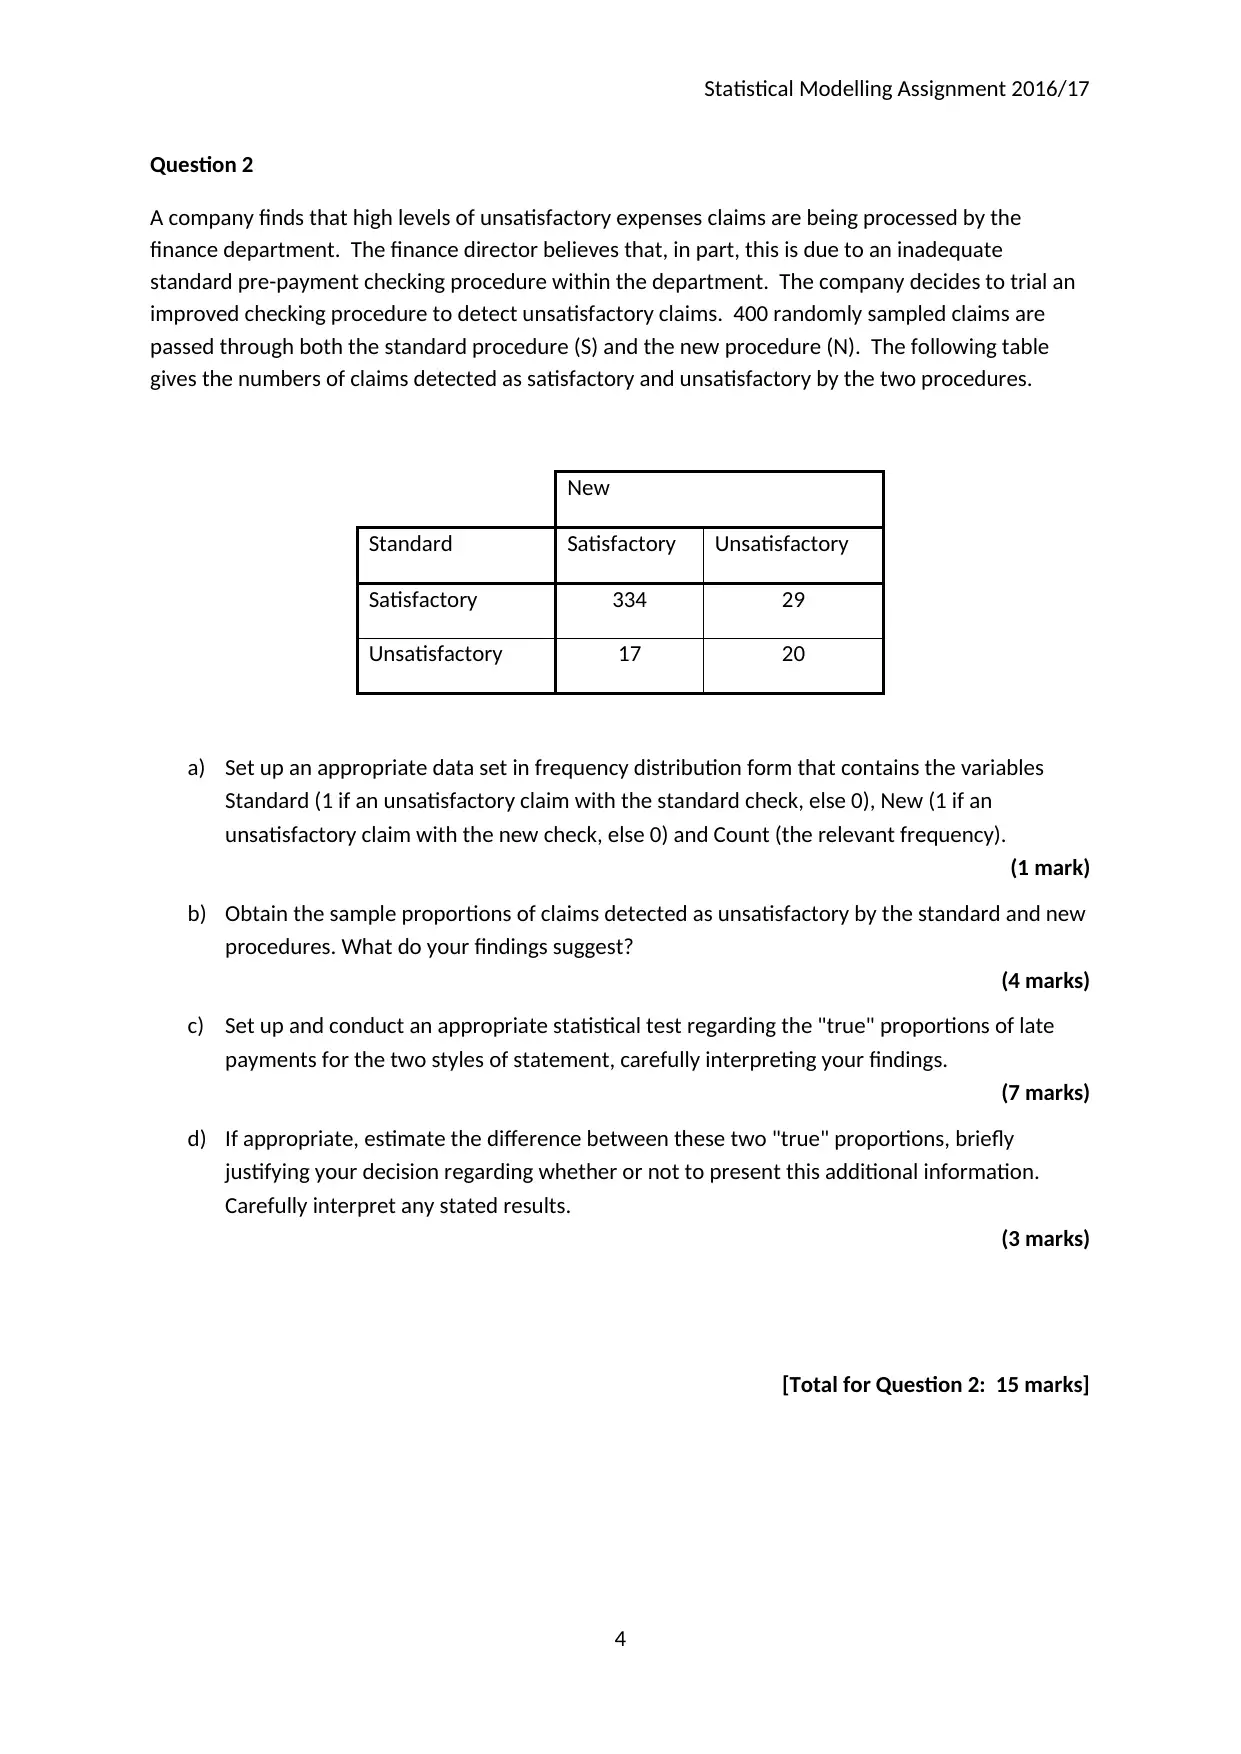
This document presents a comprehensive solution to a statistical modelling assignment. It addresses four key questions, covering various statistical techniques and their applications. The first question focuses on comparing delivery times from two suppliers using descriptive statistics, distributional assumptions, parametric and non-parametric tests. Question 2 involves analyzing unsatisfactory expense claims using frequency distributions and statistical tests to compare proportions. Question 3 delves into multiple regression modeling, including multicollinearity analysis, stepwise and backward elimination procedures, model selection using R-squared, diagnostic analyses, and identification of influential observations. Finally, question 4 explores bivariate regression models, model adequacy, and the interpretation of results, including the use of logarithmic transformations and confidence intervals to estimate turnover. The assignment emphasizes clear explanation, practical interpretation, and critical evaluation of the analyses.

Statistical Modelling Assignment 2016/17
Arts, Computing, Engineering and Sciences
Statistical Modelling
2016-17 academic year
1
Arts, Computing, Engineering and Sciences
Statistical Modelling
2016-17 academic year
1
Paraphrase This Document
Need a fresh take? Get an instant paraphrase of this document with our AI Paraphraser

Statistical Modelling Assignment 2016/17
Instructions
1. Attempt all FOUR questions.
2. Question 1 carries 40 marks, Question 2 carries 15 marks, Question 3 carries 90 marks and
Question 4 carries 40 marks. There are 15 marks for presentation. A breakdown of marks is
given for each question.
3. Your assignment should be submitted through Blackboard
4. You should include in your answers any figures or tables relating directly to the issues under
discussion. These should be copied and pasted into your answers at the appropriate point.
Any further figures or tables, and all relevant SAS or other program code, should be
presented in an appendix at the end of the particular question it relates to, which in turn
should be clearly referenced in your answers.
5. Considerable credit will be given for clear explanation, for practical and meaningful
interpretation of your statistical analyses, and for balanced, critical comment.
6. The final mark for this assignment will be expressed as a percentage of the total available
mark of 200. It contributes 100% of the total mark for this Module.
Learning Outcomes
This assignment assesses the following learning outcomes:
Apply and justify a range of statistical techniques, including regression modelling, hypothesis
testing to the extraction of business information from data.
Critically evaluate the validity of the techniques and models employed with respect to the
relevant data and also to their intended use.
Interpret the intelligence provided in a practical business setting.
Effectively communicate the relevant methodology and its results to a decision maker.
2

Statistical Modelling Assignment 2016/17
Question 1
A manufacturing firm currently receives supplies of raw materials from Supplier A. They have
recently been approached by Supplier B, who has offered a more timely service. In order to
investigate this claim, the firm has agreed to accept deliveries from Supplier B for a trial period in
addition to those provided by Supplier A. The two suppliers have similar costs, so the firm will
continue to use Supplier A unless they have significant evidence that the mean delivery time for
Supplier B is lower.
The SAS data set Delivery.sas7bdat contains data relating to a representative sample of 80
deliveries, 50 by supplier A and 30 by Supplier B. It contains the following variables:
Sup Supplier (A or B)
Time Delivery time in days
(i) Obtain the sample mean and standard deviation of the delivery time for each supplier, and
briefly interpret your findings.
(3 marks)
(ii) It is planned to conduct a statistical test to compare the mean delivery times of the two
suppliers. What distributional assumptions regarding the populations underlying the data must
be made in order for a parametric statistical test to be valid? Investigate the tenability of these
assumptions via appropriate data plots.
(9 marks)
(iii) Formulate and conduct a suitable parametric test. If appropriate, give an associated estimate
and 95% confidence interval. Carefully interpret all your findings. What advice would you give
the firm regarding its choice of supplier?
(17 marks)
(iv) Formulate and conduct the equivalent non-parametric test to that employed in (iii). Critically
compare the outcomes of the two tests.
(11 marks)
[Total for Q1: 40 marks]
3
⊘ This is a preview!⊘
Do you want full access?
Subscribe today to unlock all pages.

Trusted by 1+ million students worldwide

Statistical Modelling Assignment 2016/17
Question 2
A company finds that high levels of unsatisfactory expenses claims are being processed by the
finance department. The finance director believes that, in part, this is due to an inadequate
standard pre-payment checking procedure within the department. The company decides to trial an
improved checking procedure to detect unsatisfactory claims. 400 randomly sampled claims are
passed through both the standard procedure (S) and the new procedure (N). The following table
gives the numbers of claims detected as satisfactory and unsatisfactory by the two procedures.
New
Standard Satisfactory Unsatisfactory
Satisfactory 334 29
Unsatisfactory 17 20
a) Set up an appropriate data set in frequency distribution form that contains the variables
Standard (1 if an unsatisfactory claim with the standard check, else 0), New (1 if an
unsatisfactory claim with the new check, else 0) and Count (the relevant frequency).
(1 mark)
b) Obtain the sample proportions of claims detected as unsatisfactory by the standard and new
procedures. What do your findings suggest?
(4 marks)
c) Set up and conduct an appropriate statistical test regarding the "true" proportions of late
payments for the two styles of statement, carefully interpreting your findings.
(7 marks)
d) If appropriate, estimate the difference between these two "true" proportions, briefly
justifying your decision regarding whether or not to present this additional information.
Carefully interpret any stated results.
(3 marks)
[Total for Question 2: 15 marks]
4
Paraphrase This Document
Need a fresh take? Get an instant paraphrase of this document with our AI Paraphraser

Statistical Modelling Assignment 2016/17
Question 3
These data are from a U.S. sample of 6000 households with a male head earning less than $15,000
annually in 1966. The data were classified into 39 demographic groups for analysis. The study was
undertaken in the context of proposals for a guaranteed annual wage (negative income tax). At issue
was the response of labour supply (average hours) to increasing hourly wages. The study was
undertaken to estimate this response from available data
The relevant data comprise 39 observations of the following variables:
HRS: Average hours worked during the year
WAGE: Average hourly wage ($)
ERSP: Average yearly earnings of spouse ($)
ERNO: Average yearly earnings of other family members ($)
NEIN: Average yearly non-earned income
ASSET: Average family asset holdings (Bank account, etc.) ($)
AGE: Average age of respondent
DEP: Average number of dependents
SCHOOL: Average highest grade of school completed
These data may be found in the permanent SAS data set earnings.sas7bdat.
a) Produce suitable plots of HRS against each of the explanatory variables and discuss the
suitability of these data for regression.
(10 marks)
b) Fully investigate and discuss any issues of multicollinearity between the eight potential
explanatory variables listed above.
(13 marks)
c) Fit appropriate multiple regression models to these data using both stepwise and backward
elimination procedures, in each case using an associated significance level of 5%. For each
procedure, state and briefly justify the decision taken at each step, and identify the explanatory
variables present in the final reduced model.
Briefly discuss the composition of the final models obtained with these two different approaches
in the light of the collinearity analysis conducted in part (a).
(17 marks)
5

Statistical Modelling Assignment 2016/17
d) Further investigate model selection using the R2 and adjusted R2 for comparing all possible
models. Comment specifically on the two reduced models identified in part (c) above.
Hence, using the data alone, choose a final, reduced model, justifying your choice. State the
equation of the fitted model. What other information or knowledge might have helped to inform
your model choice?
(15 marks)
e) Investigate the validity of the model obtained using stepwise selection in part (c) by undertaking
diagnostic analyses involving fitted values and studentised/deleted residuals. Carefully interpret
the ensuing plots.
(15 marks)
f) Considering again the model obtained by stepwise selection, identify any potential influential
observations; you should create a new variable ID to enable you to specify each such
observation. Further investigate the TWO most extreme of these observations with respect to
their effect on the model as a whole by considering the corresponding values of the leverage H,
the deleted residual, the covariance ratio C and the DFBETAS.
(20 marks)
[Total for Question 3: 90 marks]
6
⊘ This is a preview!⊘
Do you want full access?
Subscribe today to unlock all pages.

Trusted by 1+ million students worldwide

Statistical Modelling Assignment 2016/17
Question 4
Skywalkers is a new coffee shop franchise. Typically, when a new shop is opened, turnover is
initially low, but builds over time. Of particular business interest is how turnover behaves over
the first year of opening. In order to investigate this, the most recent month’s turnover was
obtained for a sample of thirty-six shops, three of each of twelve “ages” ranging from 1 month
to 12 months.
The SAS data set Coffee.sas7bdat contains the resulting data, and comprises the following
variables:
Age age of the shop (i.e. time since opening) in months (1, 2, …, 12)
Turn most recent month’s turnover (£)
LogAge the natural logarithm of Age
LogTurn the natural logarithm of Turn
(a) Fit the bivariate regression model of Turn on Age. Obtain:
a scatterplot of Turn against Age with the fitted regression line superimposed
a plot of studentised residuals against fitted values
Critically discuss these two plots and draw appropriate conclusions regarding the adequacy
of the systematic component of the fitted model.
(10 marks)
(b) Now fit the bivariate regression model of LogTurn on LogAge. Obtain
A scatterplot of LogTurn against LogAge with the fitted regression line superimposed
A plot of studentised residuals from this regression against the corresponding fitted
values
A histogram of the studentised residuals
A normal probability plot of the studentised residuals
Carefully explaining your methodology, investigate the adequacy of the new fitted
regression model. State with reasons whether or not you would recommend this model or
that fitted in part (a).
(20 marks)
(c) Write down the fitted model obtained in (b) above and explain how it can be used to
estimate the value of a new coffee shop’s most recent monthly turnover from its current
age in months. Comment on the value of the estimated slope in this model.
7
Paraphrase This Document
Need a fresh take? Get an instant paraphrase of this document with our AI Paraphraser

Statistical Modelling Assignment 2016/17
Use this model to estimate the mean value of LogTurn for a shop that has been open for
three months and to obtain an associated 95% confidence interval.
Hence estimate the corresponding mean value of the most recent monthly turnover for a
shop of this age, giving a 95% confidence interval for this mean turnover.
(10 marks)
[Total for Q4: 40 marks]
Presentation
Your submission should be written in an appropriate style. Only output that is required to
support your discussion should be included. Any further output can be included in an
Appendix and should not be included in your word count. Although your SAS skills do count,
most of the marks will be for your discussion of the results and the process of your decision
making. Make sure you only answer the questions as that is all I can give marks for. There is
a word limit of 4000. Ideally it should be less. Remember Headings, Table and Figure labels
are not included in the word count.
(15 marks)
8
1 out of 8
Related Documents
Your All-in-One AI-Powered Toolkit for Academic Success.
+13062052269
info@desklib.com
Available 24*7 on WhatsApp / Email
Unlock your academic potential
Copyright © 2020–2025 A2Z Services. All Rights Reserved. Developed and managed by ZUCOL.


