Statistical Analysis of NSW Transport System: BUS708 Assignment

Verified

Added on  2023/06/04

|7
|1305
|387
Report
AI Summary
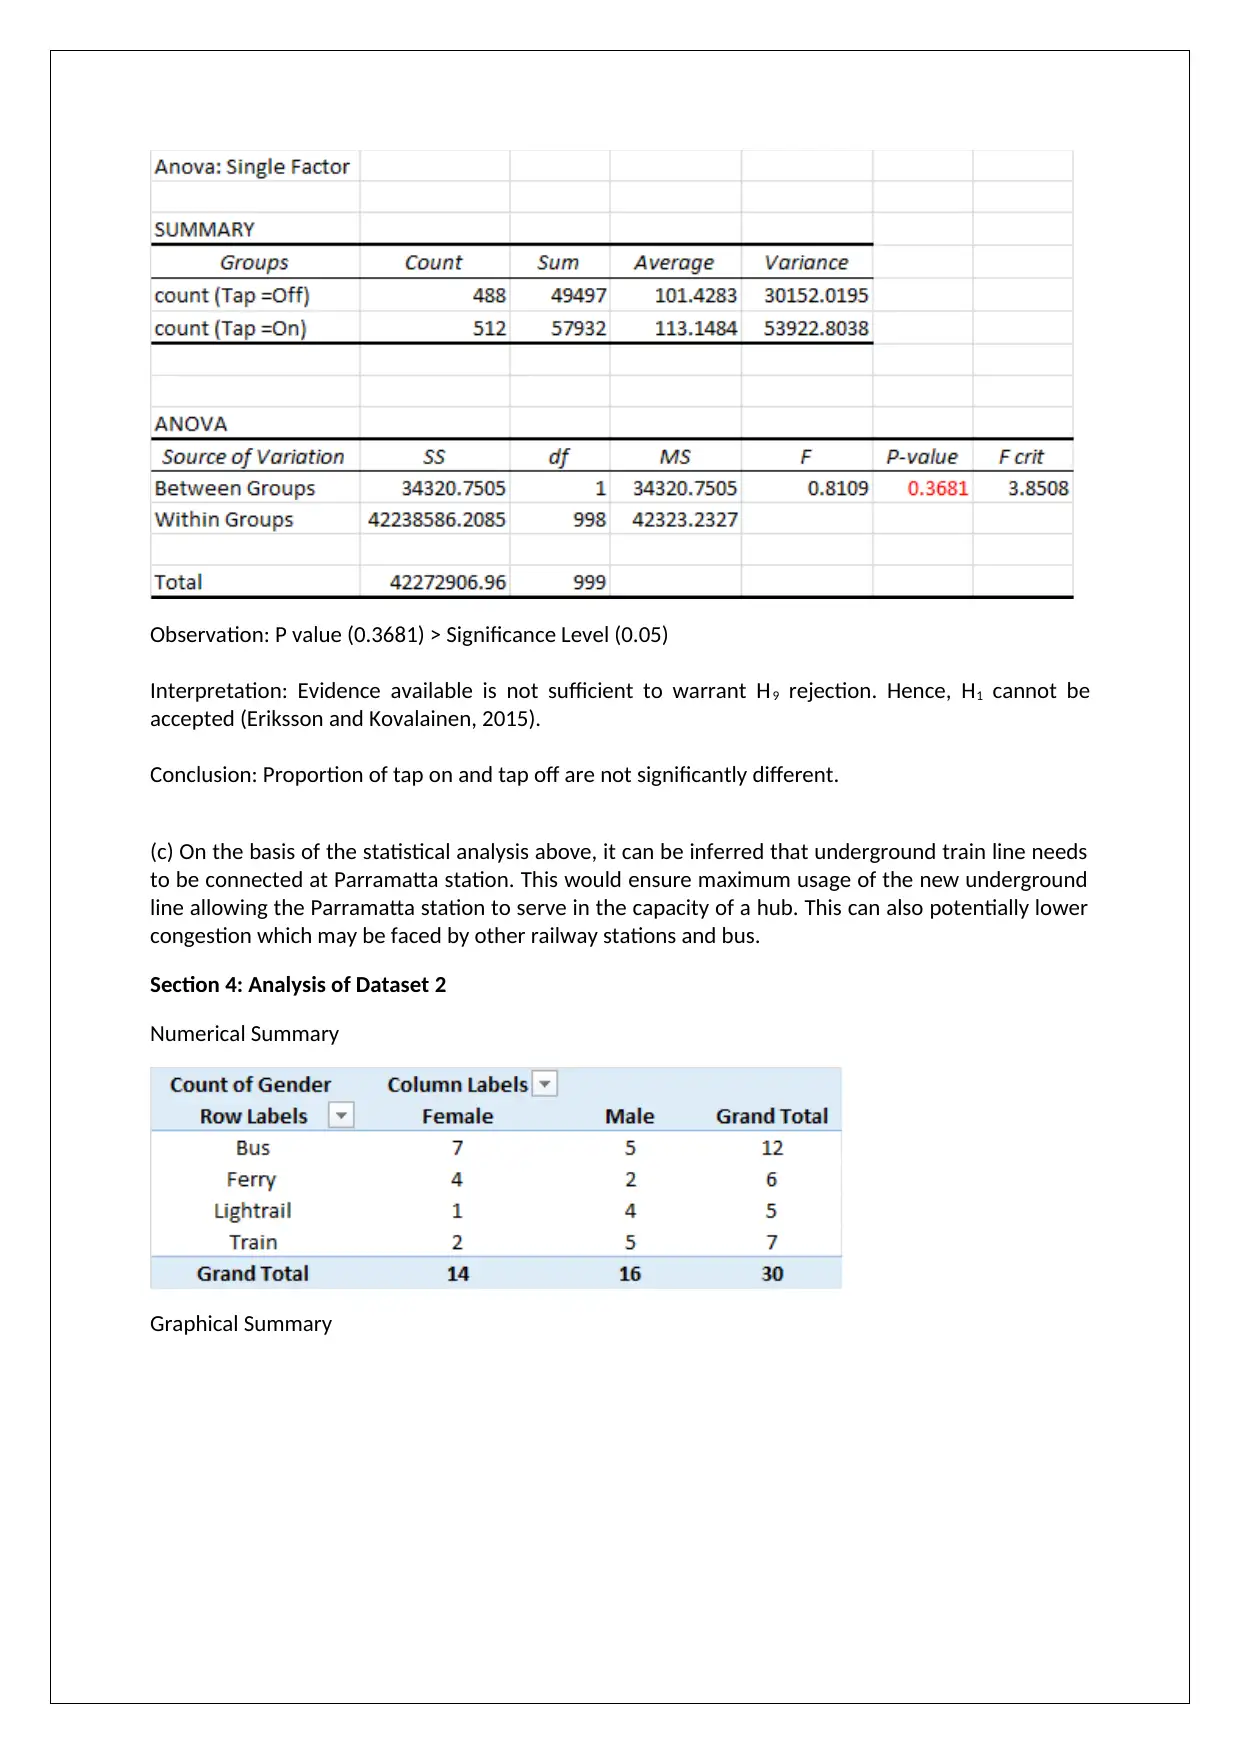
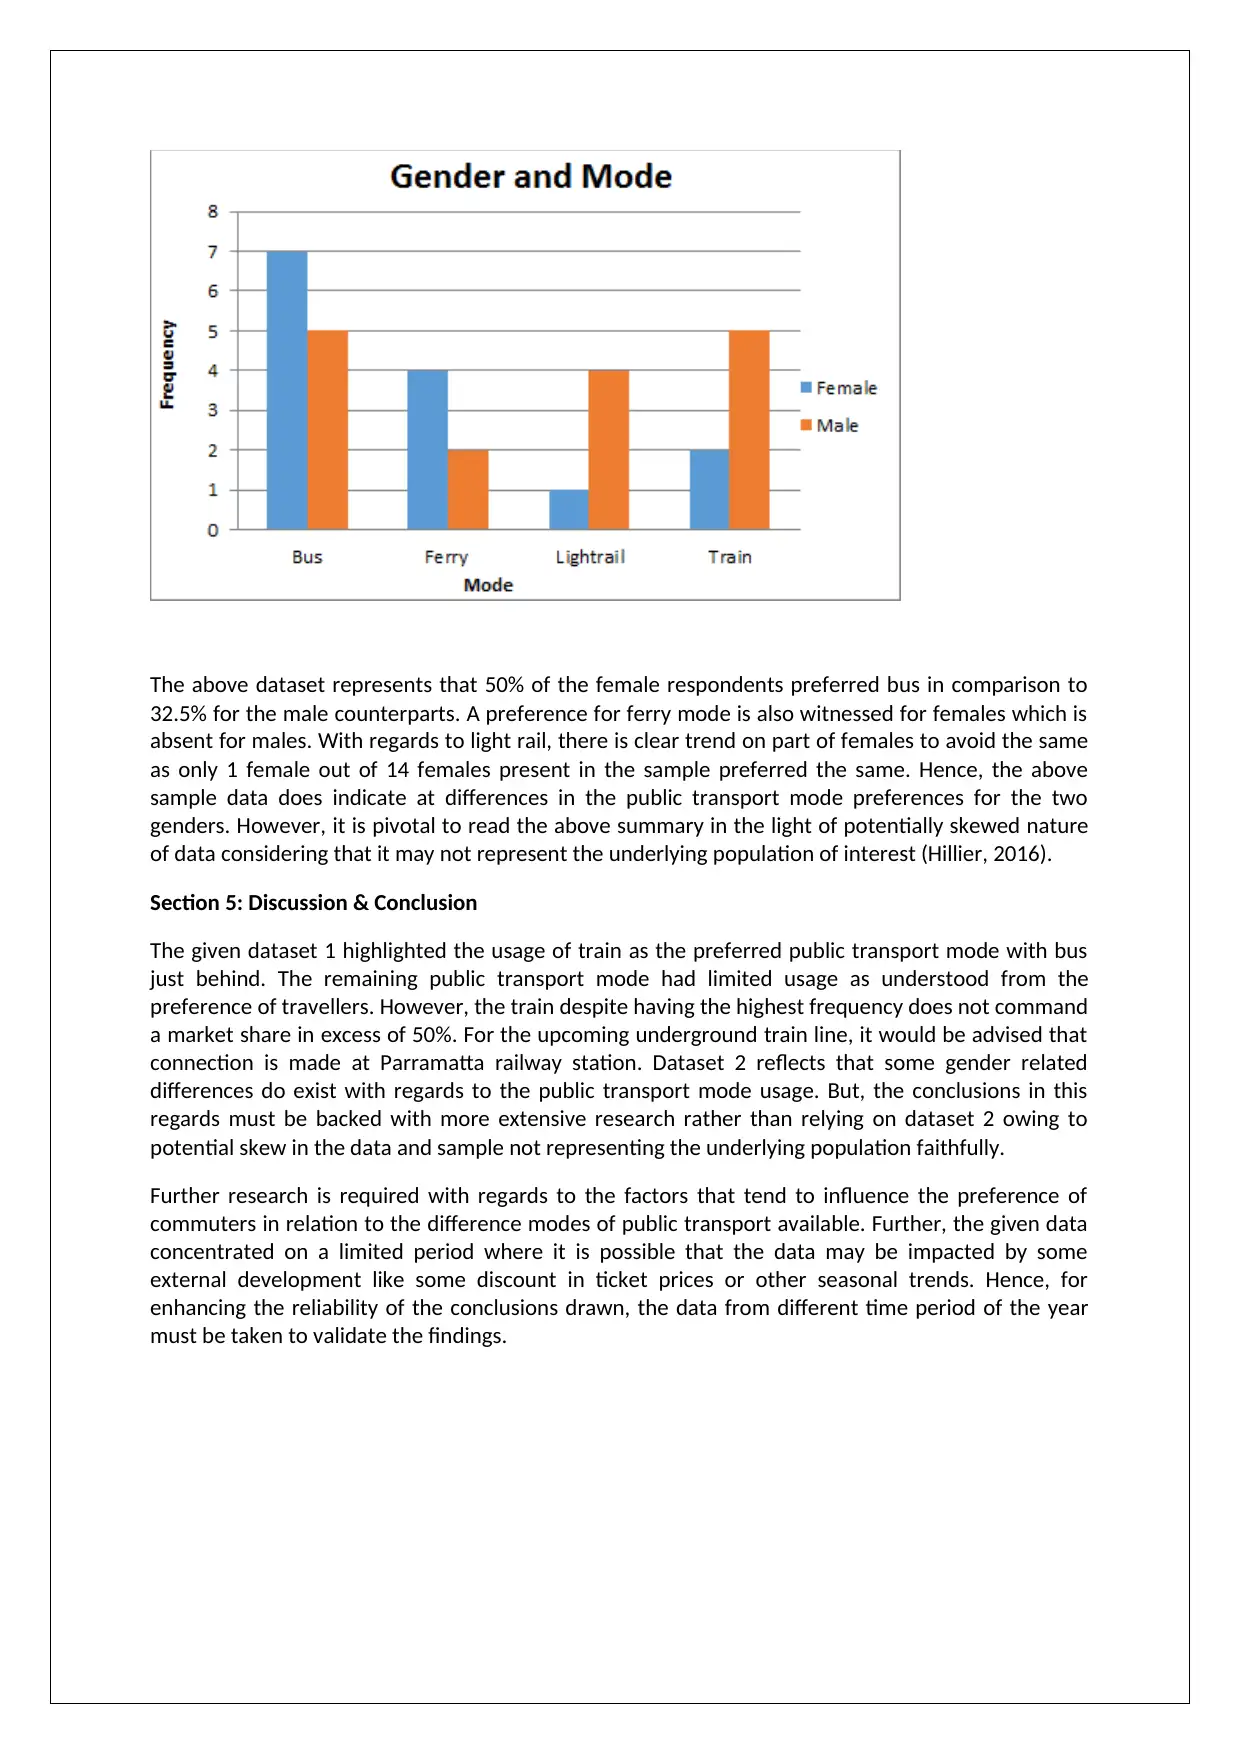
This report presents a statistical analysis of two datasets related to the NSW transport system. Dataset 1, a secondary dataset, examines public transport usage patterns, including the most used modes, and tests hypotheses about transport mode dominance. The analysis involves numerical and graphical summaries, hypothesis testing, and ANOVA to determine significant differences in tap-on/off proportions at Parramatta station, leading to recommendations for infrastructure improvements. Dataset 2, a primary dataset, explores gender-based preferences for different transport modes, highlighting potential biases due to sampling limitations. The report discusses the findings, emphasizing the need for more extensive research to validate conclusions, and suggests further investigation into factors influencing commuter preferences and the impact of external factors like ticket prices on transport mode choice. The study concludes with recommendations for the upcoming underground train line, suggesting a connection at Parramatta station and the need for more comprehensive data collection.
Document Page
STATISTICAL MODELLING
STUDENT ID:
[Pick the date]
tabler-icon-diamond-filled.svg

Paraphrase This Document

Need a fresh take? Get an instant paraphrase of this document with our AI Paraphraser
Document Page
Section 1: Introduction
a) As the population rises, it becomes pivotal to strengthen the urban infrastructure which tends to
aid commerce and economic development. Typically addition of incremental transport
infrastructure takes time and huge capital costs and hence authorities tend to bring in higher
efficiency through the alternations in overhauls and timetables. These changes are brought in
after suitable research and are at aimed at providing the benefits to a large population even
though some people may be negatively impacted by these changes (Meyers, 2017).
b) The given data provided in the form of Dataset 1 is an example of secondary data as it has been
obtained from an outside source and not been obtained directly from the respondents by
recording their respective responses (Eriksson and Kovalainen, 2015). The dataset has total of six
variables and a sample size of 1000 observations has been represented. The data comprises of
certain categorical variables with nominal measurement scale such as tap, mode and location.
Besides, there is another categorical variable of ordinal measurement scale which is date. There
are two quantitative variables i.e. time and count with the measurement scale being ratio and
interval respectivel (Flick, 2015). Dataset 1 tends to represent various cases corresponding to
activity of tapping on or off at the specified location which took at a time on the underlying date
and also captures the variation by transport mode.
c) Dataset 2 has a sample size of 30 and seeks to highlight the public transport mode preferred by 30
respondents. The data collected is primary as this has not been copied from any other source but
has been recorded from the respondents through a survey method (Hair et. al., 2015). The dataset
being primary must not imply that higher accuracy would be there as compared to secondary data as
accuracy is a function of the sample representing the population significant attributes. This is a bid
issue for the given data as it is prone to bias. There are two likely sources of bias here namely the
non-probability sampling method used and low sample size (Hillier, 2016). The underlying variables
captured by this data are gender and mode of transport both of which are categorical variables
along with measurement scale which is nominal.
Section 2: Single variable Analysis – Dataset 1
a) Numerical Summary:
Graphical Summary
Document Page
It is evident that for the sample data, the most often used public transport mode is train. However,
this is closely followed by bus which is also not far thereby highlighting significant usage of bus as a
public transport mode. The other modes i.e. ferry and light rail have limited usage. Thereby, the
infrastructure planners must continue expanding the train and bus infrastructure to accommodate
the population rise or aim to develop alternative public transport means which can reduce the
burden on train or bus.
b) Hypothesis Testing:
Significance Level = 5%
The respective excel output for the hypothesis test is given below.
Observation: P value (0.9314) > Significance Level (0.05)
Interpretation: Evidence available is not sufficient to warrant H9 rejection. Hence, H1 cannot be
accepted (Flick, 2015).
Document Page
Conclusion: The dominant mode of transport (train) does not command greater than 50% share.
Section 3: Analysis of Two Variables – Dataset 1
a) Numerical Summary
Graphical Summary
Key Observation: Maximum traffic at Parramatta Station
(b) Hypothesis Testing
Significance Level = 5%
ANOVA is used as the suitable test with the relevant output pasted below.
tabler-icon-diamond-filled.svg

Paraphrase This Document

Need a fresh take? Get an instant paraphrase of this document with our AI Paraphraser
Document Page
Observation: P value (0.3681) > Significance Level (0.05)
Interpretation: Evidence available is not sufficient to warrant H9 rejection. Hence, H1 cannot be
accepted (Eriksson and Kovalainen, 2015).
Conclusion: Proportion of tap on and tap off are not significantly different.
(c) On the basis of the statistical analysis above, it can be inferred that underground train line needs
to be connected at Parramatta station. This would ensure maximum usage of the new underground
line allowing the Parramatta station to serve in the capacity of a hub. This can also potentially lower
congestion which may be faced by other railway stations and bus.
Section 4: Analysis of Dataset 2
Numerical Summary
Graphical Summary
Document Page
The above dataset represents that 50% of the female respondents preferred bus in comparison to
32.5% for the male counterparts. A preference for ferry mode is also witnessed for females which is
absent for males. With regards to light rail, there is clear trend on part of females to avoid the same
as only 1 female out of 14 females present in the sample preferred the same. Hence, the above
sample data does indicate at differences in the public transport mode preferences for the two
genders. However, it is pivotal to read the above summary in the light of potentially skewed nature
of data considering that it may not represent the underlying population of interest (Hillier, 2016).
Section 5: Discussion & Conclusion
The given dataset 1 highlighted the usage of train as the preferred public transport mode with bus
just behind. The remaining public transport mode had limited usage as understood from the
preference of travellers. However, the train despite having the highest frequency does not command
a market share in excess of 50%. For the upcoming underground train line, it would be advised that
connection is made at Parramatta railway station. Dataset 2 reflects that some gender related
differences do exist with regards to the public transport mode usage. But, the conclusions in this
regards must be backed with more extensive research rather than relying on dataset 2 owing to
potential skew in the data and sample not representing the underlying population faithfully.
Further research is required with regards to the factors that tend to influence the preference of
commuters in relation to the difference modes of public transport available. Further, the given data
concentrated on a limited period where it is possible that the data may be impacted by some
external development like some discount in ticket prices or other seasonal trends. Hence, for
enhancing the reliability of the conclusions drawn, the data from different time period of the year
must be taken to validate the findings.
Document Page
References
Eriksson, P. and Kovalainen, A. (2015) Quantitative methods in business research 3rd ed. London:
Sage Publications.
Flick, U. (2015) Introducing research methodology: A beginner's guide to doing a research project.
4th ed. New York: Sage Publications.
Hair, J. F., Wolfinbarger, M., Money, A. H., Samouel, P., and Page, M. J. (2015) Essentials of business
research methods. 2nd ed. New York: Routledge.
Hillier, F. (2016) Introduction to Operations Research 6th ed. New York: McGraw Hill Publications.
Mayers, L. (2017) Greater Sydney and NSW public transport undergo state's 'largest' timetable
overhaul ever, [online] Available at http://www.abc.net.au/news/2017-11-26/new-sydney-and-nsw-
public-transport-timetable-launched/9194538 (Assessed September 23, 2018)
chevron_up_icon
1 out of 7
circle_padding
hide_on_mobile
zoom_out_icon
[object Object]