Statistics Assignment: Statistical Analysis of Movie Data (2019)

Verified

Added on  2023/02/01

|6
|1072
|52
Homework Assignment
AI Summary
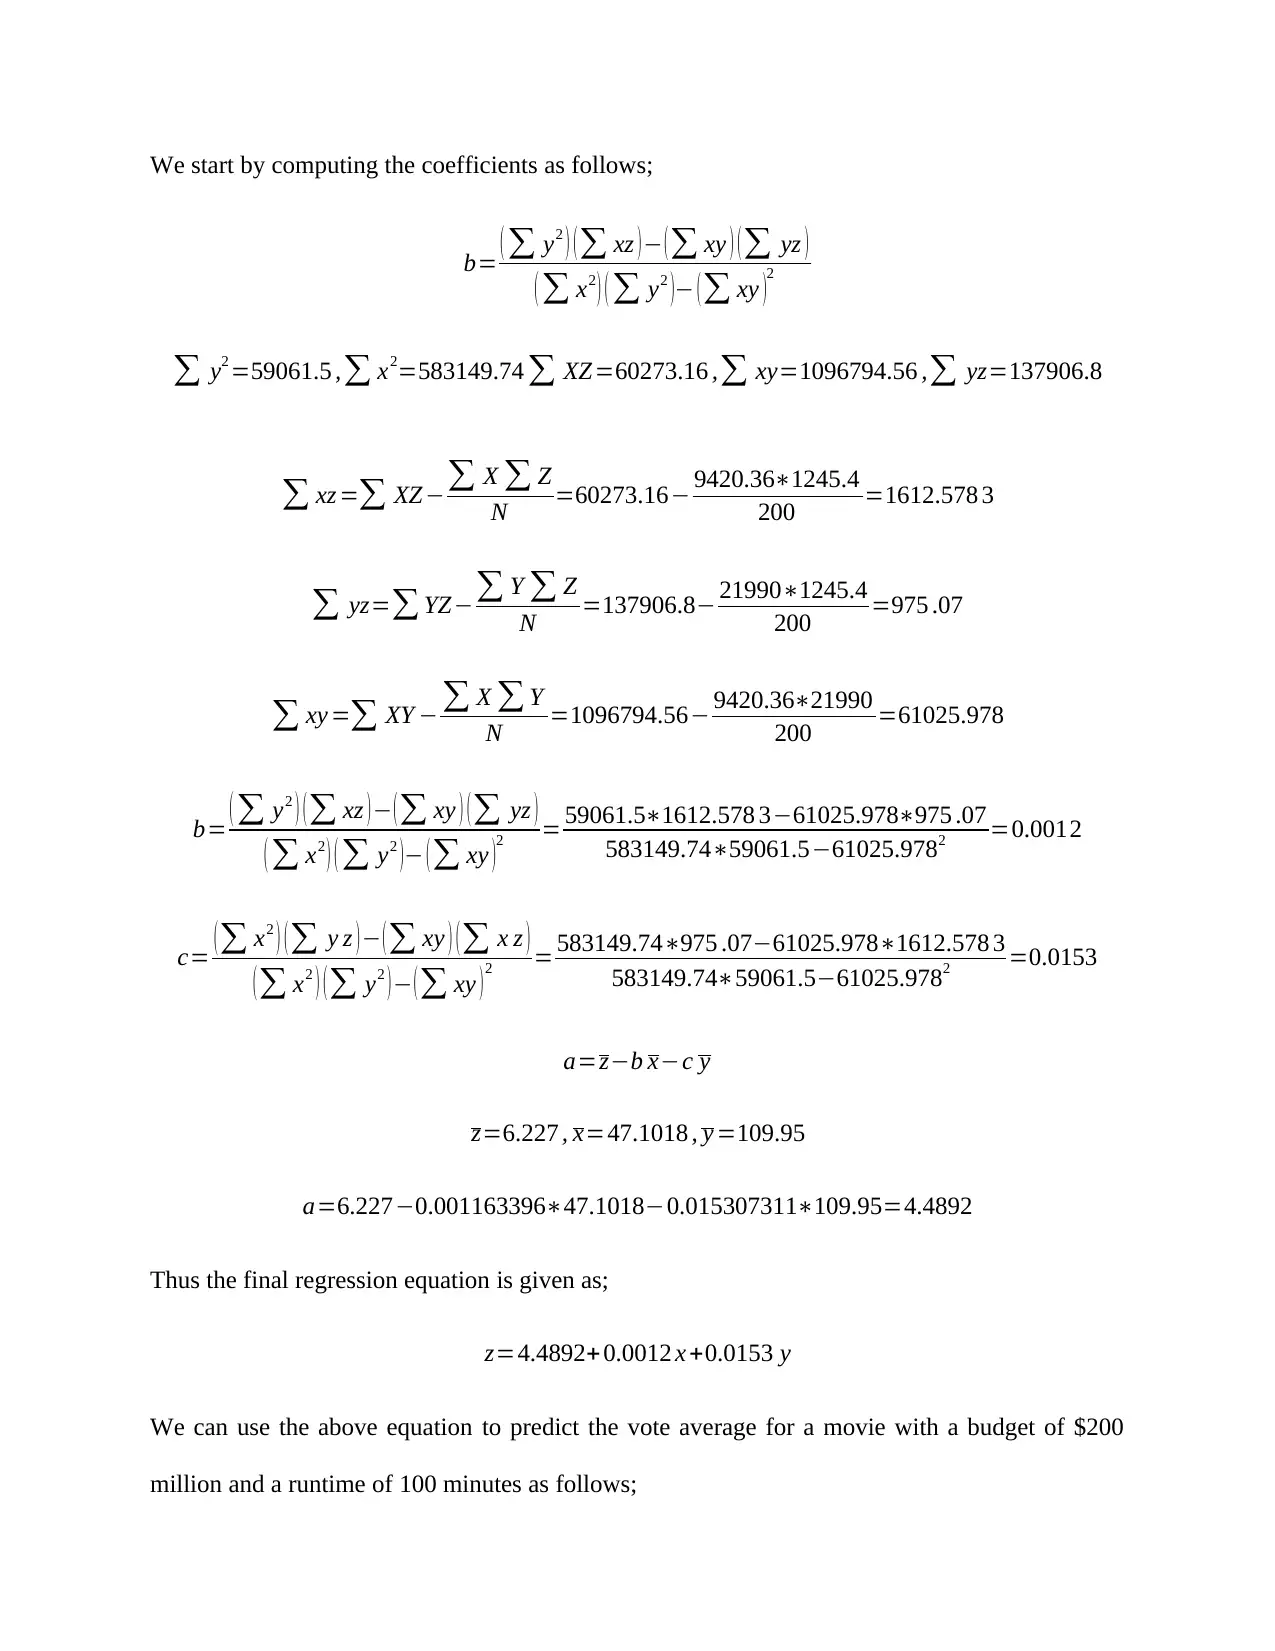
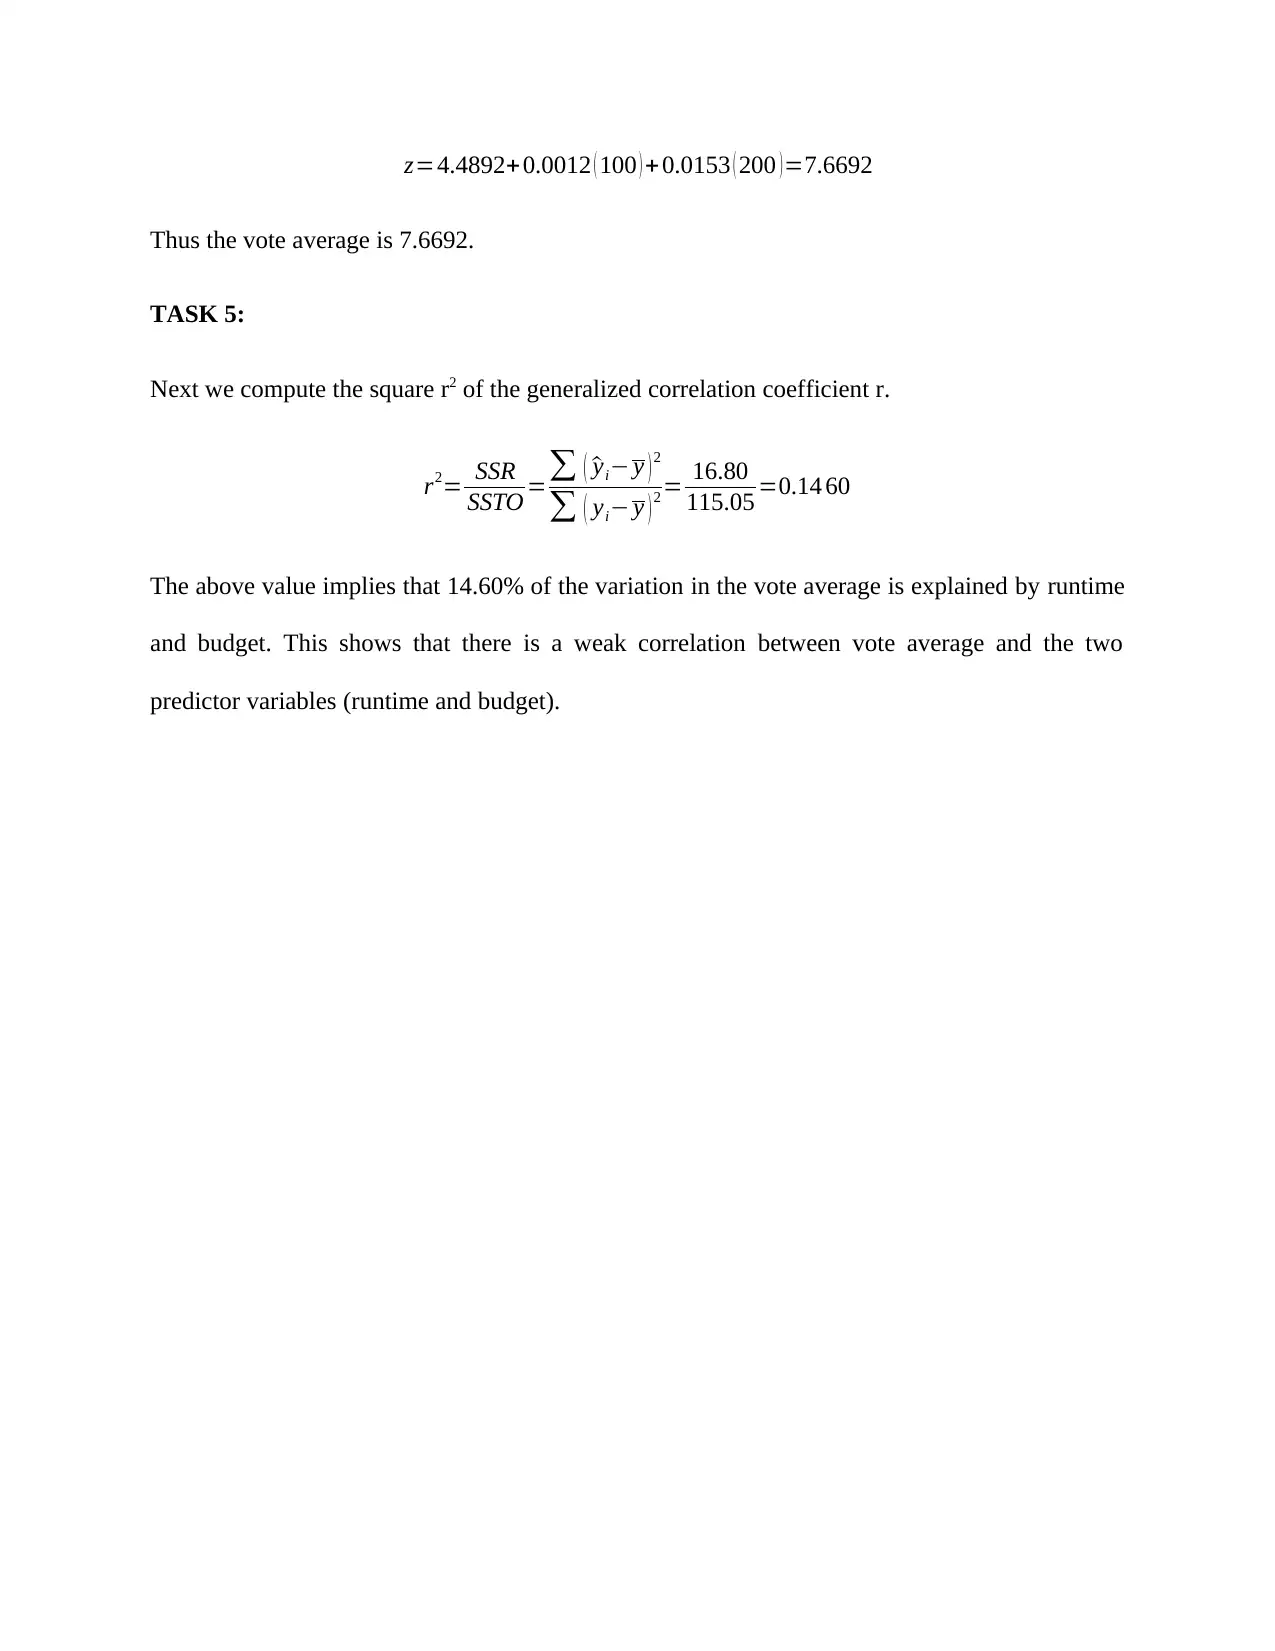
This statistics assignment analyzes movie data, focusing on hypothesis testing, chi-square tests, and regression analysis. Task 1 involves generating random samples of movie data. Task 2 tests the hypothesis about runtime proportions using a 5% significance level, concluding that the proportions are equal. Task 3 employs the chi-square test of independence to assess the relationship between movie revenue and budget at a 2% significance level, rejecting the null hypothesis and finding a significant association. Task 4 involves solving normal equations to derive the least-squares regression plane equation, predicting vote averages based on runtime and budget. Finally, Task 5 computes the R-squared value, indicating a weak correlation between the vote average and the predictor variables.
Document Page
Statistics
Student Name:
Instructor Name:
Course Number:
26th April 2019
tabler-icon-diamond-filled.svg

Paraphrase This Document

Need a fresh take? Get an instant paraphrase of this document with our AI Paraphraser
Document Page
Task 1:
We computed the two random samples, each of size 200, with one sample taken from those
movies made before 2010 and the other sample taken from those movies made in 2010 - 2019,
using the formula RAND(). The results are presented in excel attached with this report.
TASK 2:
Using a 5% significance level, we sought to test the hypothesis that the proportion of movies
made in 2010 - 2019 with a runtime of at least 2 hours is significantly different from the
proportion of movies made before 2010 with a runtime of at least 2 hours.
The tested hypothesis is given as follows;
H0 : p1= p2
H A : p1 p2
Where p1= proportion of movies made before 2010 with a runtime of at least 2 hours
p2= proportion of movies made20102019 with a runtime of at least 2 hours
The results are presented below;
Results
Sample 1 Sample 2 Difference
Sample proportion 0.27 0.26 0.01
95% CI (asymptotic) 0.2085 - 0.3315 0.1992 - 0.3208 -0.0765 - 0.0965
z-value 0.2
P-value 0.8207
Interpretation
Not significant,
accept null hypothesis that
sample proportions are equal
n by pi n * pi >5, test ok
Document Page
The p-value is given as 0.821 (a value greater than 5% level of significance), we therefore fail to
reject the null hypothesis and conclude that the sample proportions are equal. That is, the
proportion of movies made before 2010 and those made in 2010 - 2019 with a runtime of at least
2 hours are the same.
TASK 3:
In this section, using the chi-square test of independence and a sample of 200 movies released in
2010 - 2019, we sought to test the hypothesis that revenue and budget are related at the 2%
significance level. The revenue data was split into the following three classes; < $50M, $50M to
$100M, and > $100M. The budget was split into the following three classes < $10M, $10M to
$50M, and > $50M.
The hypothesis tested is as follows;
Null hypothesis (H0): There is no significant association between budget and revenue
Alternative hypothesis (HA): There is significant association between budget and revenue.
Results of the test are given below;
Revenue group * Budget group Cross tabulation
Count
Budget group Total
< $10 M >$50 M $10 M to $50 M
Revenue group
< $50 M 37 2 60 99
>$100 M 0 49 20 69
$50 M to $100 M 4 7 21 32
Total 41 58 101 200
Chi-Square Tests
Document Page
Value df Asymp. Sig. (2-
sided)
Pearson Chi-Square 106.080a 4 .000
Likelihood Ratio 124.333 4 .000
N of Valid Cases 200
a. 0 cells (0.0%) have expected count less than 5. The minimum
expected count is 6.56.
The formula in excel for computing the p-value is given as;
=CHISQ.TEST(O4:Q6, O10:Q12) = 0.000
=CHISQ.DIST.RT(N14,4) = 0.000
From the above results, we can see that the p-value for the Chi-Square test is 0.000 (a value less
than 2% level of significance), we therefore reject the null hypothesis. By rejecting the null
hypothesis we conclude that there is enough evidence of significant association between budget
and revenue. We can see that the higher the budget, the higher the revenues generated by the
company. Companies that had lower budget allocation realized low revenues as compared to
those that allocated higher budgets.
TASK 4:
Using the sample of 200 movies released in 2010 - 2019, we sought to solve the relevant normal
equations to find the coefficients a, b and c of the least-squares regression plane
z=a+bx+ cy,
Where z denotes the variable “vote_average”, x denotes the variable “runtime” and y denotes the
variable “budget”.
tabler-icon-diamond-filled.svg

Paraphrase This Document

Need a fresh take? Get an instant paraphrase of this document with our AI Paraphraser
Document Page
We start by computing the coefficients as follows;
b= ( y2 ) ( xz ) ( xy ) ( yz )
( x2 ) ( y2 ) ( xy )2
y2 =59061.5 , x2=583149.74 XZ=60273.16 , xy=1096794.56 , yz=137906.8
xz = XZ X Z
N =60273.16 9420.361245.4
200 =1612.578 3
yz= YZ Y Z
N =137906.8 219901245.4
200 =975 .07
xy = XY X Y
N =1096794.56 9420.3621990
200 =61025.978
b= ( y2 ) ( xz ) ( xy ) ( yz )
( x2 ) ( y2 ) ( xy )2 = 59061.51612.578 361025.978975 .07
583149.7459061.561025.9782 =0.0012
c= ( x2 ) ( y z ) ( xy ) ( x z )
( x2 ) ( y2 ) ( xy )2 = 583149.74975 .0761025.9781612.578 3
583149.7459061.561025.9782 =0.0153
a=zb xc y
z=6.227 , x=47.1018 , y =109.95
a=6.2270.00116339647.10180.015307311109.95=4.4892
Thus the final regression equation is given as;
z=4.4892+ 0.0012 x +0.0153 y
We can use the above equation to predict the vote average for a movie with a budget of $200
million and a runtime of 100 minutes as follows;
Document Page
z=4.4892+ 0.0012 ( 100 ) + 0.0153 ( 200 )=7.6692
Thus the vote average is 7.6692.
TASK 5:
Next we compute the square r2 of the generalized correlation coefficient r.
r2= SSR
SSTO = ( ^yi y ) 2
( yi y ) 2 = 16.80
115.05 =0.14 60
The above value implies that 14.60% of the variation in the vote average is explained by runtime
and budget. This shows that there is a weak correlation between vote average and the two
predictor variables (runtime and budget).
chevron_up_icon
1 out of 6
circle_padding
hide_on_mobile
zoom_out_icon
[object Object]