Statistical Modeling of NFL Data: OLS and LASSO Regression Project

Verified

Added on  2023/03/17

|12
|1021
|69
Project
AI Summary
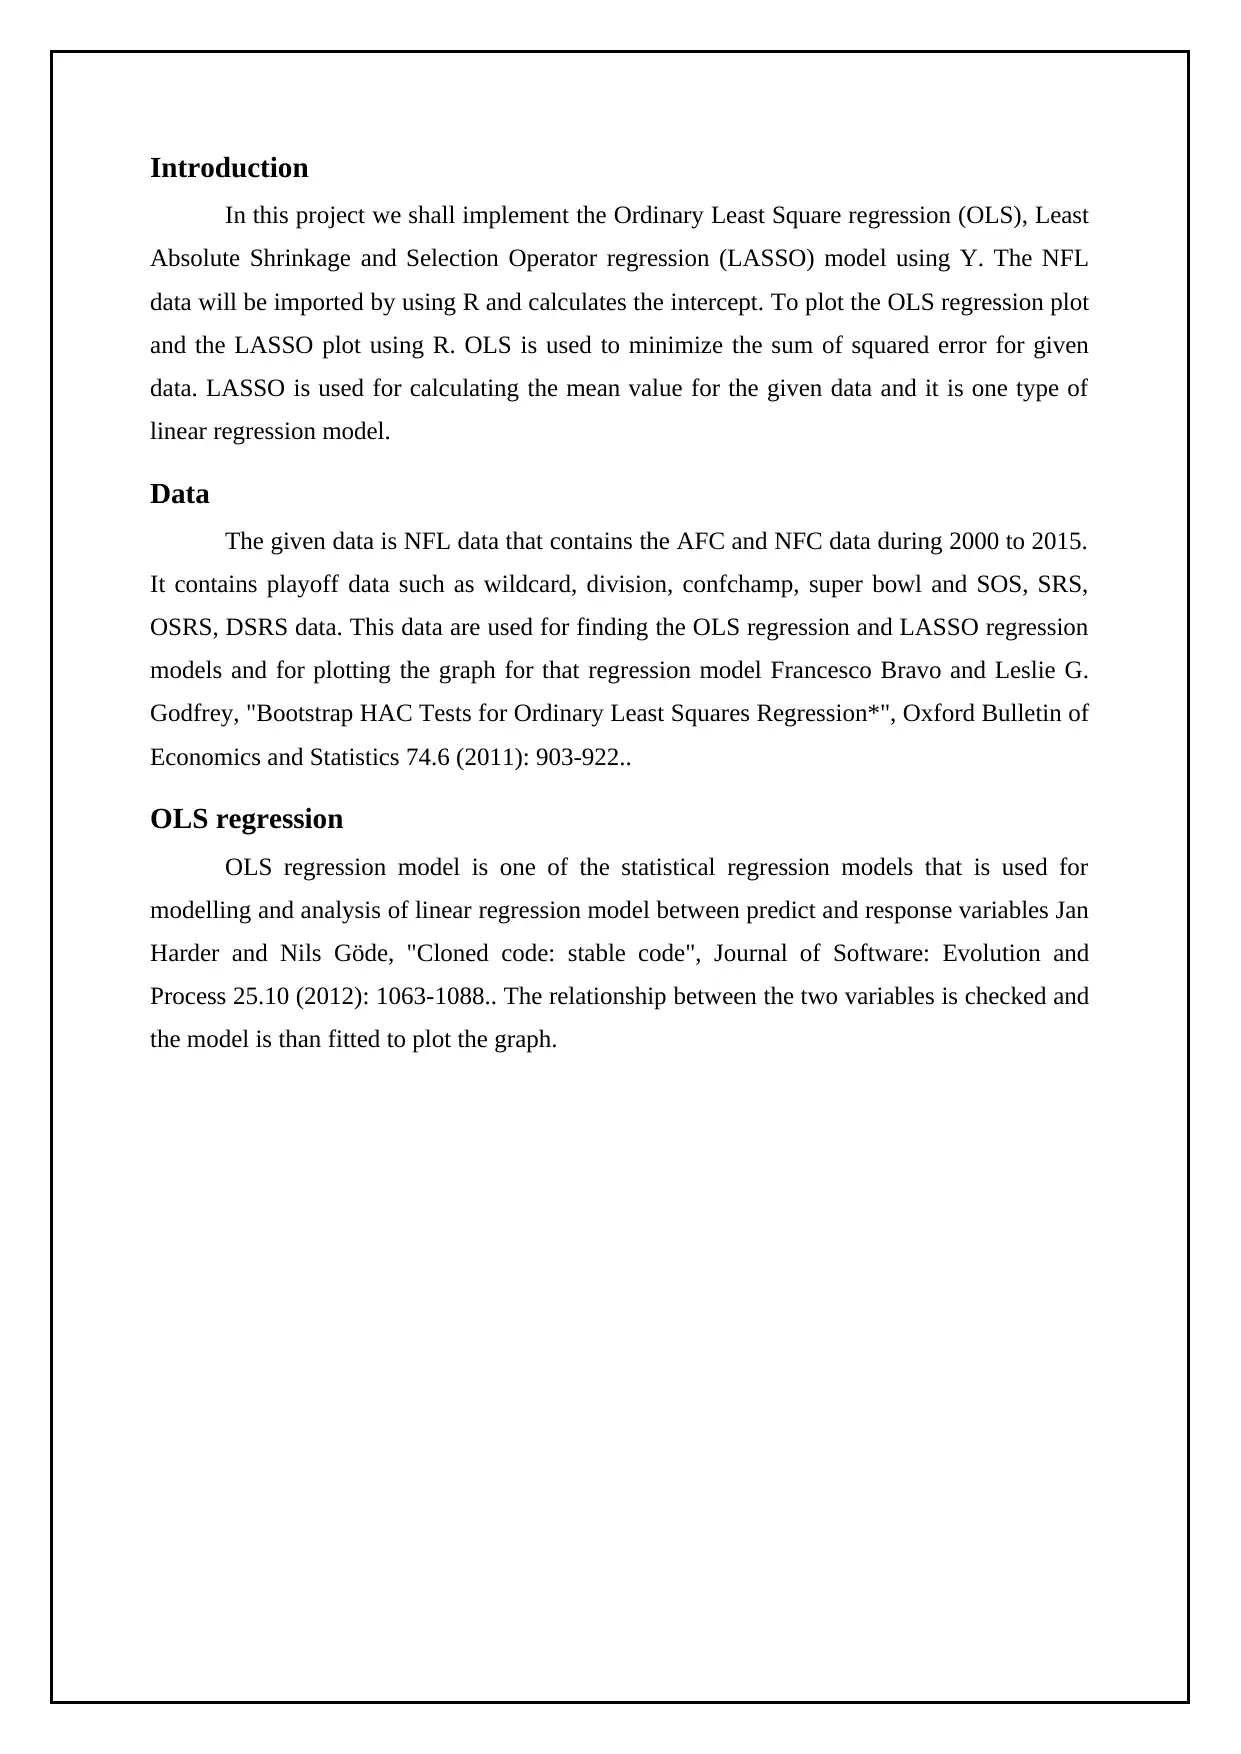
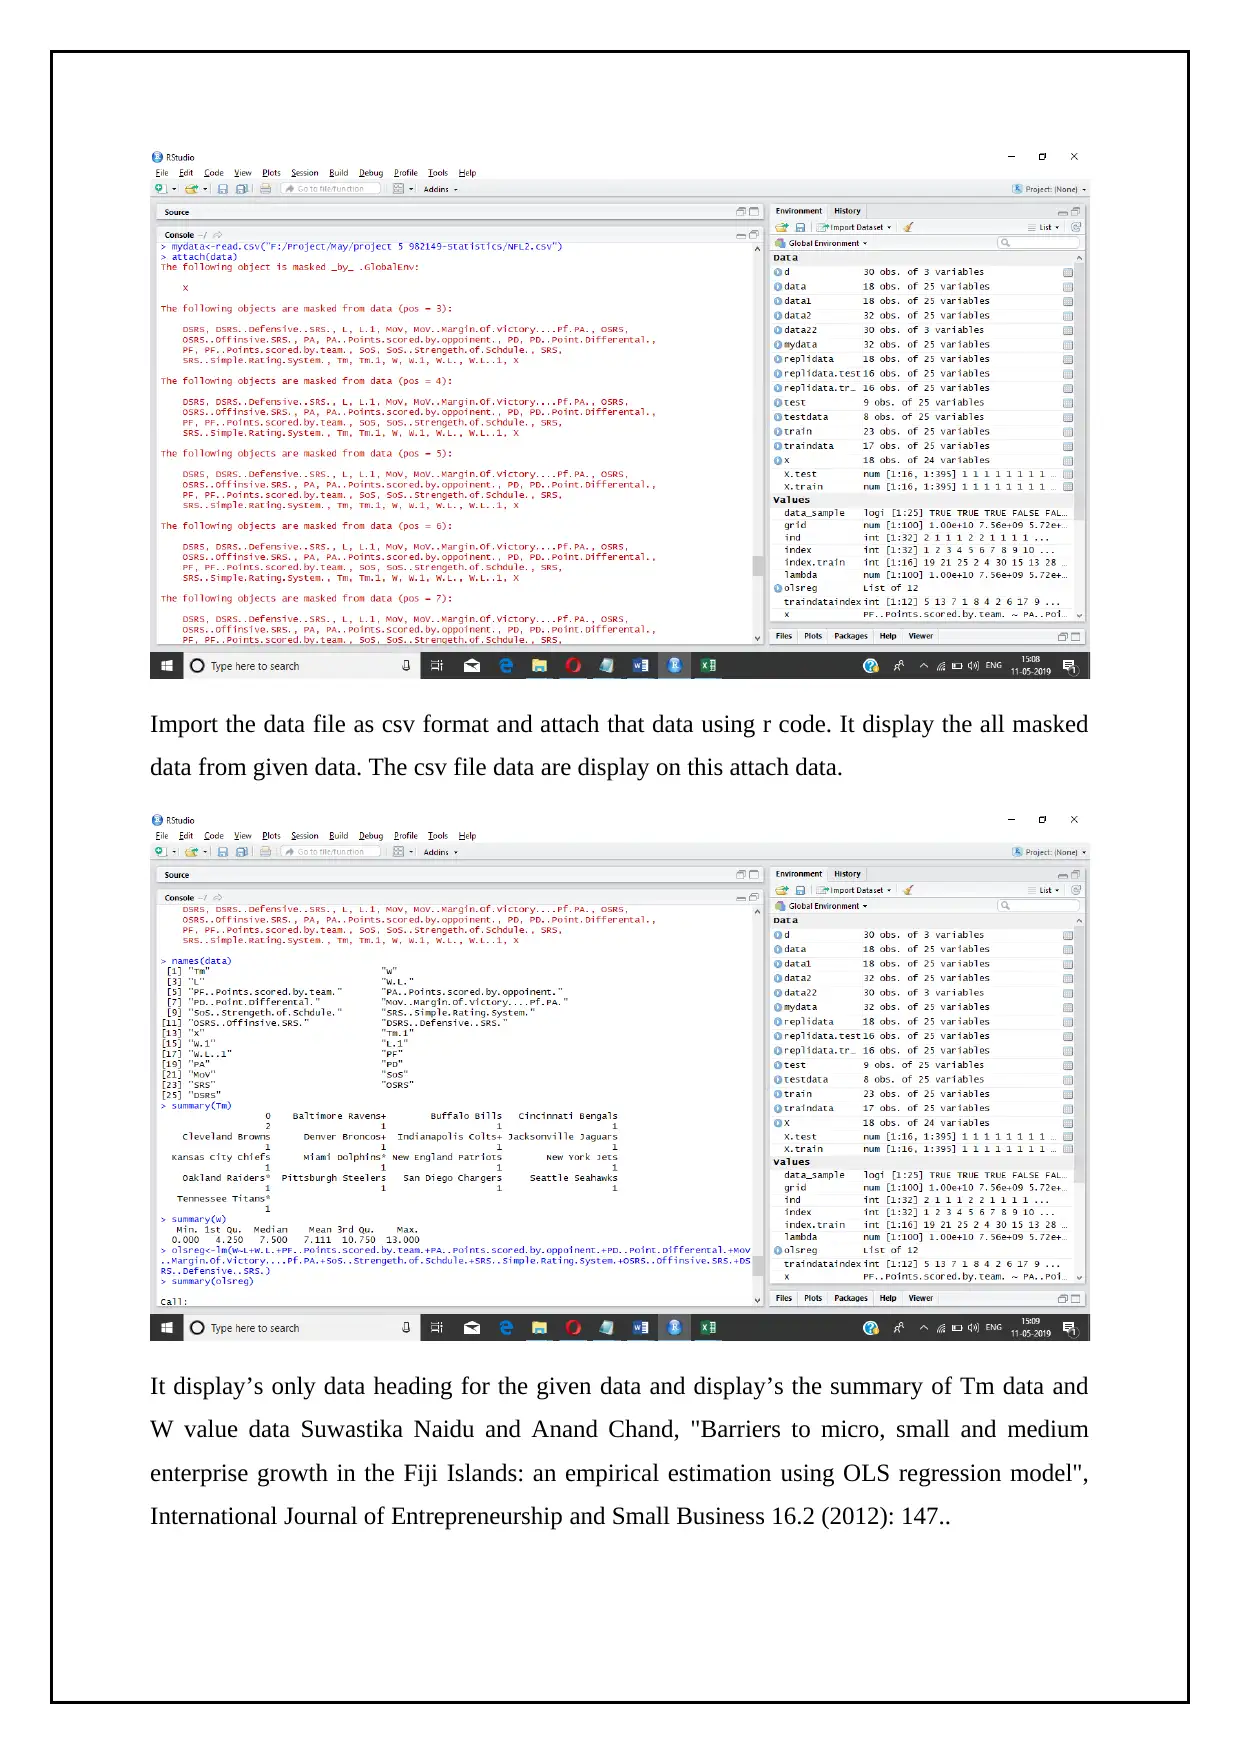
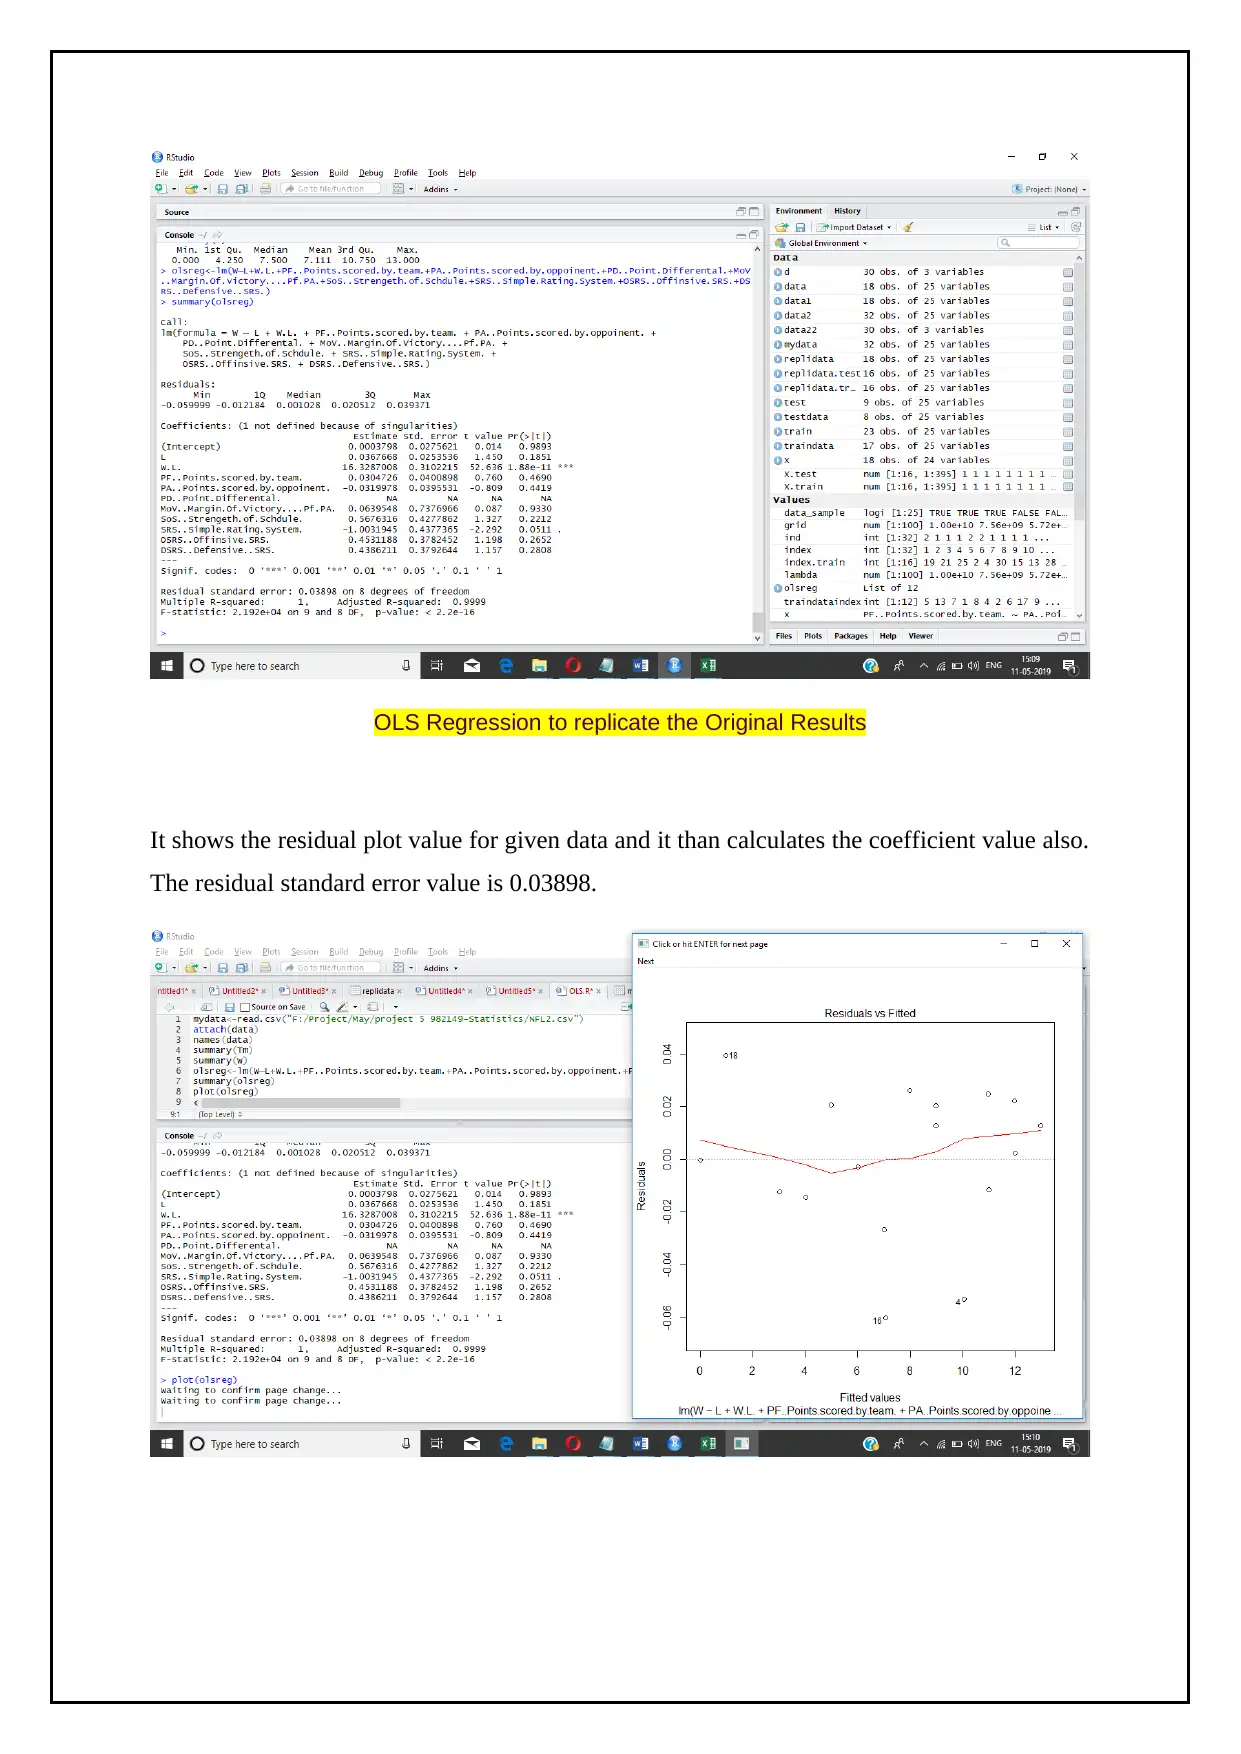
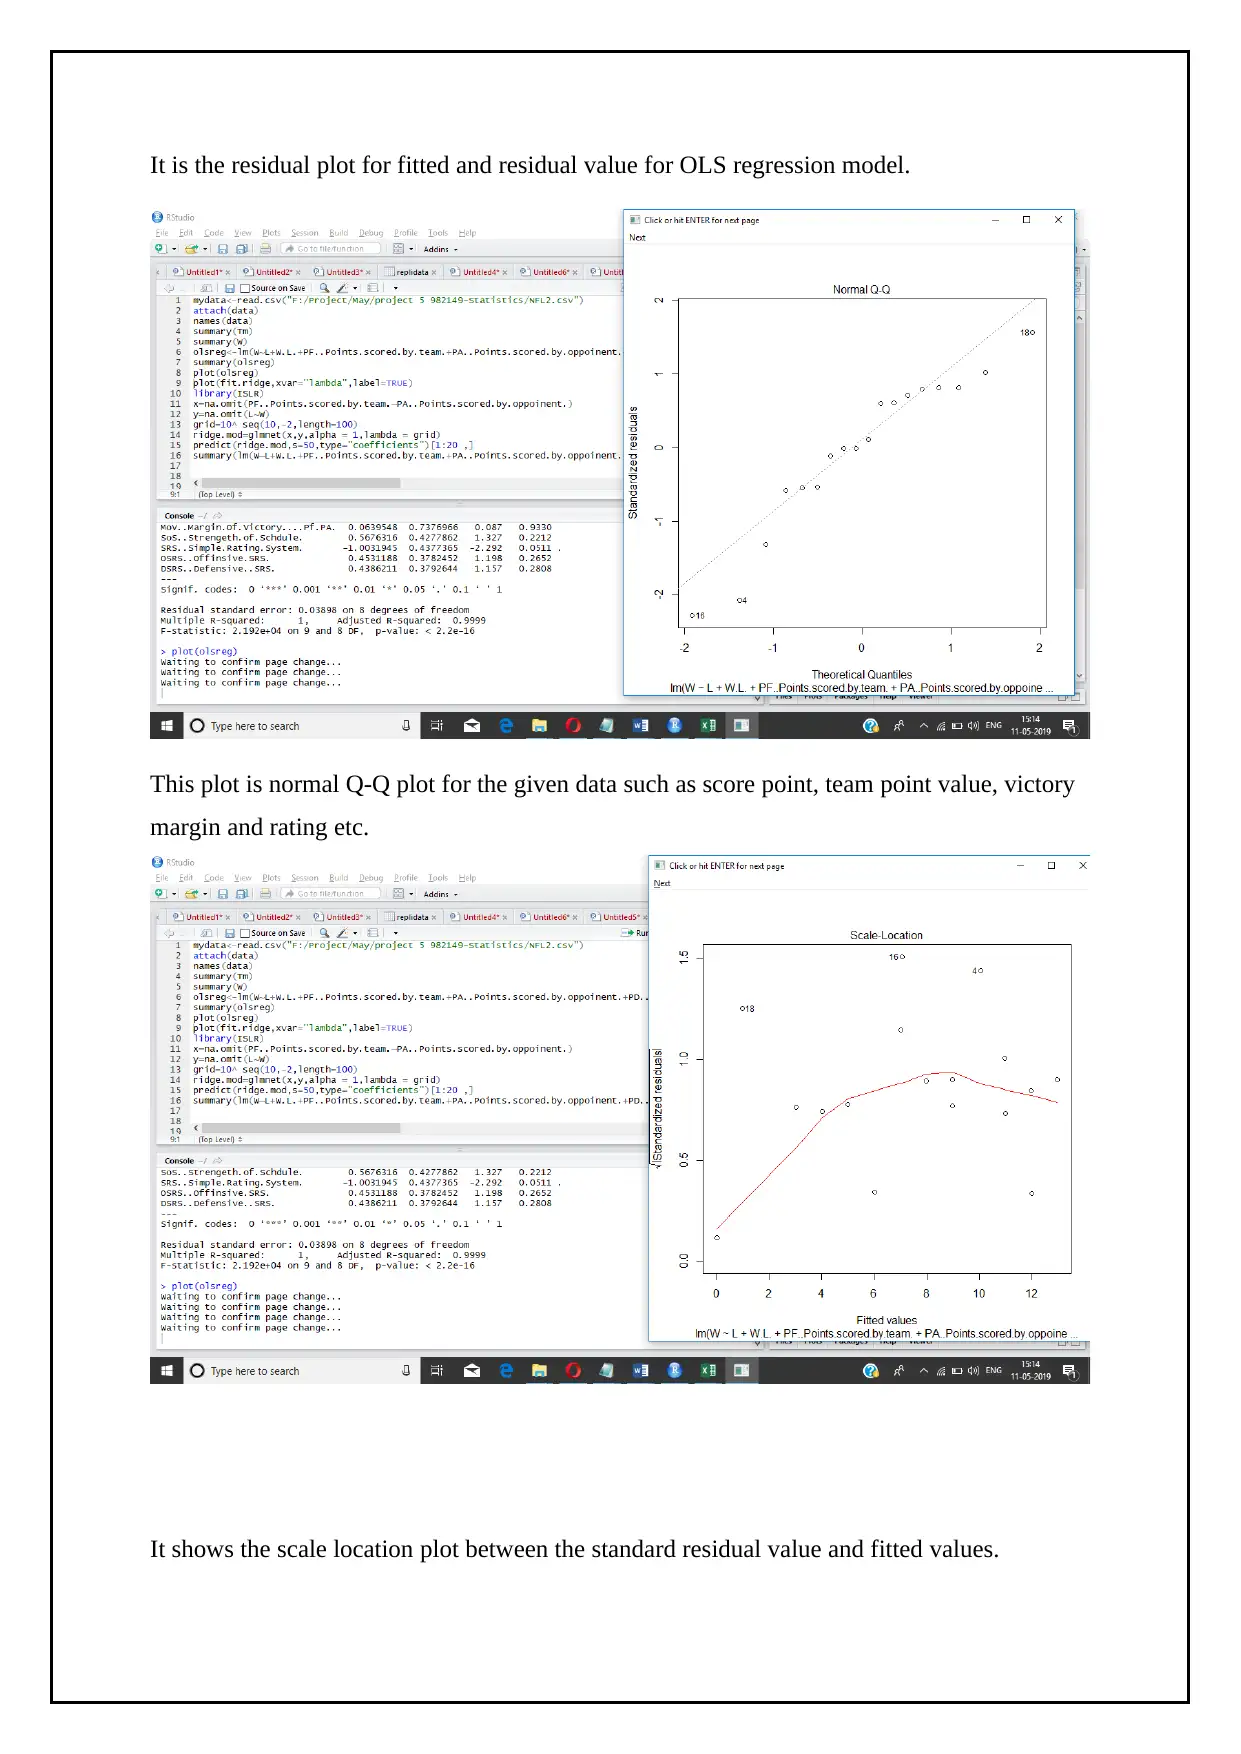
This project implements Ordinary Least Squares (OLS) and Least Absolute Shrinkage and Selection Operator (LASSO) regression models using NFL data from 2000 to 2015. The analysis, conducted using R, explores the relationship between various factors and betting outcomes. The OLS model is used to minimize the sum of squared errors, while the LASSO model calculates the mean value and identifies significant variables, plotting the results to visualize the regression models. The project imports NFL data, including playoff statistics like wildcard, division, and Super Bowl data, and uses these variables to find OLS and LASSO regression models and plot the graph. The project successfully implements both regression models, calculates coefficient values, and generates plots, providing insights into the application of statistical methods in sports analytics and betting market analysis.
Document Page
Statistics
tabler-icon-diamond-filled.svg

Secure Best Marks with AI Grader

Need help grading? Try our AI Grader for instant feedback on your assignments.
Document Page
Table of Contents
Introduction..............................................................................................................................2
Data............................................................................................................................................2
OLS regression.........................................................................................................................2
LASSO Regression...................................................................................................................7
Conclusion...............................................................................................................................11
References...............................................................................................................................12
Document Page
Introduction
In this project we shall implement the Ordinary Least Square regression (OLS), Least
Absolute Shrinkage and Selection Operator regression (LASSO) model using Y. The NFL
data will be imported by using R and calculates the intercept. To plot the OLS regression plot
and the LASSO plot using R. OLS is used to minimize the sum of squared error for given
data. LASSO is used for calculating the mean value for the given data and it is one type of
linear regression model.
Data
The given data is NFL data that contains the AFC and NFC data during 2000 to 2015.
It contains playoff data such as wildcard, division, confchamp, super bowl and SOS, SRS,
OSRS, DSRS data. This data are used for finding the OLS regression and LASSO regression
models and for plotting the graph for that regression model Francesco Bravo and Leslie G.
Godfrey, "Bootstrap HAC Tests for Ordinary Least Squares Regression*", Oxford Bulletin of
Economics and Statistics 74.6 (2011): 903-922..
OLS regression
OLS regression model is one of the statistical regression models that is used for
modelling and analysis of linear regression model between predict and response variables Jan
Harder and Nils Göde, "Cloned code: stable code", Journal of Software: Evolution and
Process 25.10 (2012): 1063-1088.. The relationship between the two variables is checked and
the model is than fitted to plot the graph.
Document Page
Import the data file as csv format and attach that data using r code. It display the all masked
data from given data. The csv file data are display on this attach data.
It display’s only data heading for the given data and display’s the summary of Tm data and
W value data Suwastika Naidu and Anand Chand, "Barriers to micro, small and medium
enterprise growth in the Fiji Islands: an empirical estimation using OLS regression model",
International Journal of Entrepreneurship and Small Business 16.2 (2012): 147..
tabler-icon-diamond-filled.svg

Secure Best Marks with AI Grader

Need help grading? Try our AI Grader for instant feedback on your assignments.
Document Page
OLS Regression to replicate the Original Results
It shows the residual plot value for given data and it than calculates the coefficient value also.
The residual standard error value is 0.03898.
Document Page
It is the residual plot for fitted and residual value for OLS regression model.
This plot is normal Q-Q plot for the given data such as score point, team point value, victory
margin and rating etc.
It shows the scale location plot between the standard residual value and fitted values.
Document Page
It shows the residual vs leverage plot between standard residual values and leverage values.
LASSO Regression
LASSO regression model is used for calculating the coefficient value for data and
only the most significant variables are kept in the final model Gabriela Ciuperca, "Model
selection by LASSO methods in a change-point model", Statistical Papers 55.2 (2012): 349-
374..
tabler-icon-diamond-filled.svg

Paraphrase This Document

Need a fresh take? Get an instant paraphrase of this document with our AI Paraphraser
Document Page
First step is to import the file on R studio and attach that data. It shows the data information
on that page.
It show the main heading information for that data using R code command.
Document Page
LASSO Regresssion With no double intercept
It display’s the summary result for replidata and that contains the minimum value, median
value, maximum value, first quadratic value and third quadratic value.
Document Page
It shows the coefficient plot between fitted value and coefficient value William Valdar et al.,
"Reprioritizing Genetic Associations in Hit Regions Using LASSO-Based Resample Model
Averaging", Genetic Epidemiology 36.5 (2012): 451-462..
The plot for LASSO regression model between log lambda value and mean squared value.
Conclusion
In this project we have successfully implemented the OLS regression model and the
LASSO regression model using the R code. First step was to import the NFL data on R studio
and plot the regression model graph. OLS was used to minimize the sum of squared error for
the given data. LASSO was used for calculating the mean value for the give data and it is one
type of linear regression model Kees Versteegh, "Language of empire, language of power",
Language Ecology 2.1-2 (2018): 1-17.. The coefficient value and mean squared value is
calculated by using LAASO regression model and this plots the graph for that model data.
OLS model is used for finding the sum of squared value and LASSO model is used for
tabler-icon-diamond-filled.svg

Secure Best Marks with AI Grader

Need help grading? Try our AI Grader for instant feedback on your assignments.
Document Page
finding the mean squared error value. Finally the OLS regression model and LASSO
regression model have been successfully implemented.
References
Bravo, Francesco, and Leslie G. Godfrey. "Bootstrap HAC Tests for Ordinary Least Squares
Regression*". Oxford Bulletin of Economics and Statistics 74.6 (2011): 903-922.
Ciuperca, Gabriela. "Model selection by LASSO methods in a change-point
model". Statistical Papers 55.2 (2012): 349-374.
Harder, Jan, and Nils Göde. "Cloned code: stable code". Journal of Software: Evolution and
Process 25.10 (2012): 1063-1088.
Naidu, Suwastika, and Anand Chand. "Barriers to micro, small and medium enterprise
growth in the Fiji Islands: an empirical estimation using OLS regression
model". International Journal of Entrepreneurship and Small Business 16.2 (2012): 147.
Document Page
Valdar, William et al. "Reprioritizing Genetic Associations in Hit Regions Using LASSO-
Based Resample Model Averaging". Genetic Epidemiology 36.5 (2012): 451-462.
Versteegh, Kees. "Language of empire, language of power". Language Ecology 2.1-2 (2018):
1-17.
chevron_up_icon
1 out of 12
circle_padding
hide_on_mobile
zoom_out_icon
[object Object]