Statistical Process Control and Kanban Card Calculations Report
VerifiedAdded on 2022/09/09
|7
|843
|22
Report
AI Summary
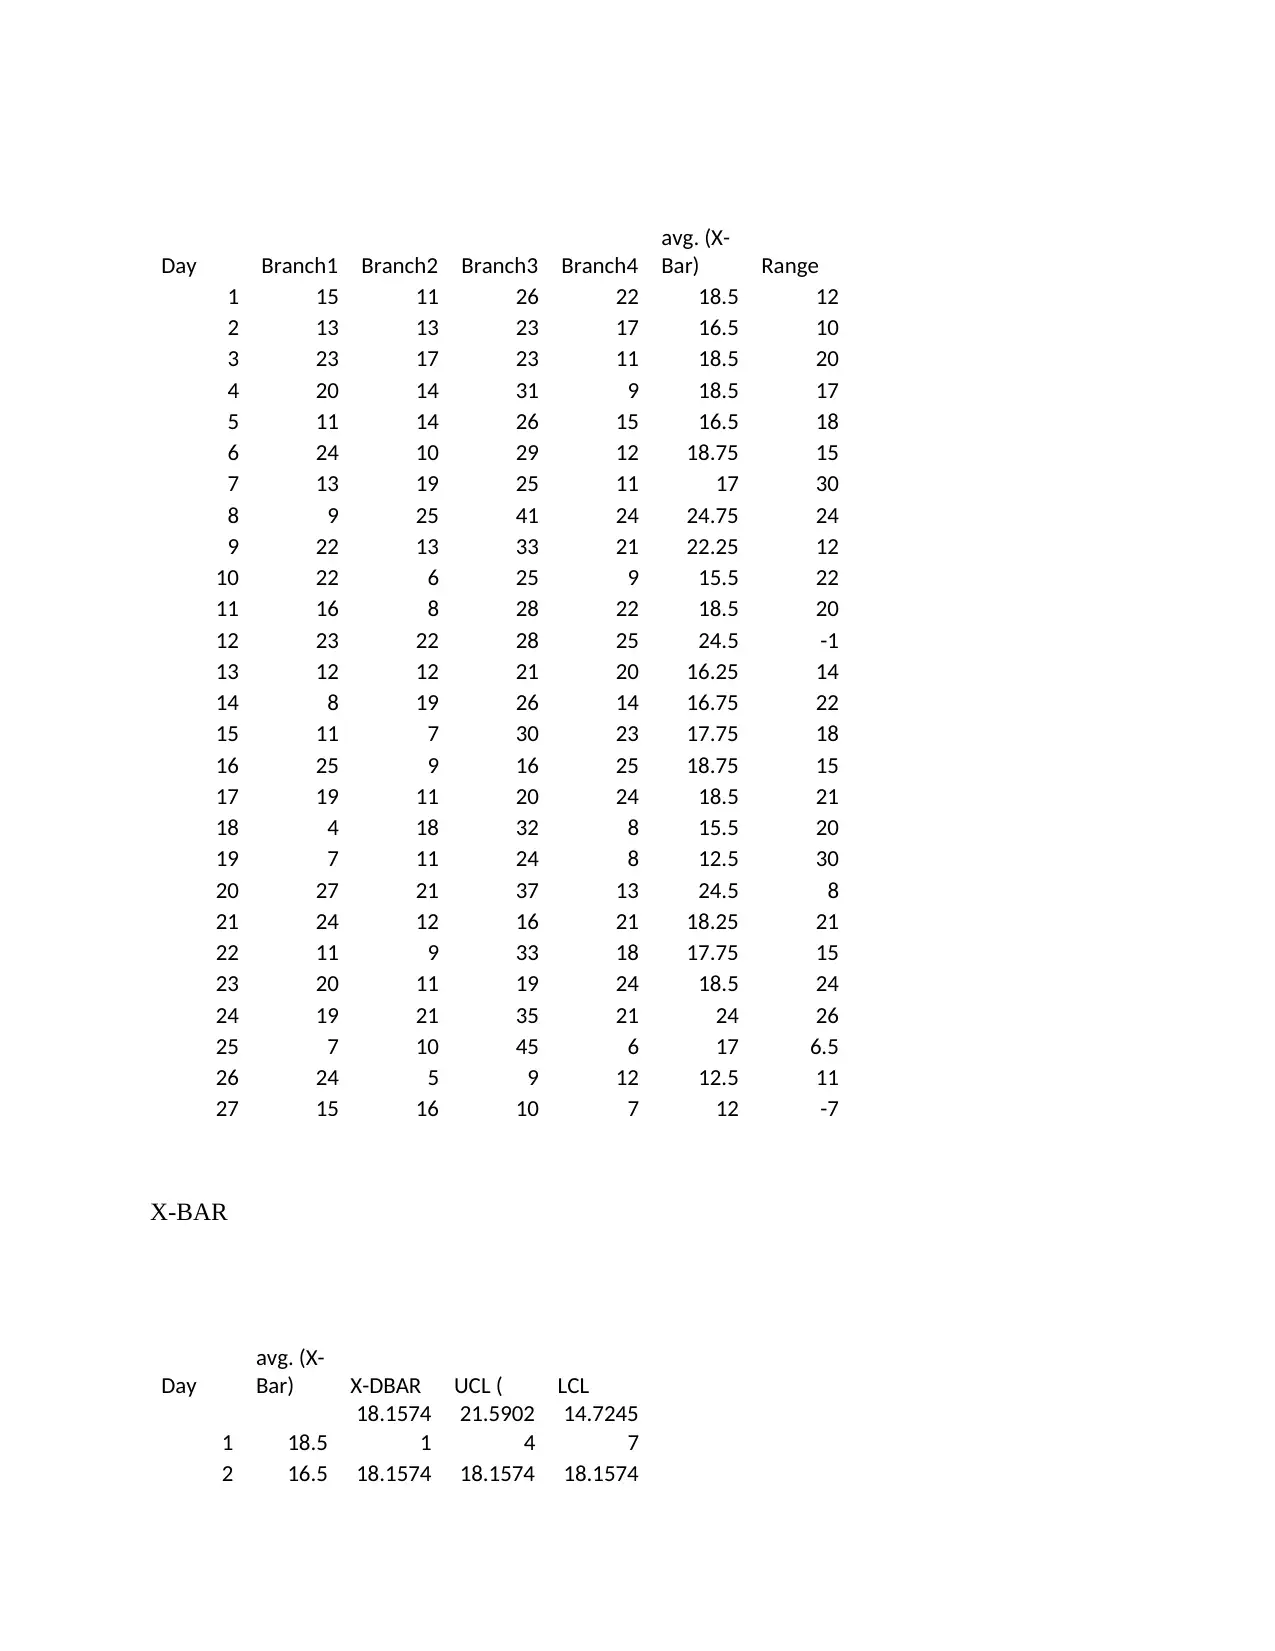
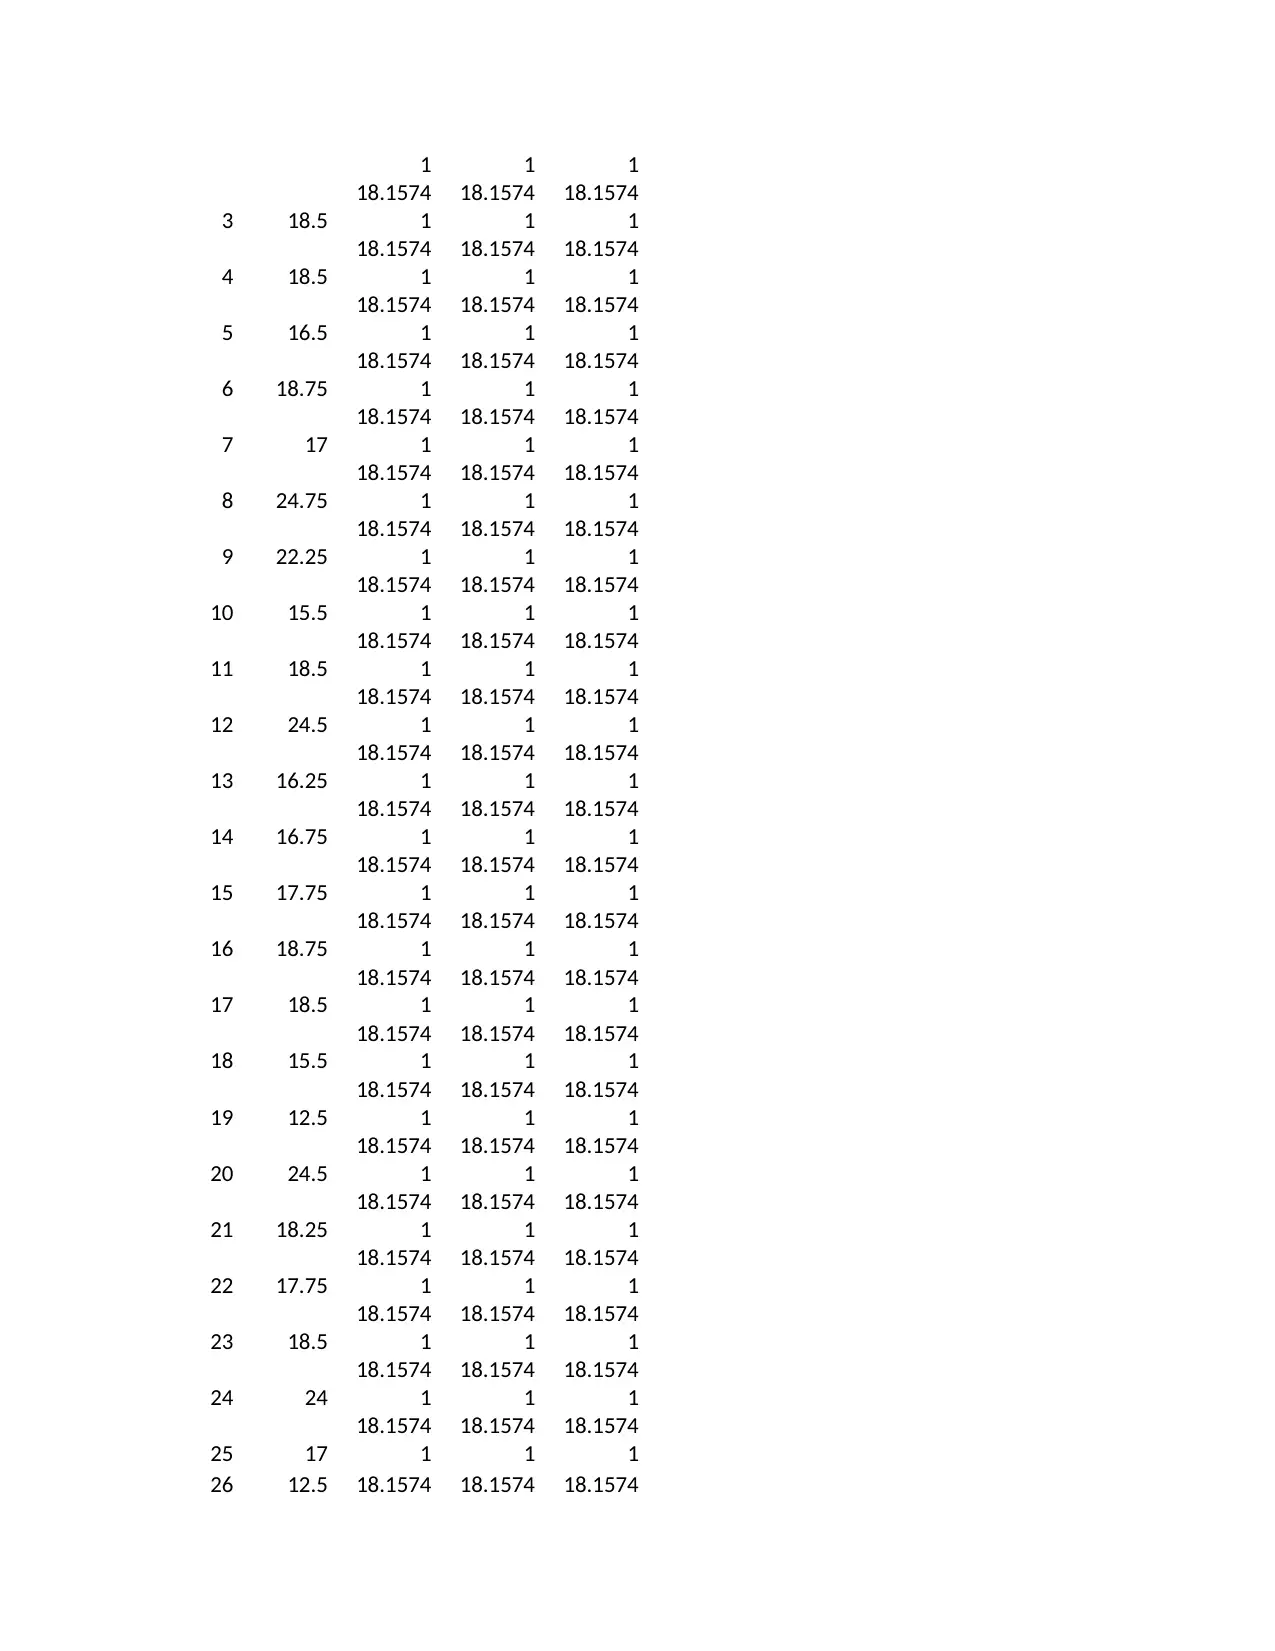
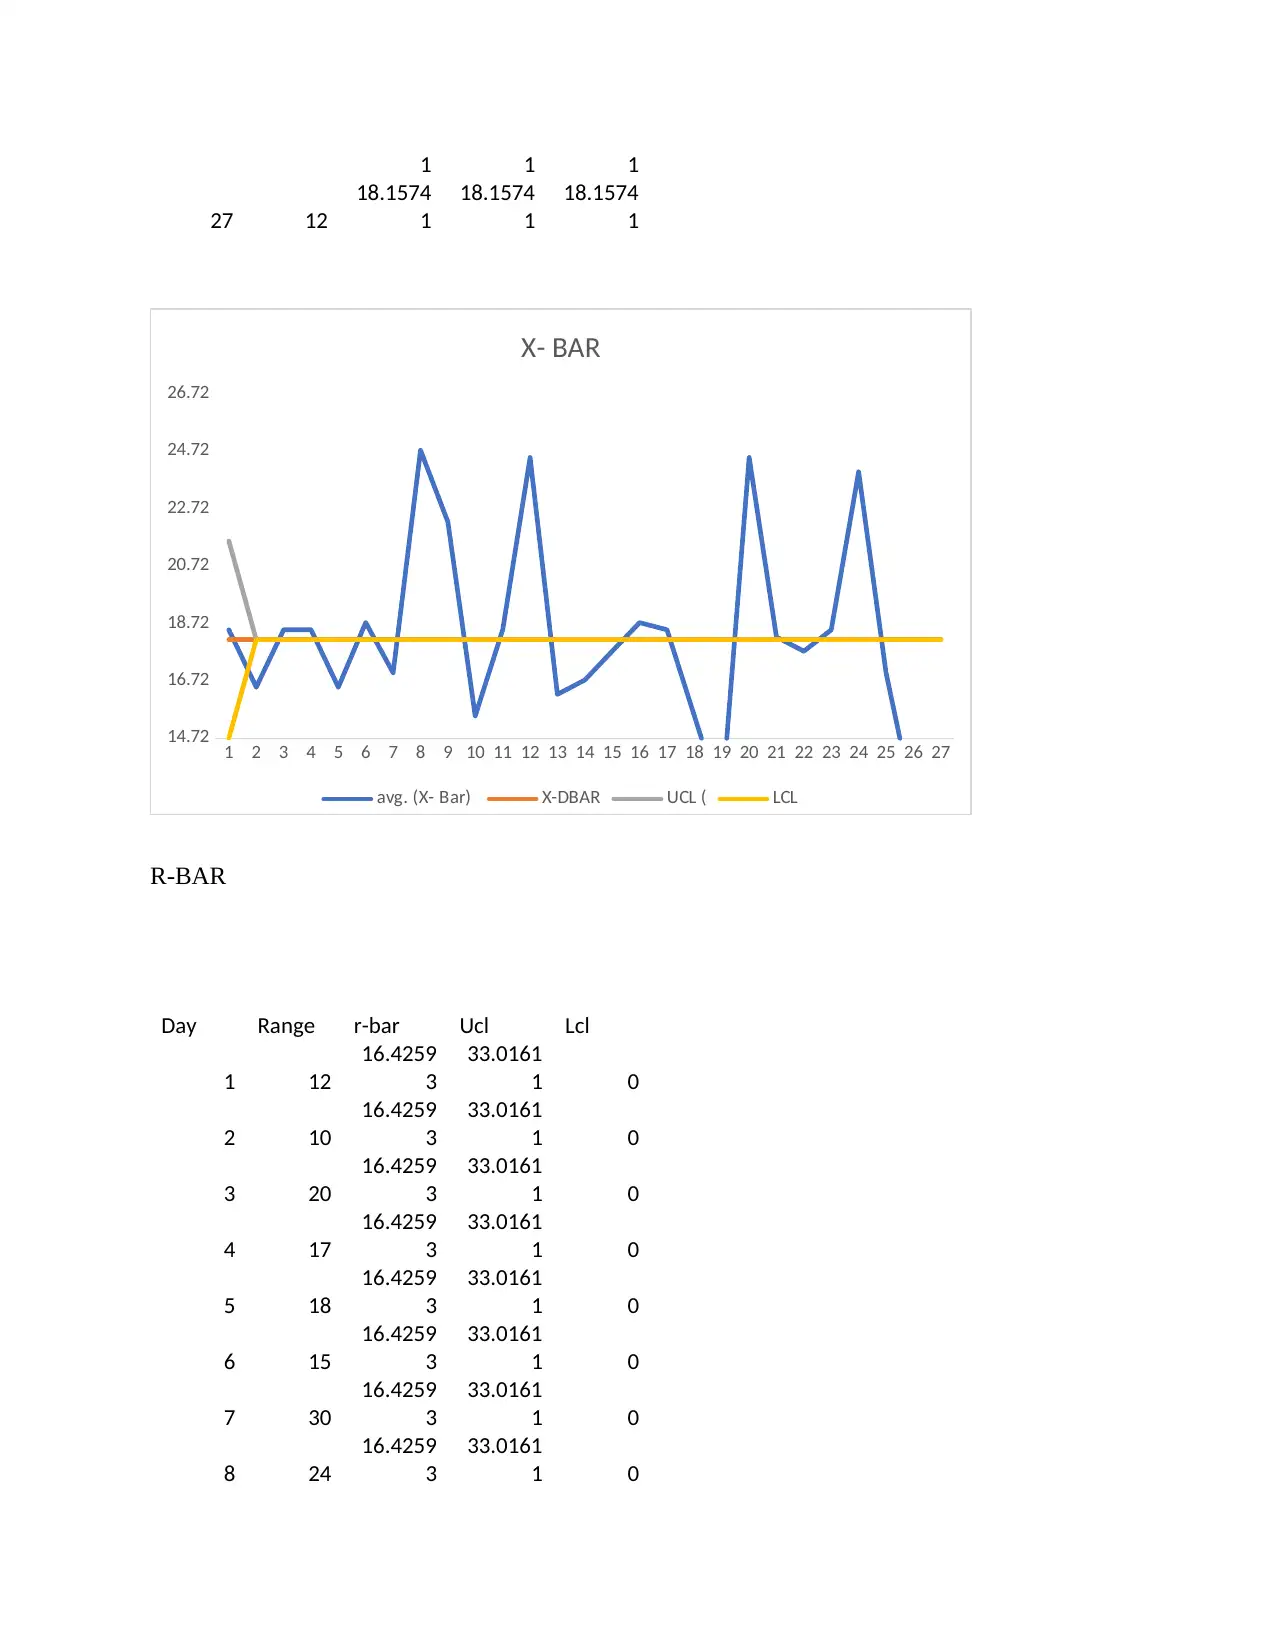
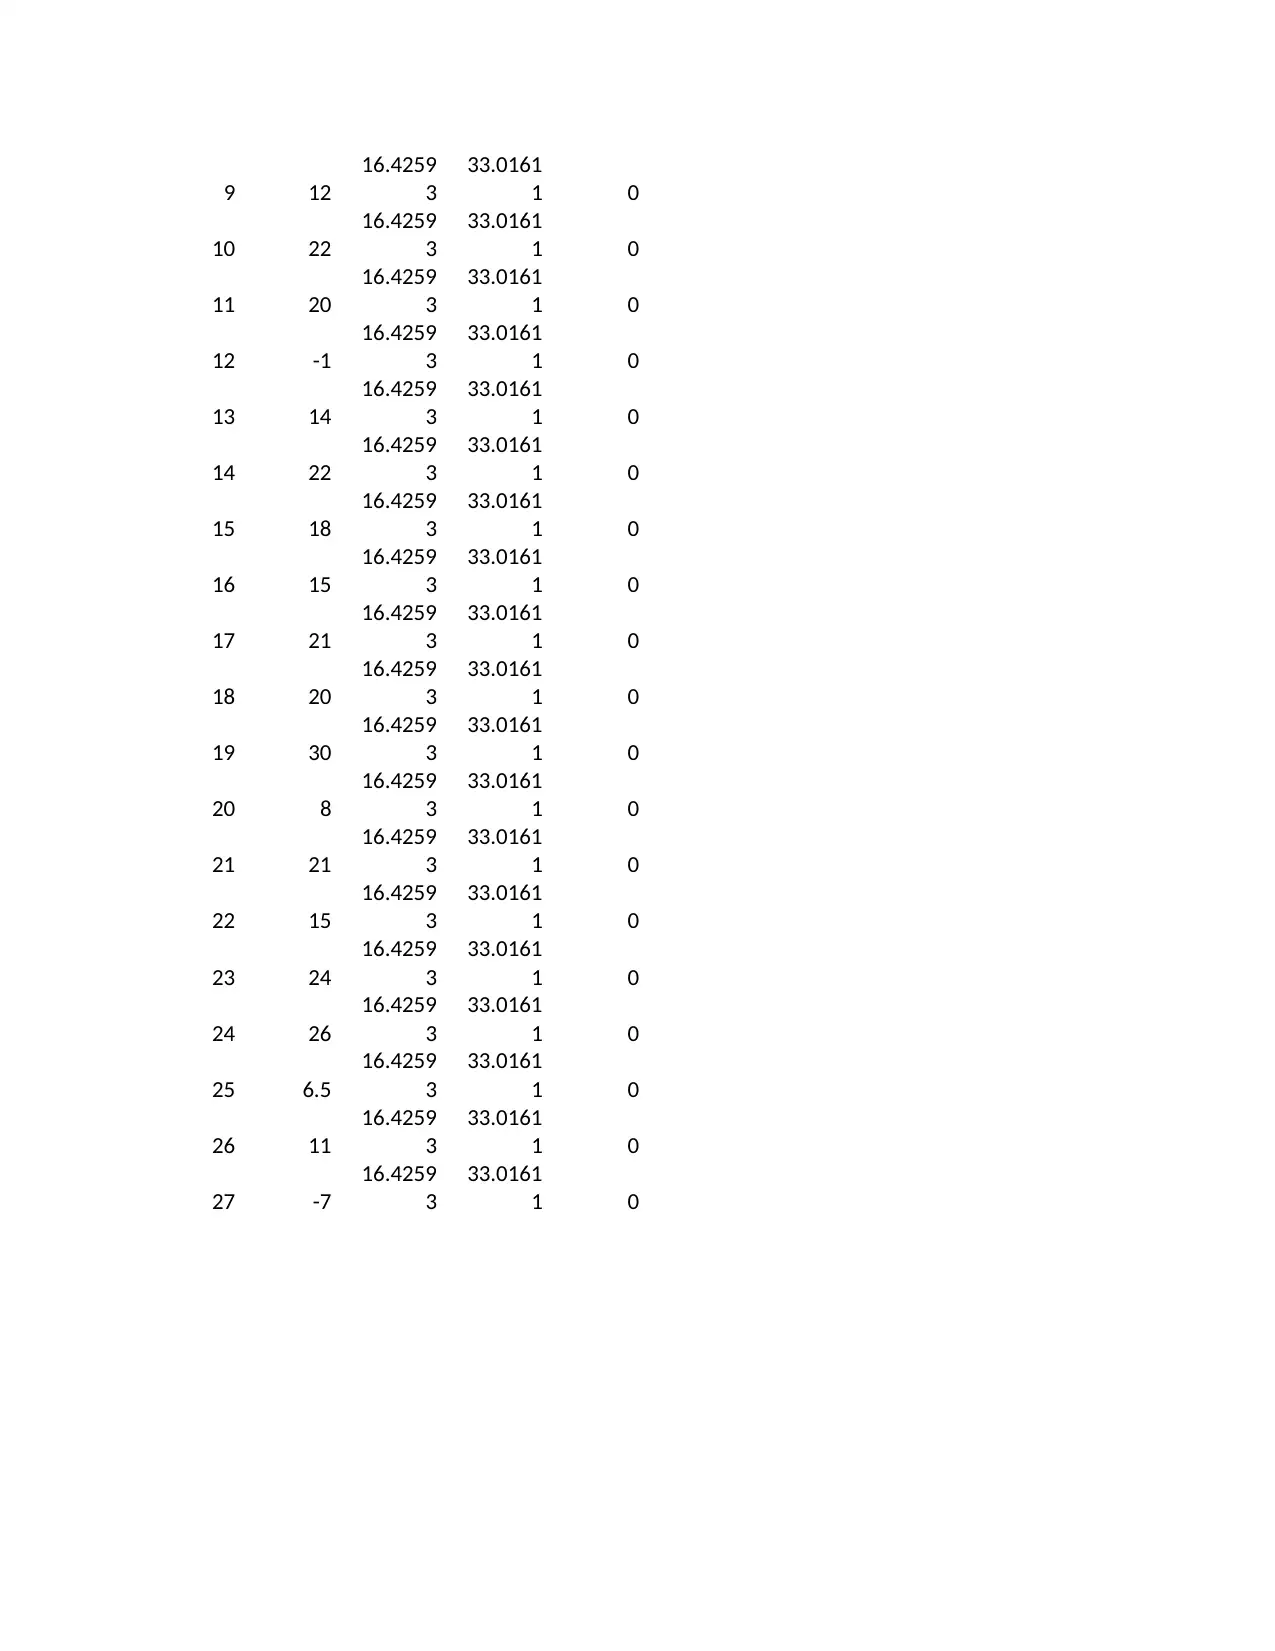
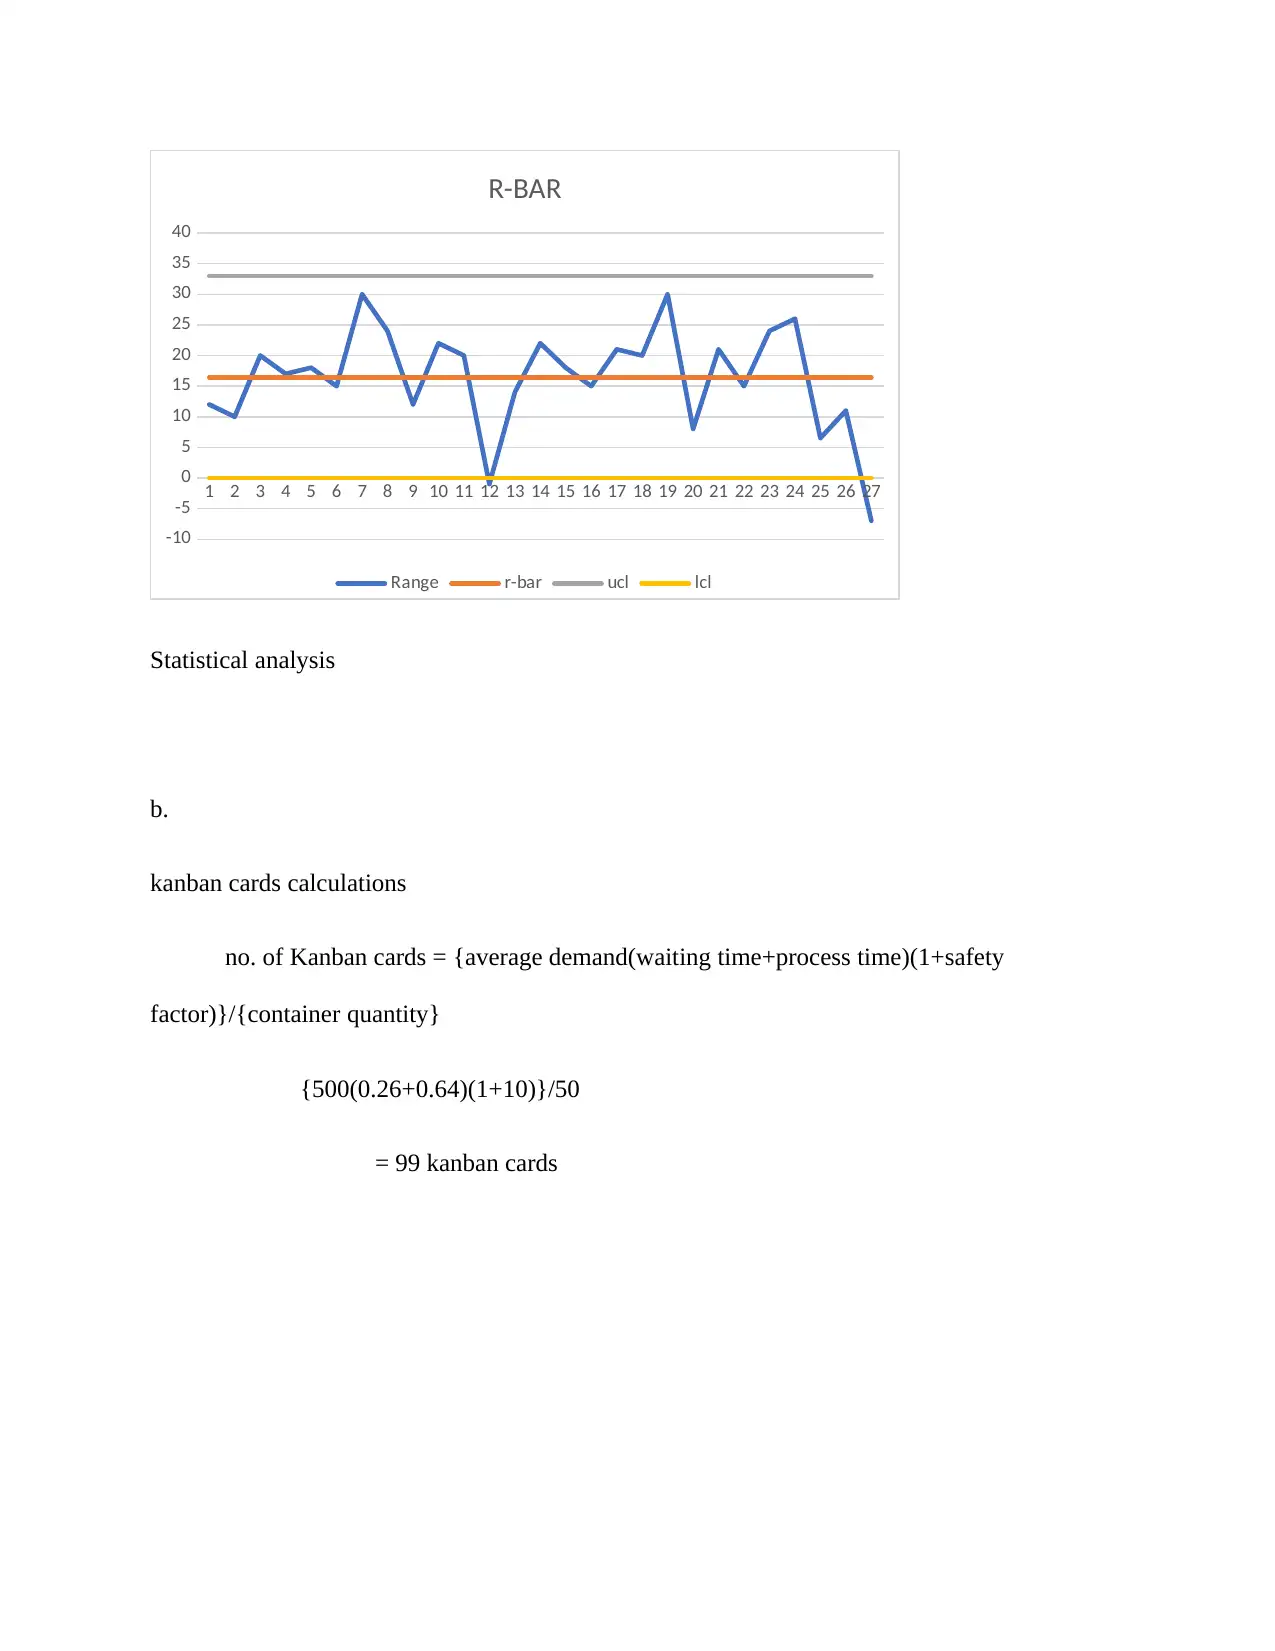
This report presents a statistical analysis of a company's operational processes across four branches, utilizing X-Bar and R-Bar charts to assess consistency and identify areas for improvement. The analysis covers 27 randomly selected dates, examining data averages and ranges to determine if processes stay within control limits. The X-Bar chart helps in assessing the average performance, while the R-Bar chart highlights the range of variation, with a focus on fluctuations and potential inefficiencies. The report also includes calculations for Kanban cards, a lean production tool, to optimize inventory management. The findings suggest that while most processes are manageable, fluctuations in certain branches and instances beyond control limits necessitate management attention to ensure efficiency, consistency, and optimal performance. The report emphasizes the importance of statistical analysis in making informed decisions and initiating corrective measures to avoid delays and losses. This comprehensive analysis provides valuable insights into process control and optimization within the organization.
1 out of 7
Related Documents


Your All-in-One AI-Powered Toolkit for Academic Success.
+13062052269
info@desklib.com
Available 24*7 on WhatsApp / Email
![[object Object]](/_next/static/media/star-bottom.7253800d.svg)
Copyright © 2020–2026 A2Z Services. All Rights Reserved. Developed and managed by ZUCOL.