Statistical Analysis Project: Residential Property Data Analysis

Verified

Added on Ā 2022/09/01

|7
|705
|19
Project
AI Summary
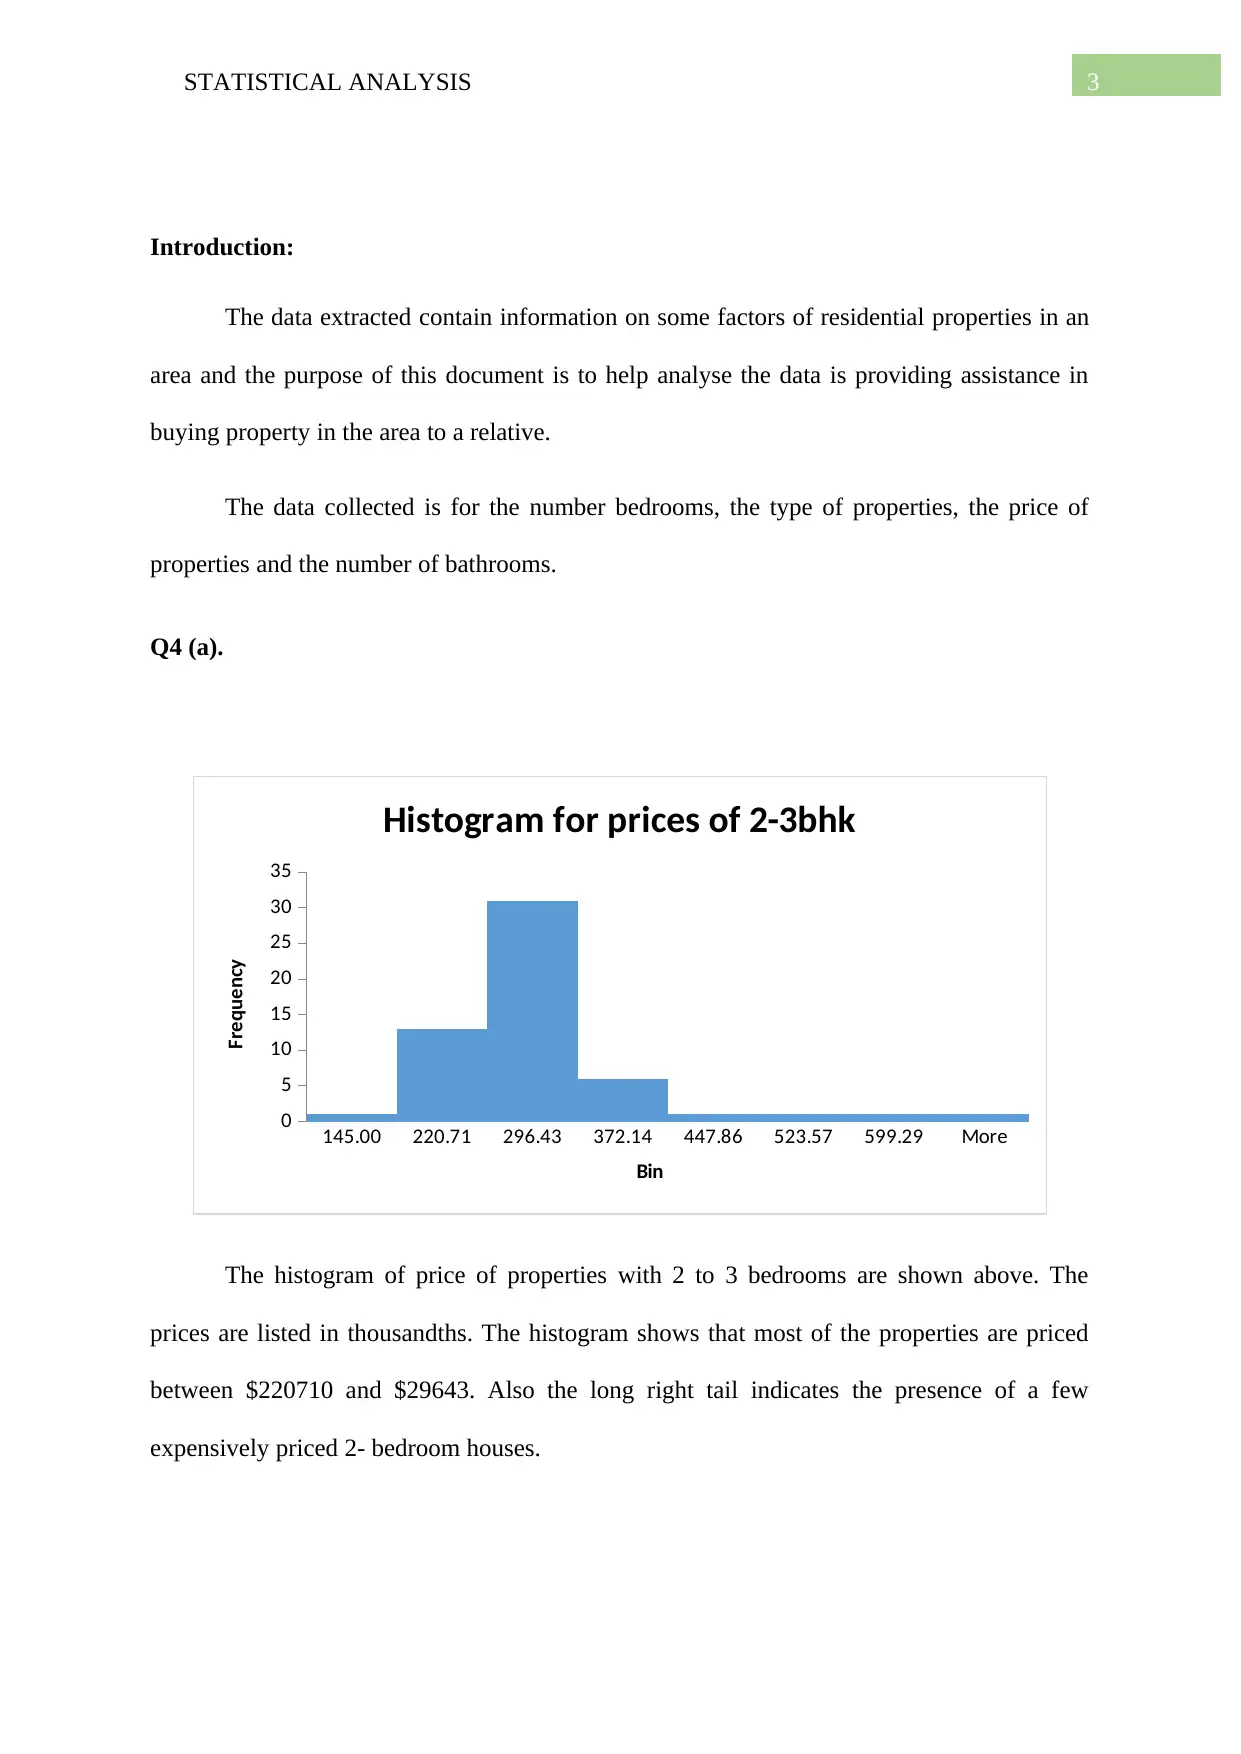
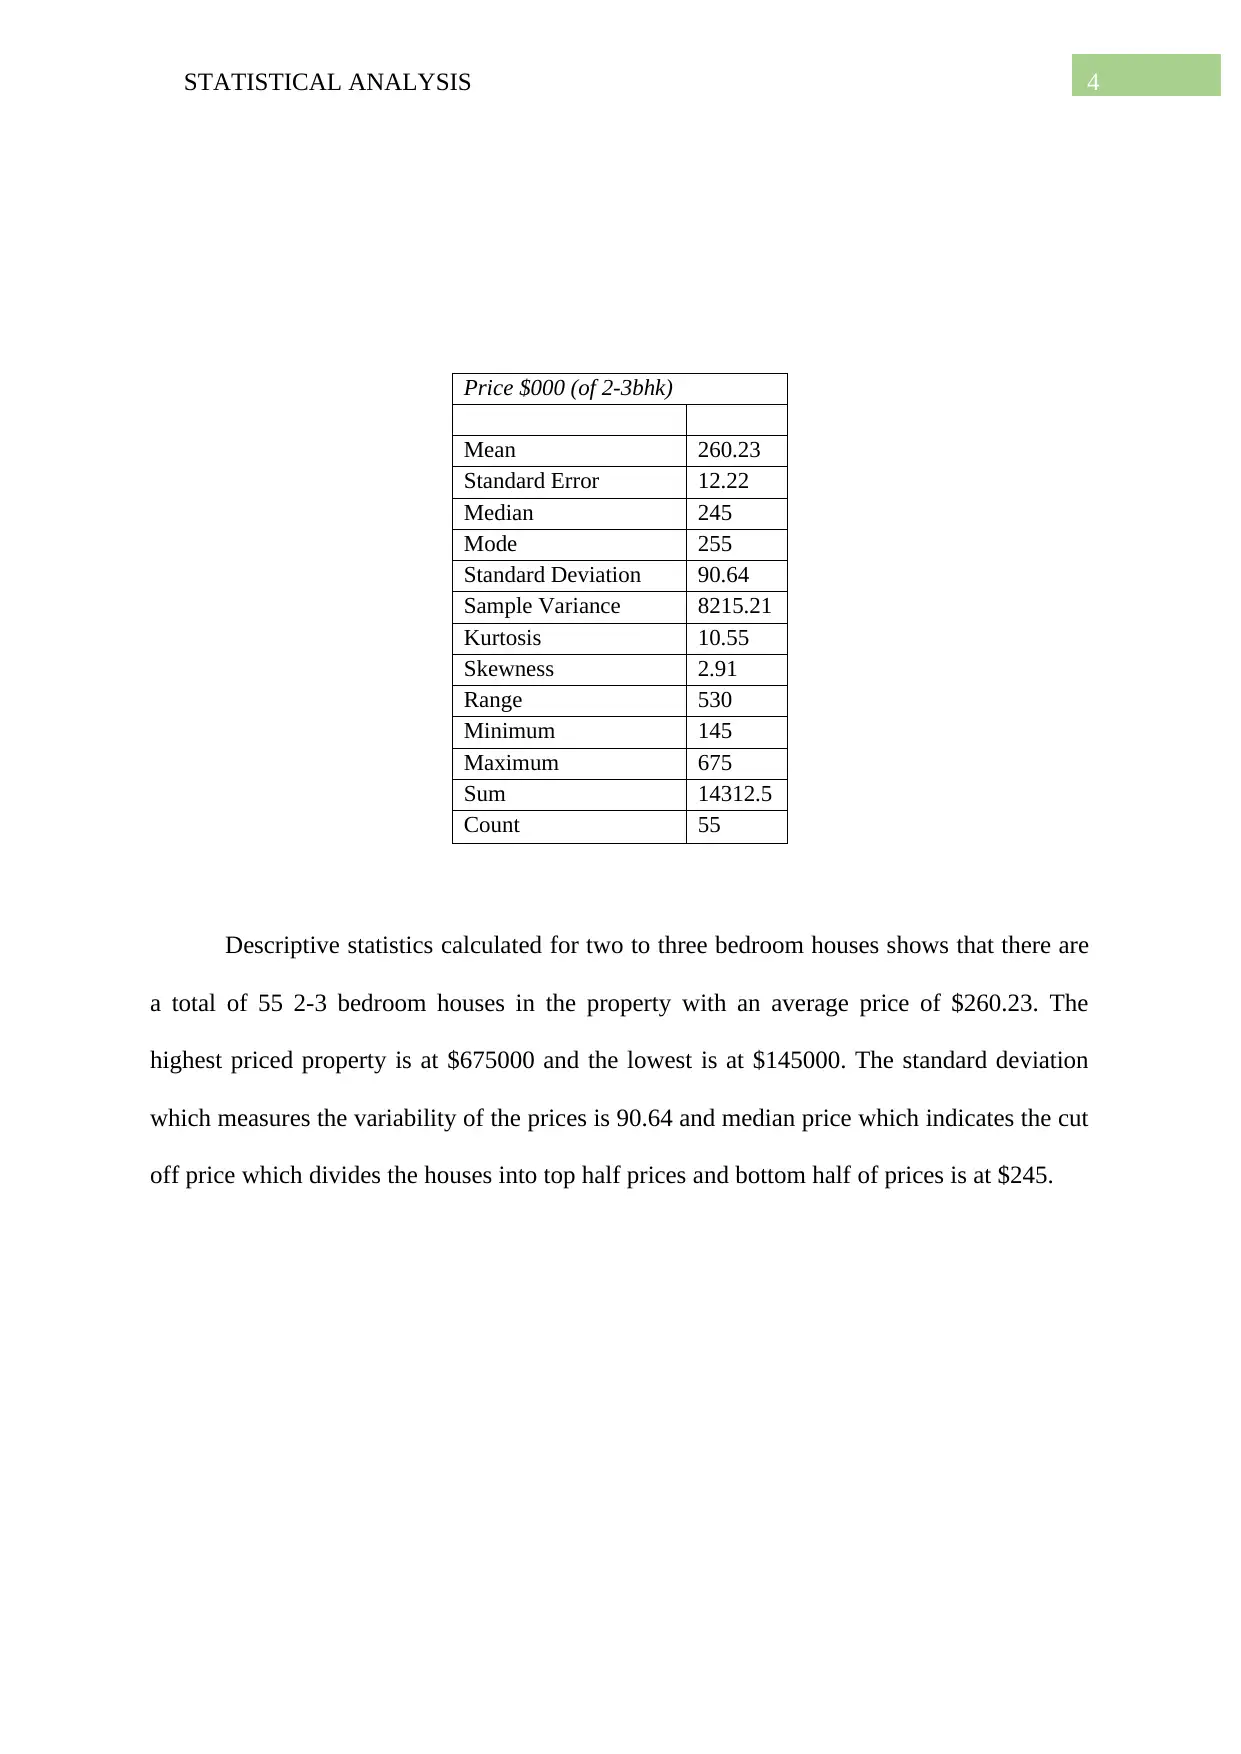
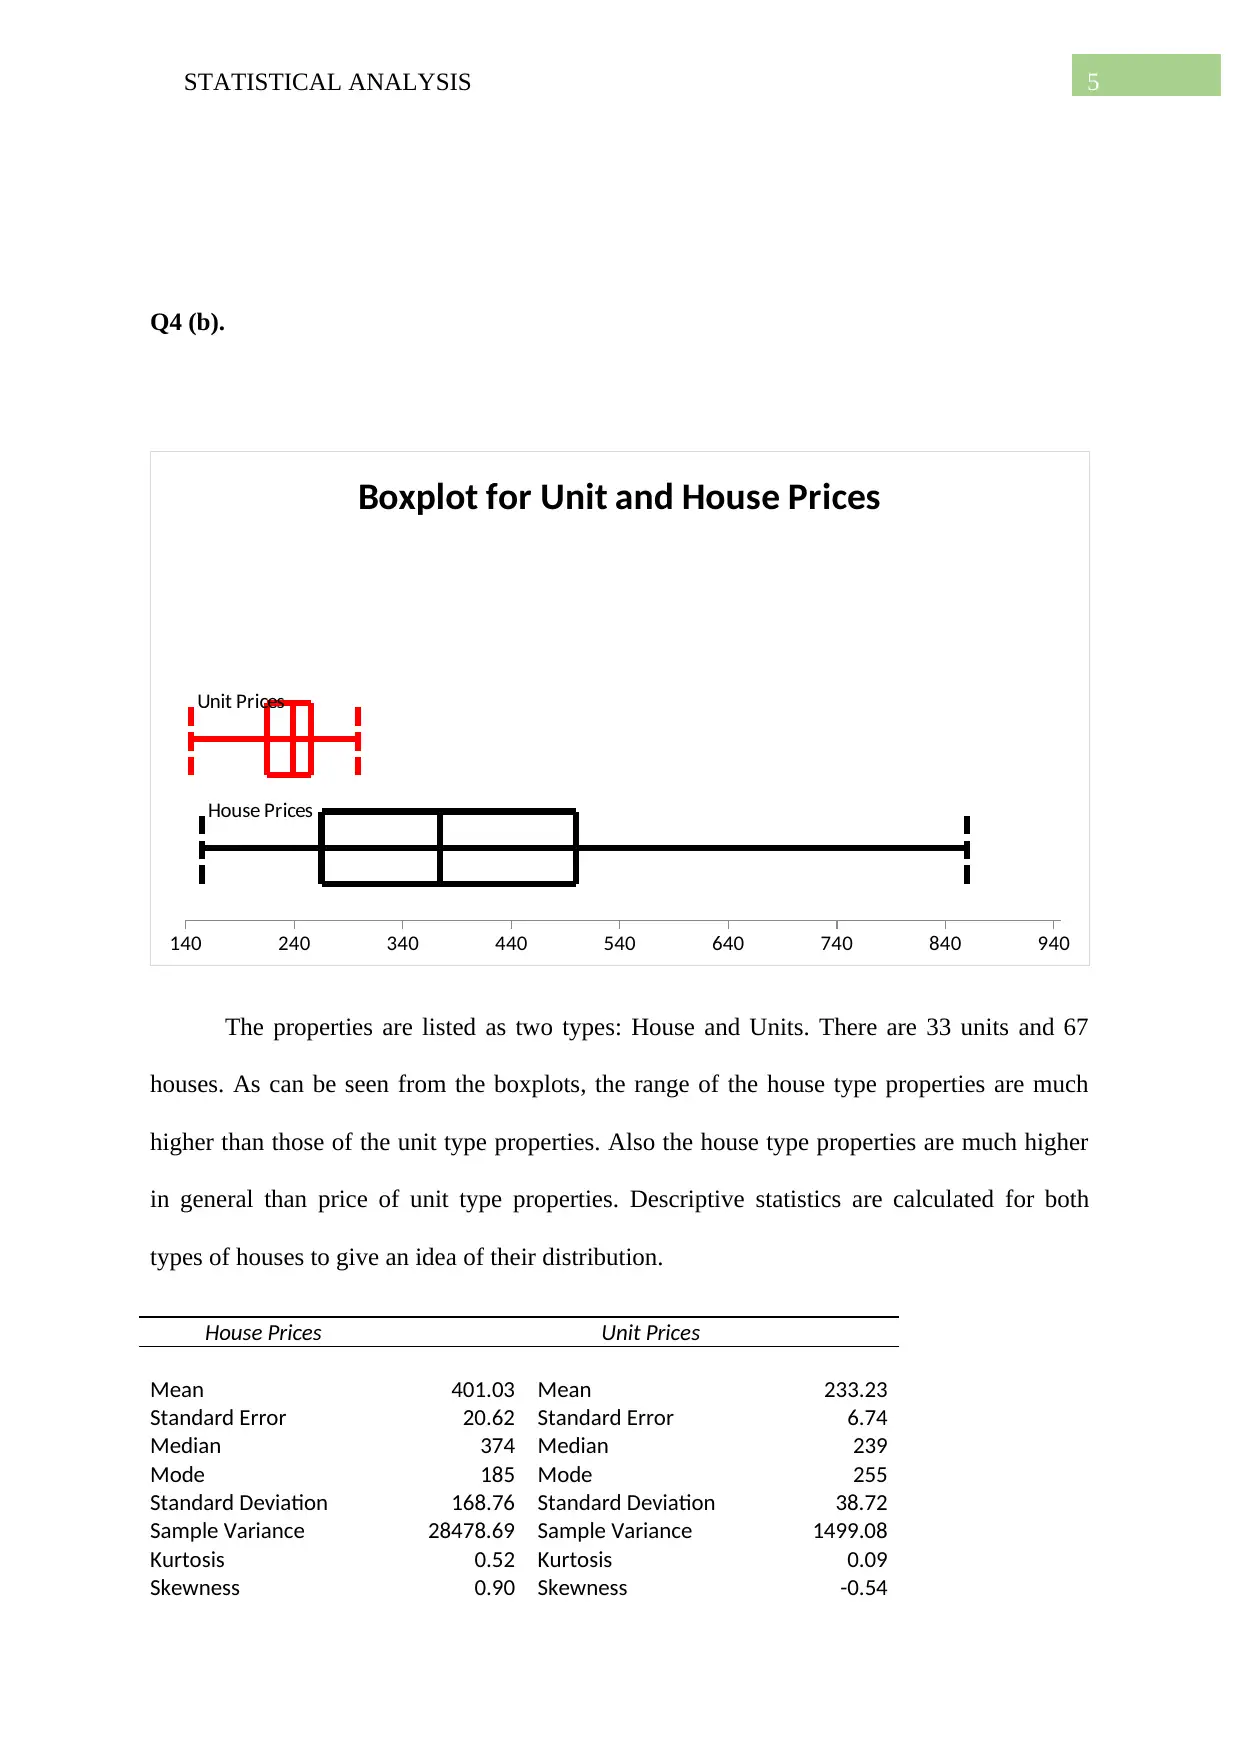
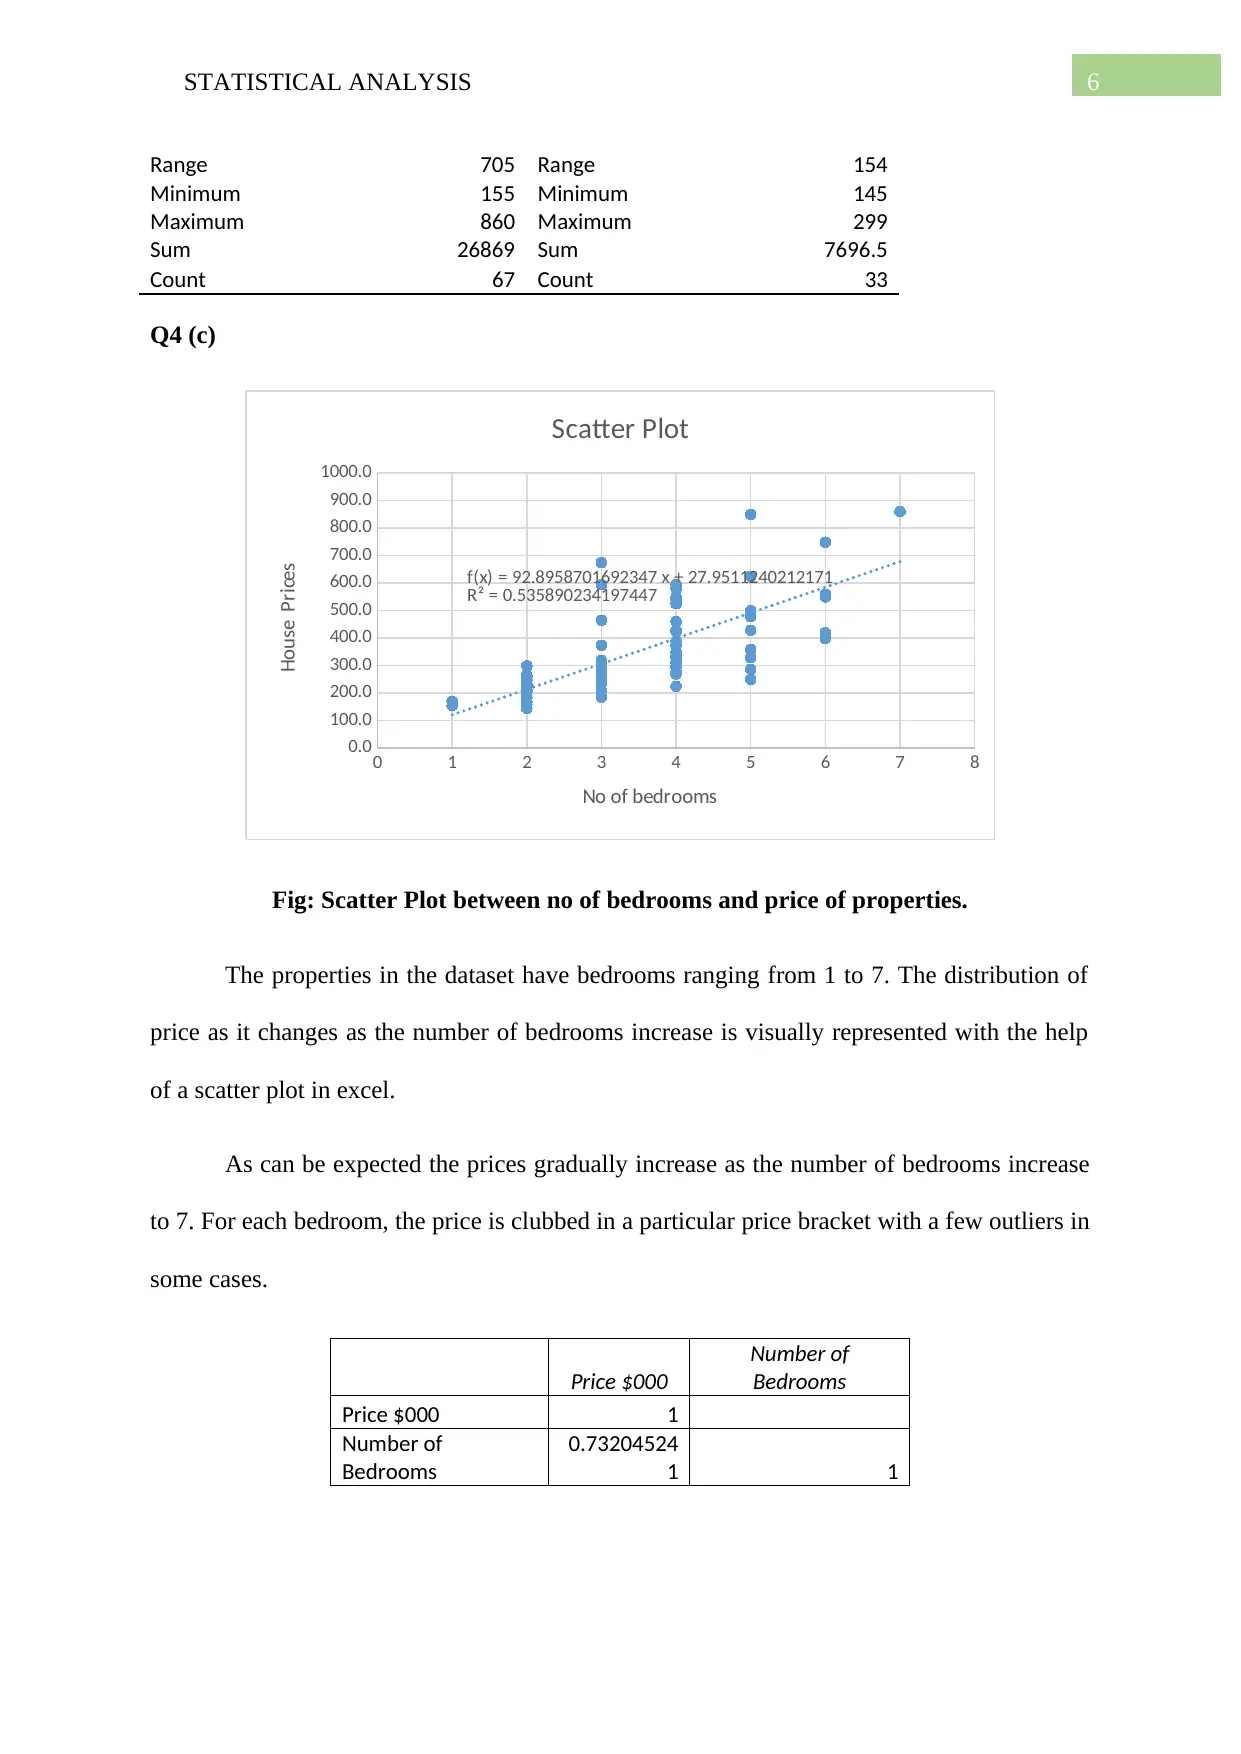
This project analyzes residential property data, focusing on price, number of bedrooms, and property type. The analysis includes histograms of property prices, descriptive statistics, and boxplots comparing house and unit prices. A scatter plot and correlation coefficient are used to examine the relationship between the number of bedrooms and property prices. The project uses data from realestate.com.au and covers topics like descriptive statistics, data visualization, and correlation, providing insights for potential property buyers. The student analyzes the data, calculates descriptive statistics, creates visualizations, and determines the correlation between variables, offering a comprehensive statistical overview of the property market.
tabler-icon-diamond-filled.svg

Contribute Materials

Your contribution can guide someoneā€™s learning journey. Share your documents today.
Document Page
Running head: STATISTICAL ANALYSIS
Statistical Analysis
Name of the Student
Name of the University
tabler-icon-diamond-filled.svg

Secure Best Marks with AI Grader

Need help grading? Try our AI Grader for instant feedback on your assignments.
Document Page
2STATISTICAL ANALYSIS
Table of Contents
Introduction:...............................................................................................................................3
Q4 (a).........................................................................................................................................3
Q4 (b).........................................................................................................................................5
Q4 (c).........................................................................................................................................6
Bibliographies:...........................................................................................................................7
Document Page
3STATISTICAL ANALYSIS
Introduction:
The data extracted contain information on some factors of residential properties in an
area and the purpose of this document is to help analyse the data is providing assistance in
buying property in the area to a relative.
The data collected is for the number bedrooms, the type of properties, the price of
properties and the number of bathrooms.
Q4 (a).
145.00 220.71 296.43 372.14 447.86 523.57 599.29 More
0
5
10
15
20
25
30
35
Histogram for prices of 2-3bhk
Bin
Frequency
The histogram of price of properties with 2 to 3 bedrooms are shown above. The
prices are listed in thousandths. The histogram shows that most of the properties are priced
between $220710 and $29643. Also the long right tail indicates the presence of a few
expensively priced 2- bedroom houses.
Document Page
4STATISTICAL ANALYSIS
Price $000 (of 2-3bhk)
Mean 260.23
Standard Error 12.22
Median 245
Mode 255
Standard Deviation 90.64
Sample Variance 8215.21
Kurtosis 10.55
Skewness 2.91
Range 530
Minimum 145
Maximum 675
Sum 14312.5
Count 55
Descriptive statistics calculated for two to three bedroom houses shows that there are
a total of 55 2-3 bedroom houses in the property with an average price of $260.23. The
highest priced property is at $675000 and the lowest is at $145000. The standard deviation
which measures the variability of the prices is 90.64 and median price which indicates the cut
off price which divides the houses into top half prices and bottom half of prices is at $245.
tabler-icon-diamond-filled.svg

Secure Best Marks with AI Grader

Need help grading? Try our AI Grader for instant feedback on your assignments.
Document Page
5STATISTICAL ANALYSIS
Q4 (b).
140 240 340 440 540 640 740 840 940
Unit Prices
House Prices
Boxplot for Unit and House Prices
The properties are listed as two types: House and Units. There are 33 units and 67
houses. As can be seen from the boxplots, the range of the house type properties are much
higher than those of the unit type properties. Also the house type properties are much higher
in general than price of unit type properties. Descriptive statistics are calculated for both
types of houses to give an idea of their distribution.
House Prices Unit Prices
Mean 401.03 Mean 233.23
Standard Error 20.62 Standard Error 6.74
Median 374 Median 239
Mode 185 Mode 255
Standard Deviation 168.76 Standard Deviation 38.72
Sample Variance 28478.69 Sample Variance 1499.08
Kurtosis 0.52 Kurtosis 0.09
Skewness 0.90 Skewness -0.54
Document Page
6STATISTICAL ANALYSIS
Range 705 Range 154
Minimum 155 Minimum 145
Maximum 860 Maximum 299
Sum 26869 Sum 7696.5
Count 67 Count 33
Q4 (c)
0 1 2 3 4 5 6 7 8
0.0
100.0
200.0
300.0
400.0
500.0
600.0
700.0
800.0
900.0
1000.0
f(x) = 92.8958701692347 x + 27.9511240212171
RĀ² = 0.535890234197447
Scatter Plot
No of bedrooms
House Prices
Fig: Scatter Plot between no of bedrooms and price of properties.
The properties in the dataset have bedrooms ranging from 1 to 7. The distribution of
price as it changes as the number of bedrooms increase is visually represented with the help
of a scatter plot in excel.
As can be expected the prices gradually increase as the number of bedrooms increase
to 7. For each bedroom, the price is clubbed in a particular price bracket with a few outliers in
some cases.
Price $000
Number of
Bedrooms
Price $000 1
Number of
Bedrooms
0.73204524
1 1
Document Page
7STATISTICAL ANALYSIS
The correlation coefficient for the number of bedrooms and prices of properties is 0.73. This
indicates a strong, positive linear correlation between the two variables as is evident from the
scatter plot.
Bibliographies:
Anderson, D.R., Sweeney, D.J., Williams, T.A., Camm, J.D. and Cochran, J.J., 2020. Modern
business statistics with Microsoft Excel. Cengage Learning.
Anderson, D.R., Sweeney, D.J., Williams, T.A., Camm, J.D. and Cochran, J.J.,
2016. Statistics for business & economics. Nelson Education.
Jaggia, S., Kelly, A., Salzman, S., Olaru, D., Sriananthakumar, S., Beg, R. and Leighton, C.,
2016. Essentials of Business Statistics: communicating with numbers. McGrawhill Education.
Siegel, A., 2016. Practical business statistics. Academic Press.
chevron_up_icon
1 out of 7
circle_padding
hide_on_mobile
zoom_out_icon
logo.png

Your All-in-One AI-Powered Toolkit for Academic Success.

Available 24*7 on WhatsApp / Email

[object Object]