Statistical Analysis of Puma: A Business Development Report
VerifiedAdded on 2022/01/19
|18
|4712
|474
Report
AI Summary
This report presents a comprehensive statistical analysis, focusing on the application of statistical methods and data analysis within a business context, using Puma as a case study. The report begins with an introduction to Puma, its mission, vision, and objectives, followed by an executive summary. The main body delves into statistical analysis, defining statistics, and exploring various types, including descriptive and inferential statistics. It examines key characteristics of statistics, their importance, and different data sources and types, such as primary and secondary, quantitative and qualitative, and raw versus frequency data. The report further discusses statistical methods, including descriptive, exploratory, and confirmatory research, along with deductive and inductive approaches. It then applies these concepts to Puma, analyzing financial, human resources, manufacturing, and marketing data. The report also evaluates the suitability of different data analysis types and concludes with recommendations and a conclusion based on the findings. The report emphasizes the importance of statistical analysis in understanding market trends, consumer behavior, and business performance, providing valuable insights for strategic decision-making.

Unit (31 )
Statistic Management
Summited By: Ma Kay Zin Tun
Summited To: Daw Thinzar Khine
1
Statistic Management
Summited By: Ma Kay Zin Tun
Summited To: Daw Thinzar Khine
1
Paraphrase This Document
Need a fresh take? Get an instant paraphrase of this document with our AI Paraphraser
Content
Content ………………………………………………………………………………. ….2
PART (ONE)INTRODUCTION……………………………………………….………...…4
Iintroductions ………………………………………………………………………………4
Mission………………………………………………………………………………………4
Vision ………………………………………………………………………………………4
Objectives …………………………………………………………………………......……4
PART (TWO)EXEUTIVE SUMMARY…………………………………………..…….…5
PART (THREE)MAIN BODY PART…………………………………………………..….5
Statistical Analysis ………………………………………………………………………….5
Statistic Definition ……………………………………………………………………….…5
Types of Statistics…………………………………………………………………………….5
Descriptive Statistic…………………………………………………………………..………6
Key characteristics of statistics……………………………………………………………….6
Importance of Statistics…………………………………………………………………….....7
Sources and types of data ……………………………………………………………………7
Primary data……………………………………………………………………………..……7
Secondary data …………………………………………………………………………….…7
Quantitative data ………………………………,………………………………………….…7
Discrete data vs Continuous data ……………………………………………………………7
Qualitative data………………………………………………………………………………8
Raw Data (Ungrouped data) …………………………………………………………………8
Frequency Data (Grouped Data) ……………………………………………………………8
Statistical Methods and their values …………………………………………………………8
Descriptive Research …………………………………………………………………………9
2
Importance Descriptive Research………………………………………………………………9
Exploratory research ……………………………………………………………………………9
Confirmatory Research …………………………………………………………………………9
Relationship Between Confirmatory and Exploratory Research………………………………10
Deductive and Inductive Approaches and their Implications ……………………………….…10
Deductive approach…………………………………………………………………………….11
Usage of deductive approach with specific example…………………………………………...11
Inductive Approach……………………………………………………………………………11
Usage of Inductive approach with specific example ……………………………………….…11
Sample Sets of data applied in PUMA …………………………………………………….….12
Financial Data ………………………………………………………………………….……12-13
Human Resources Data ……………………………………………………………………..…13
Manufacturing Data ……………………………………………….……………………………13
Marketing Data ………………………………………………………………………………….13
Evaluation the suitability of one types of data analysis vs another………………………….…14
Difference between Descriptive and Inferential Statistics………………………………………14
PART(FOUR) RECOMMANDATION AND CONCLUSION……………………………….15
Recommendation…………………………………………………………………………….…15
Conclusion………………………………………………………………………………………15
References……………………………………………………………………………………16-17
3
⊘ This is a preview!⊘
Do you want full access?
Subscribe today to unlock all pages.
Trusted by 1+ million students worldwide
PART (ONE)INTRODUCTION
1. Introduction
Puma was founded in Dassler Schuhfabrik, Herzogenaurach, Germany by Rudolf Dassler after a
dispute with his brother Adi Dassler with whom they had founded the Dassler Schuhfabrik in
1924. Until early 2003 puma had a very poor brand image that show a decline in its market share
and prompted puma to change it strategic decisions to improve on its image, this process of
change was led by Jochen Zeitz Puma CEO based on phases one to four of strategic plan to
change puma’s image so that it can compete favorable in the marketplace and within a couple of
years Jochen Zeitz had change puma’s brand image into one of the most desirable and sought
after brand of sportswear and footwear worn both buy celebrities and fashion followers all over
the word.
This report is divided in three parts, Part one presents the factors that influenced puma to change
it brand image and it further goes to describe these factors under Macro-environmental analysis
basing on market trends, rivalry between customers and strategic group mapping.
The second part presents the puma’s resources and capabilities in terms of strengths and
weakness as well as virtuallity as seen as strengthens and the third part of the report presents
puma’s winning strategies basing on pumas situation that fits the company, sustainable
completive advantages and as a better performing company.
According to case study of Puma AG (in Thompson, A.A., Strickland, A.J. and Gamble, J.
(2005) Crafting and Executing Strategy (Fourteenth Edition), McGraw-Hill, New York, pages
C411- C432),
Puma’s Mission Statement
Puma’s corporate mission is “to be the Fastest Sports Brand in the world.” This mission
statement is encapsulated in the company’s mantra, “Forever Faster,” which highlights the
strategic aim of being ahead of the competition in the sporting goods, apparel, and accessories
industry.
Puma’s Vision Statement
Puma’s corporate vision is “to be the most desirable and sustainable Sportlifestyle company in
the world.” This vision statement aligns with “PUMAVision,” which is the corporation’s main
thrust for its sustainability efforts.
2. Objectives
Communicate that PUMA is the fashionable sports Brand
Increase online presence by 60%
Increase positive brand perception and brand loyalty by 40%
Increase brand awareness by 60%
4
Paraphrase This Document
Need a fresh take? Get an instant paraphrase of this document with our AI Paraphraser
Raise market share by 2%
PART (TWO)EXEUTIVE SUMMARY
3. EXEUTIVE SUMMARY
PUMA is the third largest athletic wear company in the world, based out of Germany .Despite
their renown brand name and various collaborations with a plethora of organizations and
celebrities, they have had struggles to remain relevant to their target market due to fast fashion
and market trends .By targeting young adults with a variety of different promotional tools.
PUMA can educate these consumers on their new, fashionable and innovative product offerings
and build up their brand loyalty and market share, thus reinvigorating the brand.
PART (THREE)MAIN BODY PART
4. Statistical Analysis
Statistical analysis is the collection and interpretation of data in order to uncover patterns and
trends. It is a component of data analytics. Statistical analysis can be used in situations like
gathering research interpretations, statistical modeling or designing surveys and studies. It can
also be useful for business intelligence organizations that have to work with large data volumes.
4.1 Statistic Definition
Statistics is the study of data collection, analysis, interpretation, presentation, and organizing in
a specific way. Mathematical methods used for different analytics include mathematical
analysis, linear algebra, stochastic analysis, the theory of measure-theoretical probability, and
differential equation. Collecting, classifying, organizing, and displaying numerical data is
associated with statistics. This helps one to grasp different outcomes from it and foresee several
possibilities of various events. Statistics discuss information, observations, and data in the form
of numerical data. We are able to find different indicators of central tendencies and the
divergence of various values from the center with the help of statistics.
The ability to analyze and interpret statistical data is a vital skill for researchers and
professionals from a wide variety of disciplines. You may need to make decisions on the basis
of statistical data, interpret statistical data in research papers, do your own research, and
interpret the data.
4.2 Types of Statistics
Statistics is mainly divided into the following two categories.
1. Descriptive statistics
2. Inferential statistics
4.3 Descriptive Statistics
In the descriptive statistics, the data is described in a summarized way. The summarization is
done from the sample of the population using different parameters like mean or standard
deviation. Descriptive statistics are a way of using charts, graphs, and summary measures to
organize, represent, and explain a set of data.
5
Data is typically arranged and displayed in tables or graphs summarizing details such as
histograms, pie charts, bars or scatter plots.
Descriptive statistics are just descriptive and thus do not require generalization beyond the
data collected.
4.4 Inferential Statistics
In the Inferential Statistics, we try to interpret the meaning of descriptive statistics. After the data
has been collected, analyzed, and summarised we use Inferential Statistics to describe the
meaning of the collected data.
Inferential Statistics use the probability principle to assess whether trends contained in the
research sample can be generalized to the larger population from which the sample
originally comes.
Inferential Statistics are intended to test hypotheses and investigate relationships between
variables and can be used to make population predictions.
Inferential Statistics are used to draw conclusions and inferences, i.e., to make valid
generalizations from samples.
5. Key characteristics of statistics
The important characteristics of Statistics are as follows:
Statistics are numerically expressed.
It has an aggregate of facts
Data are collected in systematic order
It should be comparable to each other
Data are collected for a planned purpose
5.1 Importance of Statistics
The important functions of statistics are:
Statistics helps in gathering information about the appropriate quantitative data
It depicts the complex data in the graphical form, tabular form and in diagrammatic
representation, to understand it easily
It provides the exact description and better understanding
It helps in designing the effective and proper planning of the statistical inquiry in any field
It gives valid inferences with the reliability measures about the population parameters from
the sample data
It helps to understand the variability pattern through the quantitative observations
6
⊘ This is a preview!⊘
Do you want full access?
Subscribe today to unlock all pages.
Trusted by 1+ million students worldwide
5.2 Sources and types of data
Primary data
The data which is Raw, original, and extracted directly from the official sources is known as
primary data. This type of data is collected directly by performing techniques such as
questionnaires, interviews, and surveys. The data collected must be according to the demand
and requirements of the target audience on which analysis is performed otherwise it would be a
burden in the data processing.
Secondary data
Secondary data is the data which has already been collected and reused again for some valid
purpose. This type of data is previously recorded from primary data and it has two types of
sources named internal source and external source.
5.3 Quantitative data
Quantitative data makes measuring various parameters controllable due to the ease of
mathematical derivations they come with. Quantitative data is usually collected for statistical
analysis using surveys, polls or questionnaires sent across to a specific section of a population.
The retrieved results can be established across a population.
5.4 Discrete data vs Continuous data
Both data types are important for statistical analysis. However, some major differences need to
be noted before drawing any conclusions or making decisions. The key differences are:
Discrete data is the type of data that has clear spaces between values. Continuous data is data that
falls in a constant sequence.Discrete data is countable while continuous measurable.
To accurately represent discrete data, the bar graph is used. Histogram or line graphs are used to
represent continuous data graphically. A diagram of the discrete function shows a distinct point
that remains unconnected. While in a continuous function graph, the points are connected with
an unbroken line.
Discrete data contains distinct or separate values. Continuous data includes any value within the
preferred range.
7
Paraphrase This Document
Need a fresh take? Get an instant paraphrase of this document with our AI Paraphraser
5.5 Qualitative data
Qualitative data is defined as the data that approximates and characterizes.Qualitative data can be
observed and recorded. This data type is non-numerical in nature. This type of data is collected
through methods of observations, one-to-one interviews, conducting focus groups, and similar
methods. Qualitative data in statistics is also known as categorical data – data that can be
arranged categorically based on the attributes and properties of a thing or a phenomenon.
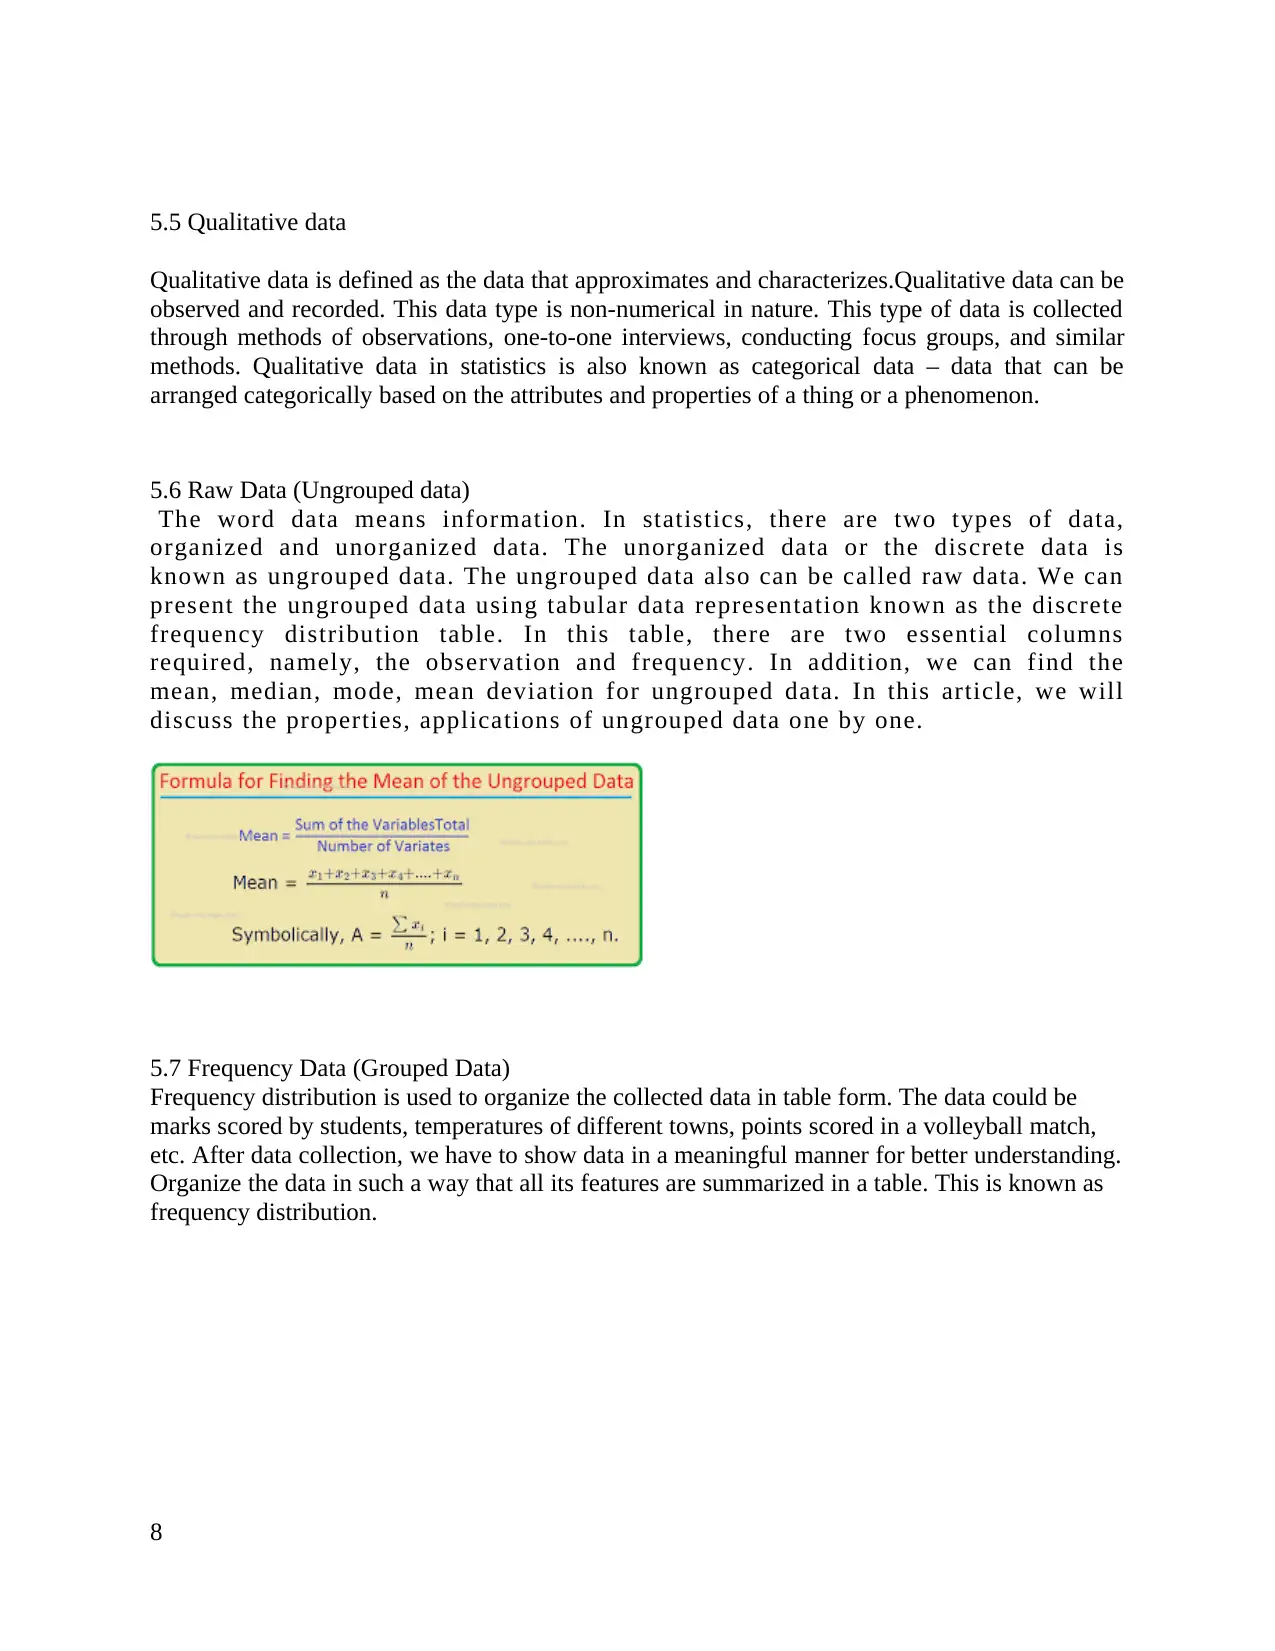
5.6 Raw Data (Ungrouped data)
The word data means information. In statistics, there are two types of data,
organized and unorganized data. The unorganized data or the discrete data is
known as ungrouped data. The ungrouped data also can be called raw data. We can
present the ungrouped data using tabular data representation known as the discrete
frequency distribution table. In this table, there are two essential columns
required, namely, the observation and frequency. In addition, we can find the
mean, median, mode, mean deviation for ungrouped data. In this article, we will
discuss the properties, applications of ungrouped data one by one.
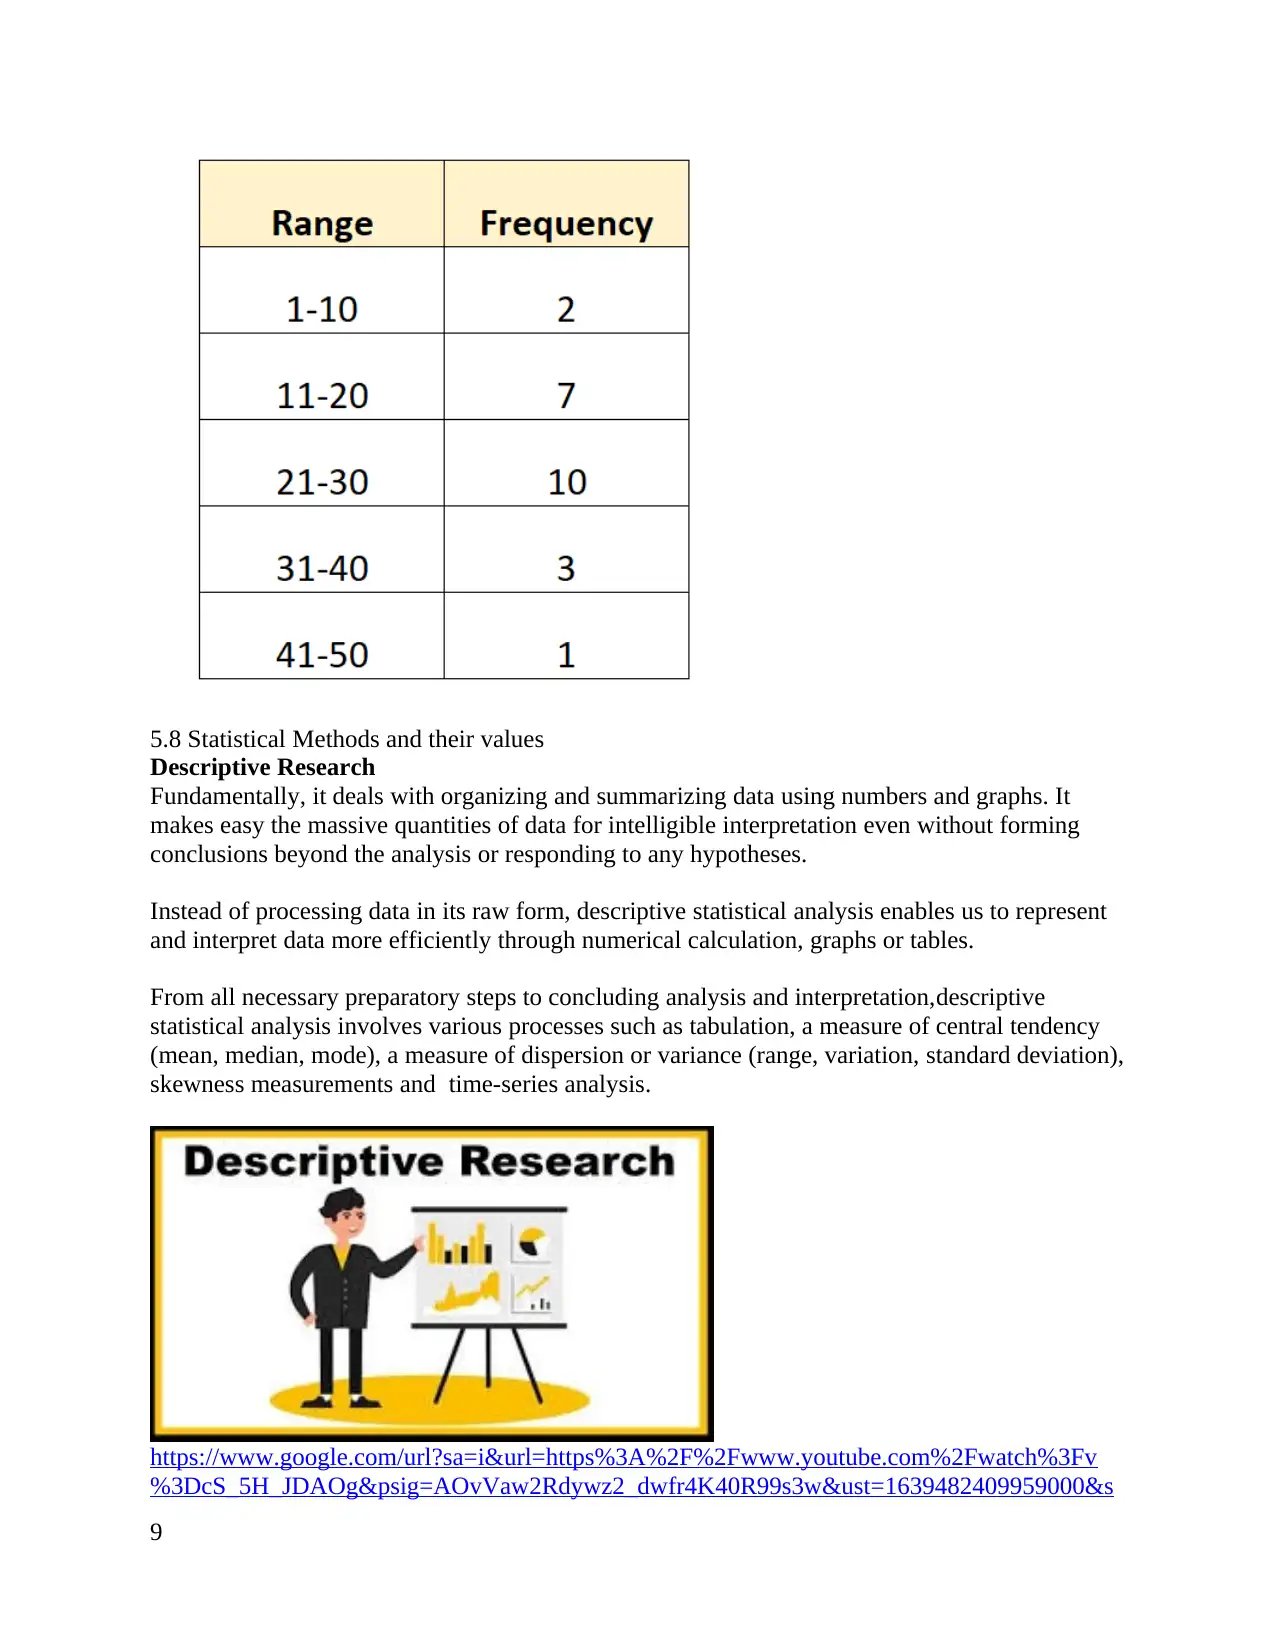
5.7 Frequency Data (Grouped Data)
Frequency distribution is used to organize the collected data in table form. The data could be
marks scored by students, temperatures of different towns, points scored in a volleyball match,
etc. After data collection, we have to show data in a meaningful manner for better understanding.
Organize the data in such a way that all its features are summarized in a table. This is known as
frequency distribution.
8
Qualitative data is defined as the data that approximates and characterizes.Qualitative data can be
observed and recorded. This data type is non-numerical in nature. This type of data is collected
through methods of observations, one-to-one interviews, conducting focus groups, and similar
methods. Qualitative data in statistics is also known as categorical data – data that can be
arranged categorically based on the attributes and properties of a thing or a phenomenon.
5.6 Raw Data (Ungrouped data)
The word data means information. In statistics, there are two types of data,
organized and unorganized data. The unorganized data or the discrete data is
known as ungrouped data. The ungrouped data also can be called raw data. We can
present the ungrouped data using tabular data representation known as the discrete
frequency distribution table. In this table, there are two essential columns
required, namely, the observation and frequency. In addition, we can find the
mean, median, mode, mean deviation for ungrouped data. In this article, we will
discuss the properties, applications of ungrouped data one by one.
5.7 Frequency Data (Grouped Data)
Frequency distribution is used to organize the collected data in table form. The data could be
marks scored by students, temperatures of different towns, points scored in a volleyball match,
etc. After data collection, we have to show data in a meaningful manner for better understanding.
Organize the data in such a way that all its features are summarized in a table. This is known as
frequency distribution.
8
5.8 Statistical Methods and their values
Descriptive Research
Fundamentally, it deals with organizing and summarizing data using numbers and graphs. It
makes easy the massive quantities of data for intelligible interpretation even without forming
conclusions beyond the analysis or responding to any hypotheses.
Instead of processing data in its raw form, descriptive statistical analysis enables us to represent
and interpret data more efficiently through numerical calculation, graphs or tables.
From all necessary preparatory steps to concluding analysis and interpretation,descriptive
statistical analysis involves various processes such as tabulation, a measure of central tendency
(mean, median, mode), a measure of dispersion or variance (range, variation, standard deviation),
skewness measurements and time-series analysis.
https://www.google.com/url?sa=i&url=https%3A%2F%2Fwww.youtube.com%2Fwatch%3Fv
%3DcS_5H_JDAOg&psig=AOvVaw2Rdywz2_dwfr4K40R99s3w&ust=1639482409959000&s
9
⊘ This is a preview!⊘
Do you want full access?
Subscribe today to unlock all pages.
Trusted by 1+ million students worldwide
ource=images&cd=vfe&ved=2ahUKEwiKvMeG2uD0AhXnkdgFHWl5CbUQr4kDegUIARD7A
Q
5.9 Importance Descriptive Research
For Scientific basis of judgment. This means that descriptive research provides information
which could be used as basis for important decision that are to be made.For a closer look into
happenings, behavior practice, method and procedures. Descriptive research provides essential
facts understanding about the nature of anything.
6 Exploratory research
Exploratory research is defined as a research used to investigate a problem which is not clearly
defined. It is conducted to have a better understanding of the existing problem, but will not
provide conclusive results.Also called grounded theory approach or interpretive research,
exploratory research helps answer questions like the “what,” “why” and “how.”
6.1 Confirmatory Research
Confirmatory research are research that test the validity of already made hypothesis, known as
a priori hypothesis. This means that possibly some previous studies have been carried out on the
subject matter and some results have been presented. This research method is normally based on
previous studies, to confirm an existing result or theory
The benefit is that it makes the results more more meaningful.
6.1.1 Relationship Between Confirmatory and Exploratory Research
A number of studies includes both exploratory and confirmatory hypothesis. Sometimes, the
exploratory hypothesis may not affect the analysis of the confirmatory hypothesis. In some other
cases, both are carried out together. An example would be when a two-way ANOVA may have
exploratory hypothesis for one of the factors and confirmatory for the other factor.
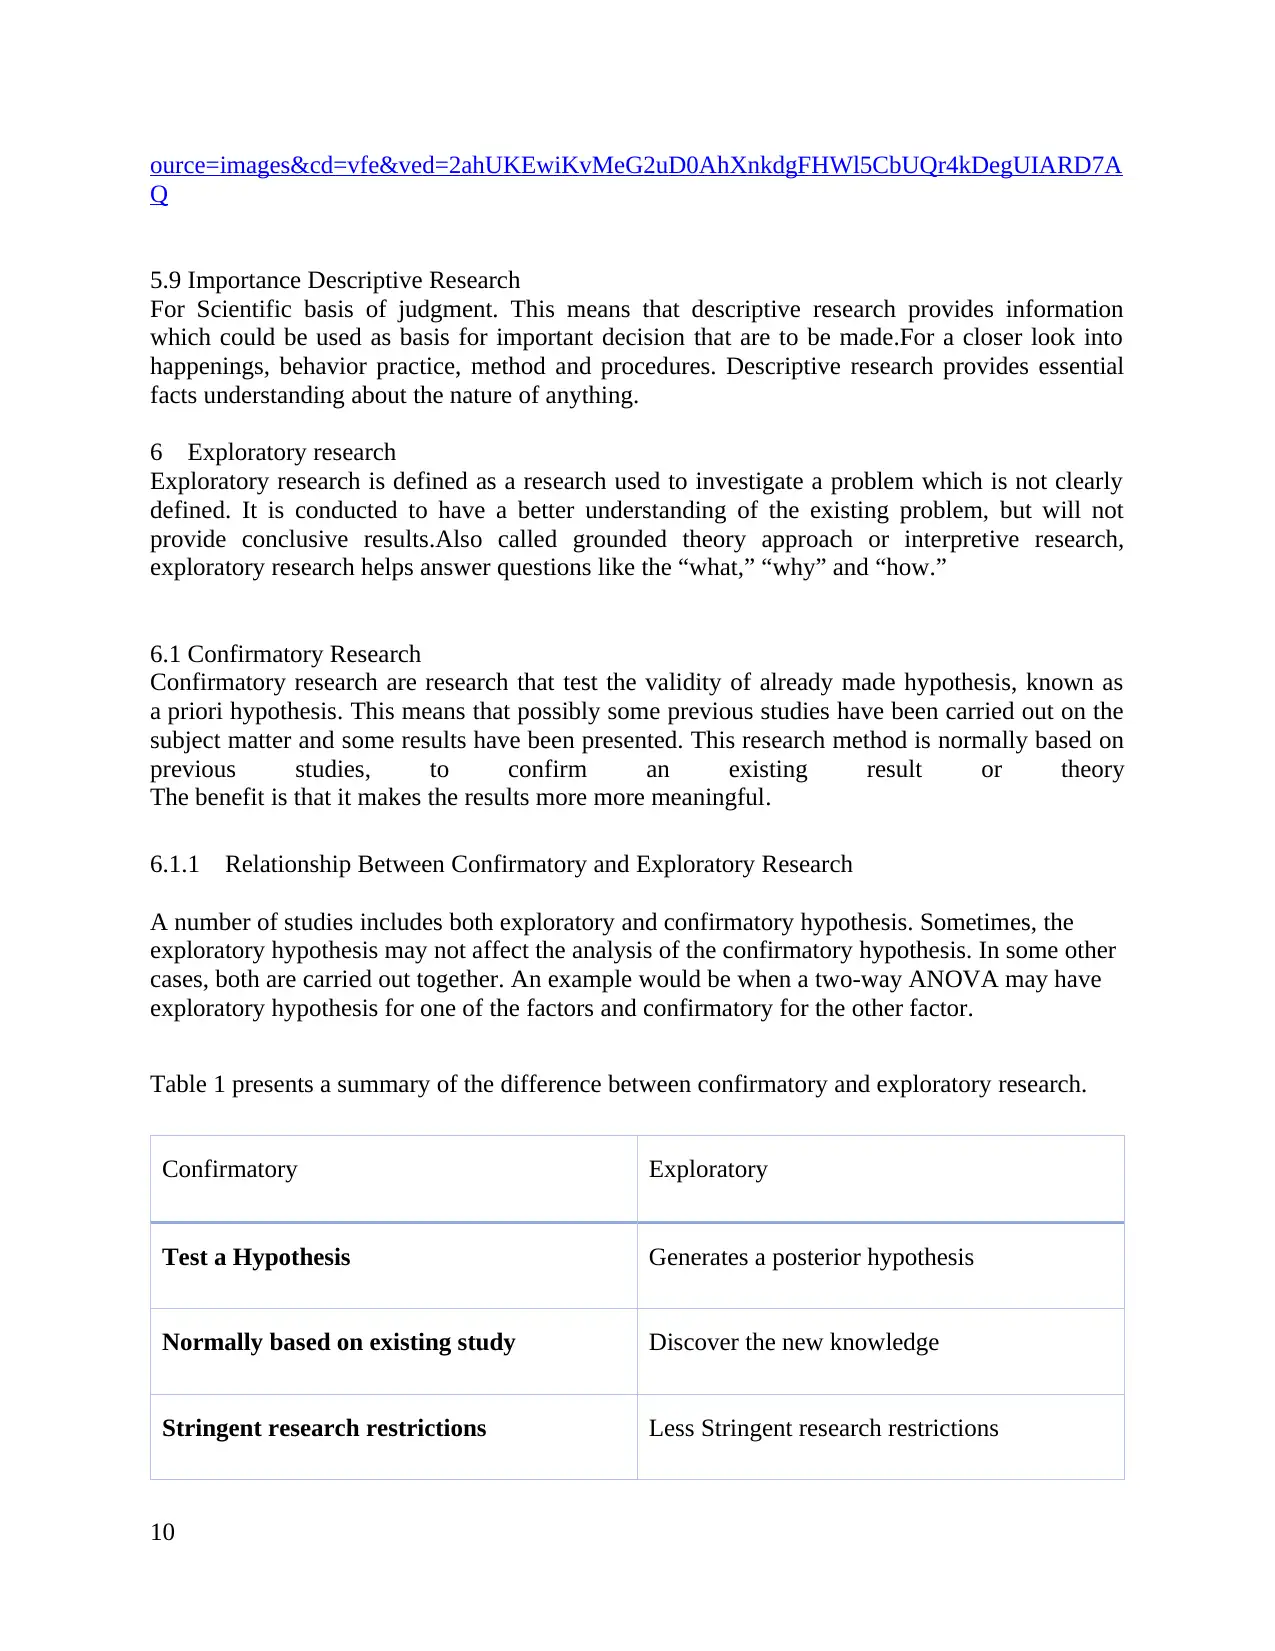
Table 1 presents a summary of the difference between confirmatory and exploratory research.
Confirmatory Exploratory
Test a Hypothesis Generates a posterior hypothesis
Normally based on existing study Discover the new knowledge
Stringent research restrictions Less Stringent research restrictions
10
Q
5.9 Importance Descriptive Research
For Scientific basis of judgment. This means that descriptive research provides information
which could be used as basis for important decision that are to be made.For a closer look into
happenings, behavior practice, method and procedures. Descriptive research provides essential
facts understanding about the nature of anything.
6 Exploratory research
Exploratory research is defined as a research used to investigate a problem which is not clearly
defined. It is conducted to have a better understanding of the existing problem, but will not
provide conclusive results.Also called grounded theory approach or interpretive research,
exploratory research helps answer questions like the “what,” “why” and “how.”
6.1 Confirmatory Research
Confirmatory research are research that test the validity of already made hypothesis, known as
a priori hypothesis. This means that possibly some previous studies have been carried out on the
subject matter and some results have been presented. This research method is normally based on
previous studies, to confirm an existing result or theory
The benefit is that it makes the results more more meaningful.
6.1.1 Relationship Between Confirmatory and Exploratory Research
A number of studies includes both exploratory and confirmatory hypothesis. Sometimes, the
exploratory hypothesis may not affect the analysis of the confirmatory hypothesis. In some other
cases, both are carried out together. An example would be when a two-way ANOVA may have
exploratory hypothesis for one of the factors and confirmatory for the other factor.
Table 1 presents a summary of the difference between confirmatory and exploratory research.
Confirmatory Exploratory
Test a Hypothesis Generates a posterior hypothesis
Normally based on existing study Discover the new knowledge
Stringent research restrictions Less Stringent research restrictions
10
Paraphrase This Document
Need a fresh take? Get an instant paraphrase of this document with our AI Paraphraser
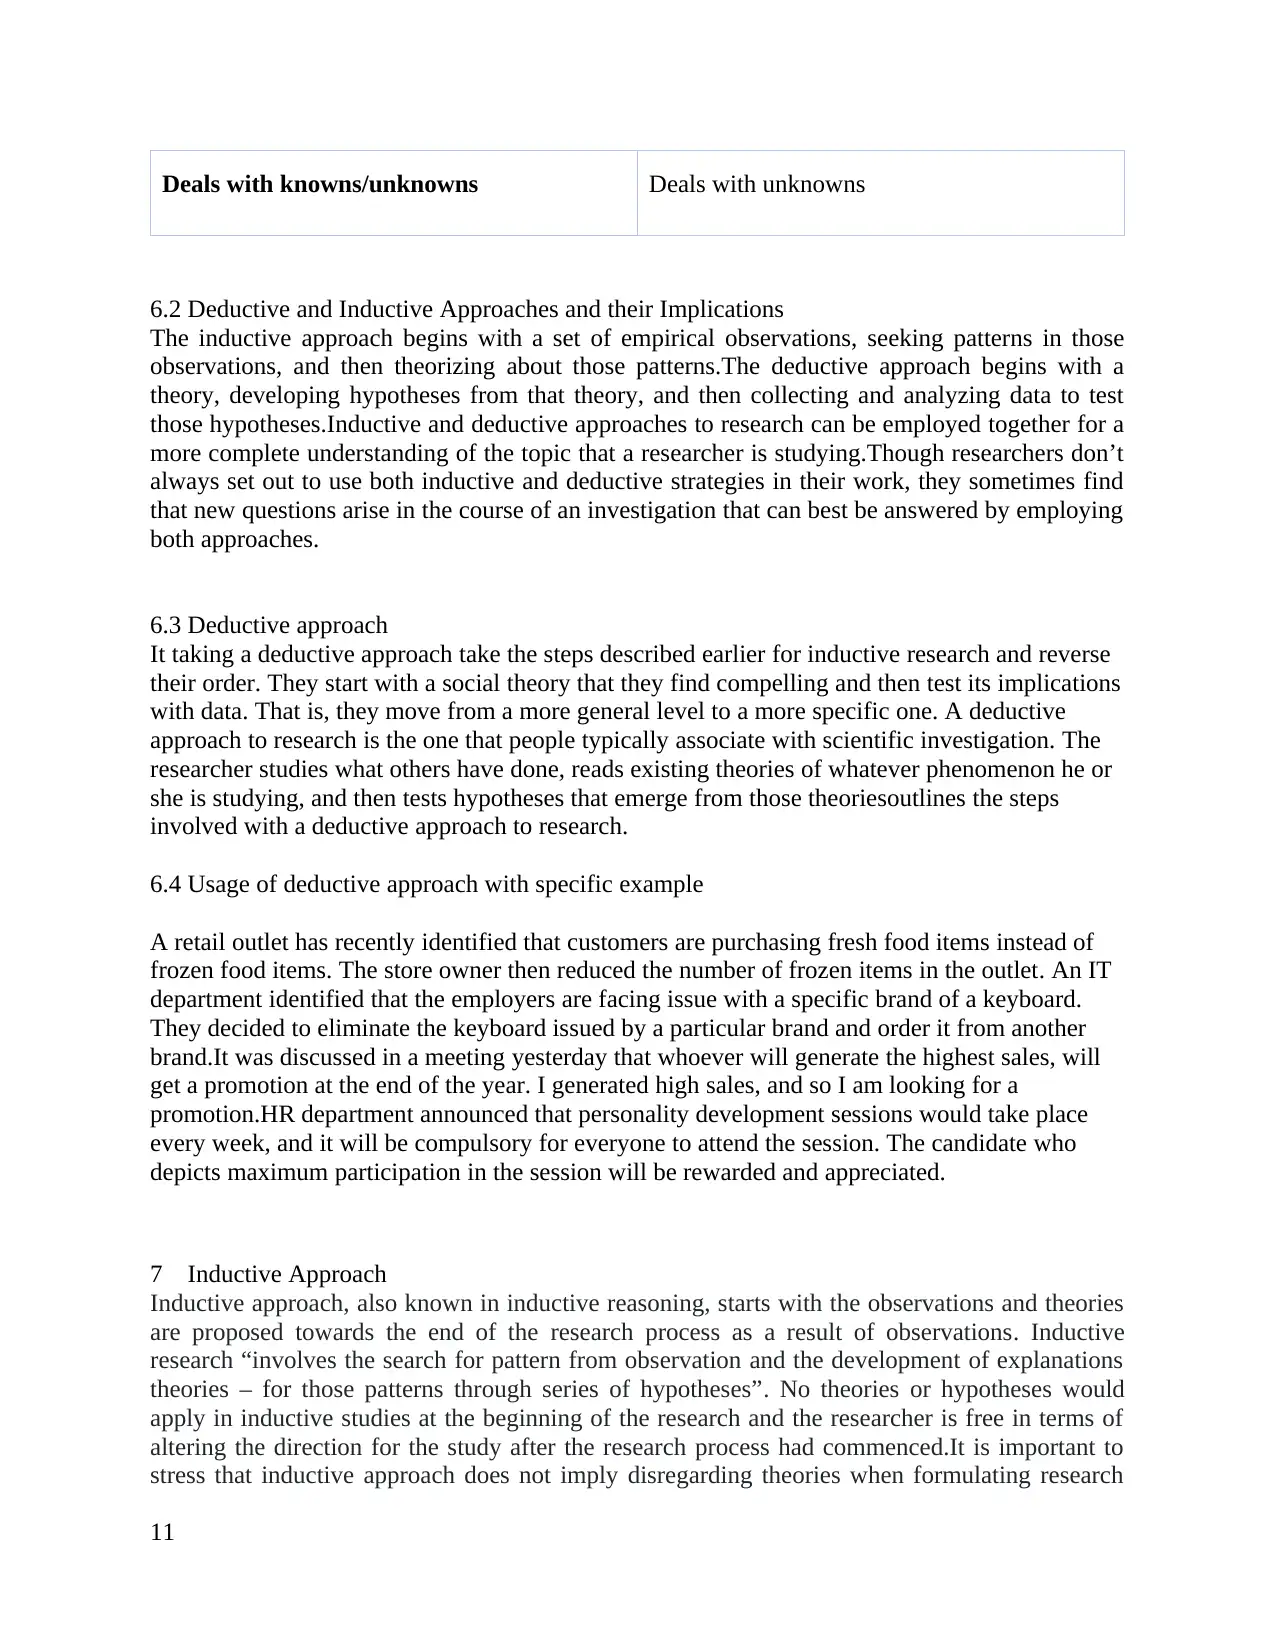
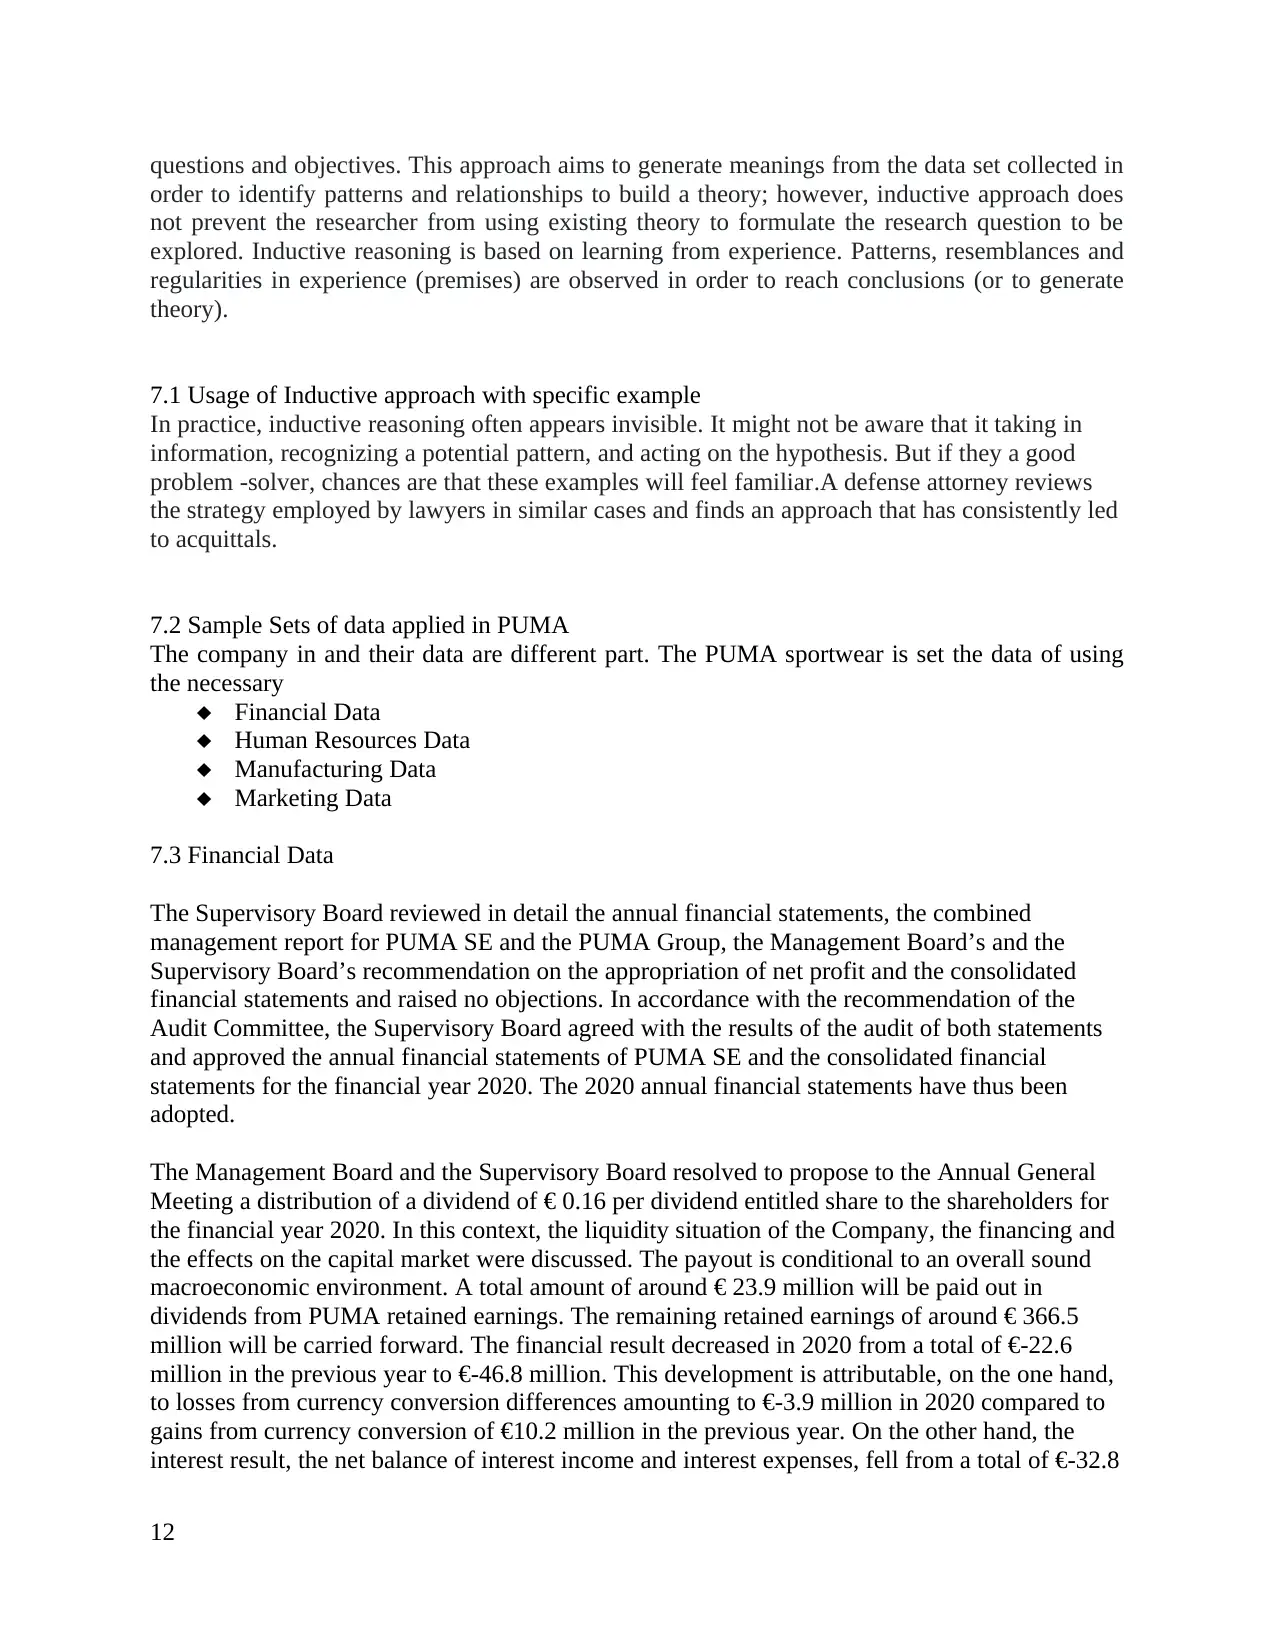
Deals with knowns/unknowns Deals with unknowns
6.2 Deductive and Inductive Approaches and their Implications
The inductive approach begins with a set of empirical observations, seeking patterns in those
observations, and then theorizing about those patterns.The deductive approach begins with a
theory, developing hypotheses from that theory, and then collecting and analyzing data to test
those hypotheses.Inductive and deductive approaches to research can be employed together for a
more complete understanding of the topic that a researcher is studying.Though researchers don’t
always set out to use both inductive and deductive strategies in their work, they sometimes find
that new questions arise in the course of an investigation that can best be answered by employing
both approaches.
6.3 Deductive approach
It taking a deductive approach take the steps described earlier for inductive research and reverse
their order. They start with a social theory that they find compelling and then test its implications
with data. That is, they move from a more general level to a more specific one. A deductive
approach to research is the one that people typically associate with scientific investigation. The
researcher studies what others have done, reads existing theories of whatever phenomenon he or
she is studying, and then tests hypotheses that emerge from those theoriesoutlines the steps
involved with a deductive approach to research.
6.4 Usage of deductive approach with specific example
A retail outlet has recently identified that customers are purchasing fresh food items instead of
frozen food items. The store owner then reduced the number of frozen items in the outlet. An IT
department identified that the employers are facing issue with a specific brand of a keyboard.
They decided to eliminate the keyboard issued by a particular brand and order it from another
brand.It was discussed in a meeting yesterday that whoever will generate the highest sales, will
get a promotion at the end of the year. I generated high sales, and so I am looking for a
promotion.HR department announced that personality development sessions would take place
every week, and it will be compulsory for everyone to attend the session. The candidate who
depicts maximum participation in the session will be rewarded and appreciated.
7 Inductive Approach
Inductive approach, also known in inductive reasoning, starts with the observations and theories
are proposed towards the end of the research process as a result of observations. Inductive
research “involves the search for pattern from observation and the development of explanations
theories – for those patterns through series of hypotheses”. No theories or hypotheses would
apply in inductive studies at the beginning of the research and the researcher is free in terms of
altering the direction for the study after the research process had commenced.It is important to
stress that inductive approach does not imply disregarding theories when formulating research
11
questions and objectives. This approach aims to generate meanings from the data set collected in
order to identify patterns and relationships to build a theory; however, inductive approach does
not prevent the researcher from using existing theory to formulate the research question to be
explored. Inductive reasoning is based on learning from experience. Patterns, resemblances and
regularities in experience (premises) are observed in order to reach conclusions (or to generate
theory).
7.1 Usage of Inductive approach with specific example
In practice, inductive reasoning often appears invisible. It might not be aware that it taking in
information, recognizing a potential pattern, and acting on the hypothesis. But if they a good
problem -solver, chances are that these examples will feel familiar.A defense attorney reviews
the strategy employed by lawyers in similar cases and finds an approach that has consistently led
to acquittals.
7.2 Sample Sets of data applied in PUMA
The company in and their data are different part. The PUMA sportwear is set the data of using
the necessary
Financial Data
Human Resources Data
Manufacturing Data
Marketing Data
7.3 Financial Data
The Supervisory Board reviewed in detail the annual financial statements, the combined
management report for PUMA SE and the PUMA Group, the Management Board’s and the
Supervisory Board’s recommendation on the appropriation of net profit and the consolidated
financial statements and raised no objections. In accordance with the recommendation of the
Audit Committee, the Supervisory Board agreed with the results of the audit of both statements
and approved the annual financial statements of PUMA SE and the consolidated financial
statements for the financial year 2020. The 2020 annual financial statements have thus been
adopted.
The Management Board and the Supervisory Board resolved to propose to the Annual General
Meeting a distribution of a dividend of € 0.16 per dividend entitled share to the shareholders for
the financial year 2020. In this context, the liquidity situation of the Company, the financing and
the effects on the capital market were discussed. The payout is conditional to an overall sound
macroeconomic environment. A total amount of around € 23.9 million will be paid out in
dividends from PUMA retained earnings. The remaining retained earnings of around € 366.5
million will be carried forward. The financial result decreased in 2020 from a total of €-22.6
million in the previous year to €-46.8 million. This development is attributable, on the one hand,
to losses from currency conversion differences amounting to €-3.9 million in 2020 compared to
gains from currency conversion of €10.2 million in the previous year. On the other hand, the
interest result, the net balance of interest income and interest expenses, fell from a total of €-32.8
12
⊘ This is a preview!⊘
Do you want full access?
Subscribe today to unlock all pages.
Trusted by 1+ million students worldwide
1 out of 18
Your All-in-One AI-Powered Toolkit for Academic Success.
+13062052269
info@desklib.com
Available 24*7 on WhatsApp / Email
![[object Object]](/_next/static/media/star-bottom.7253800d.svg)
Unlock your academic potential
Copyright © 2020–2026 A2Z Services. All Rights Reserved. Developed and managed by ZUCOL.