Regression Analysis Report: Data, Interpretation and Forecasting

Verified

Added on  2022/12/15

|5
|328
|35
Report
AI Summary
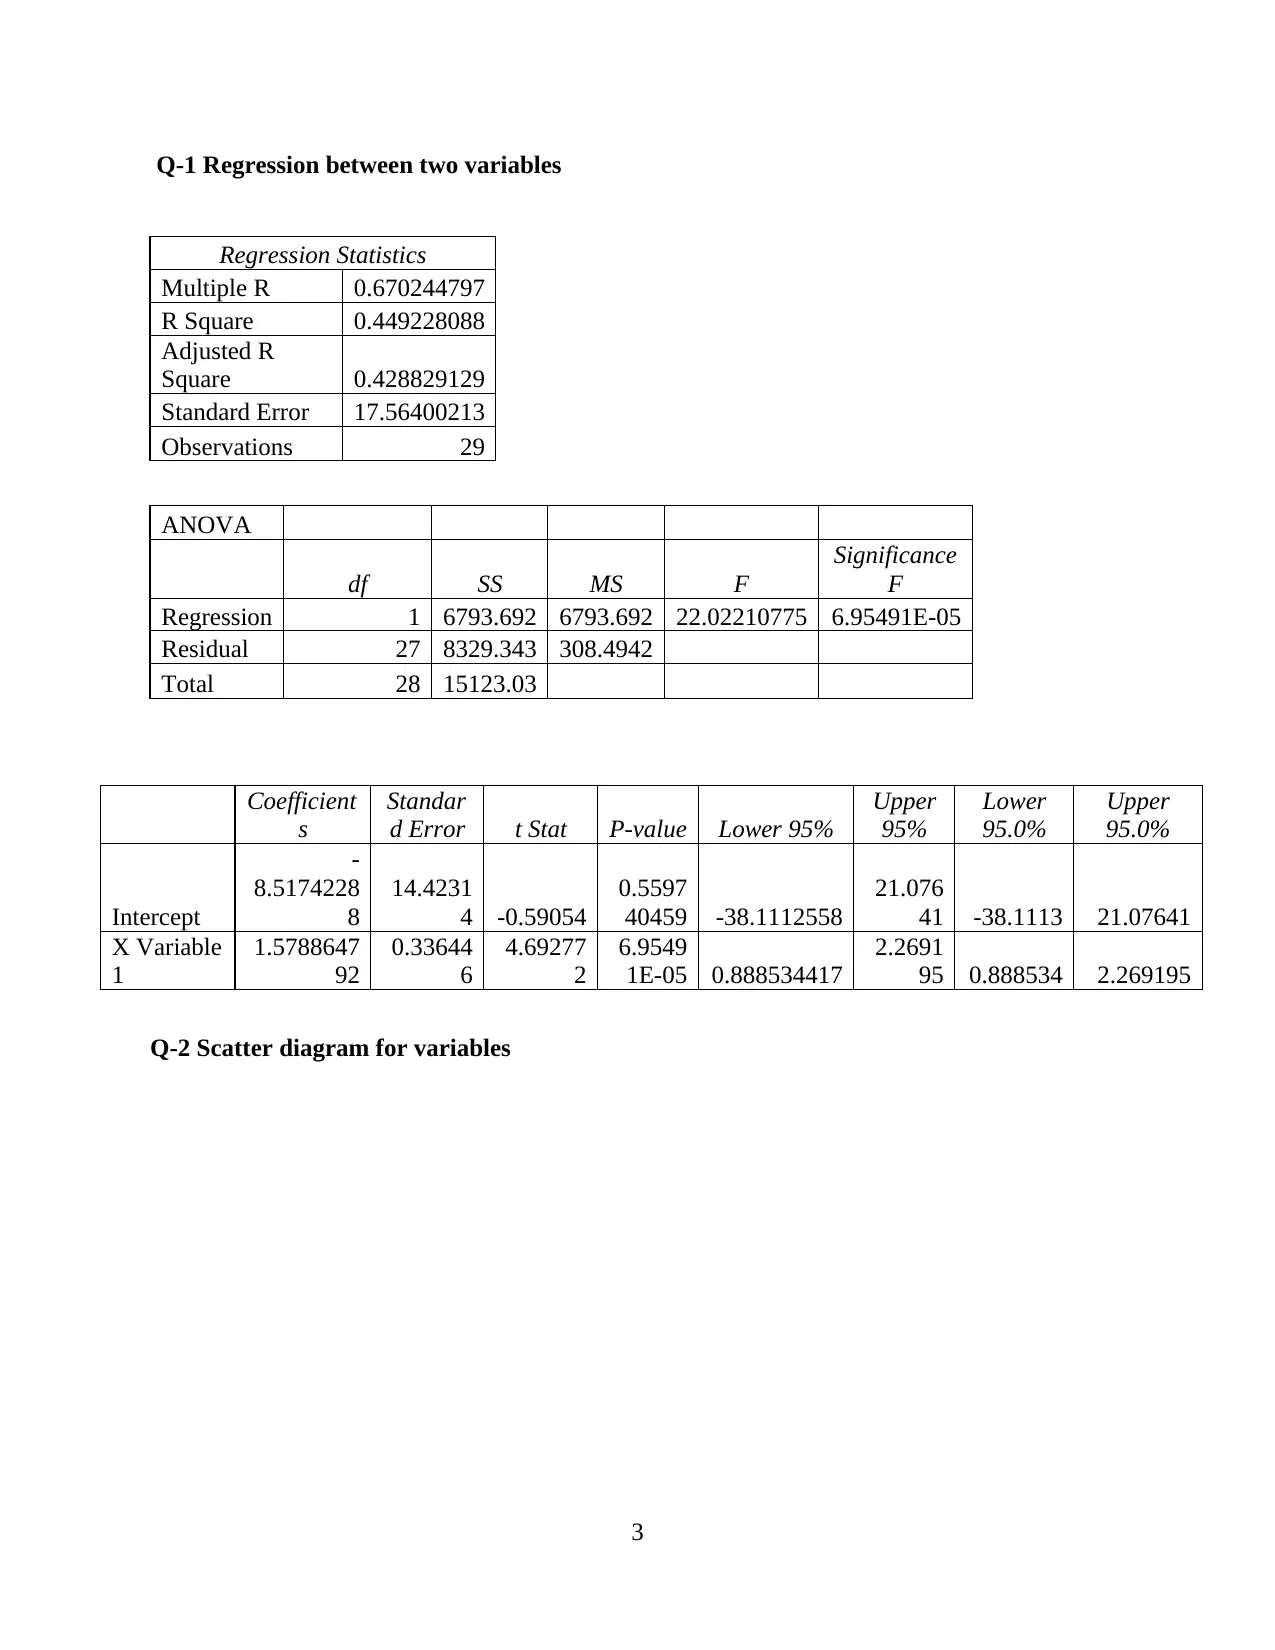
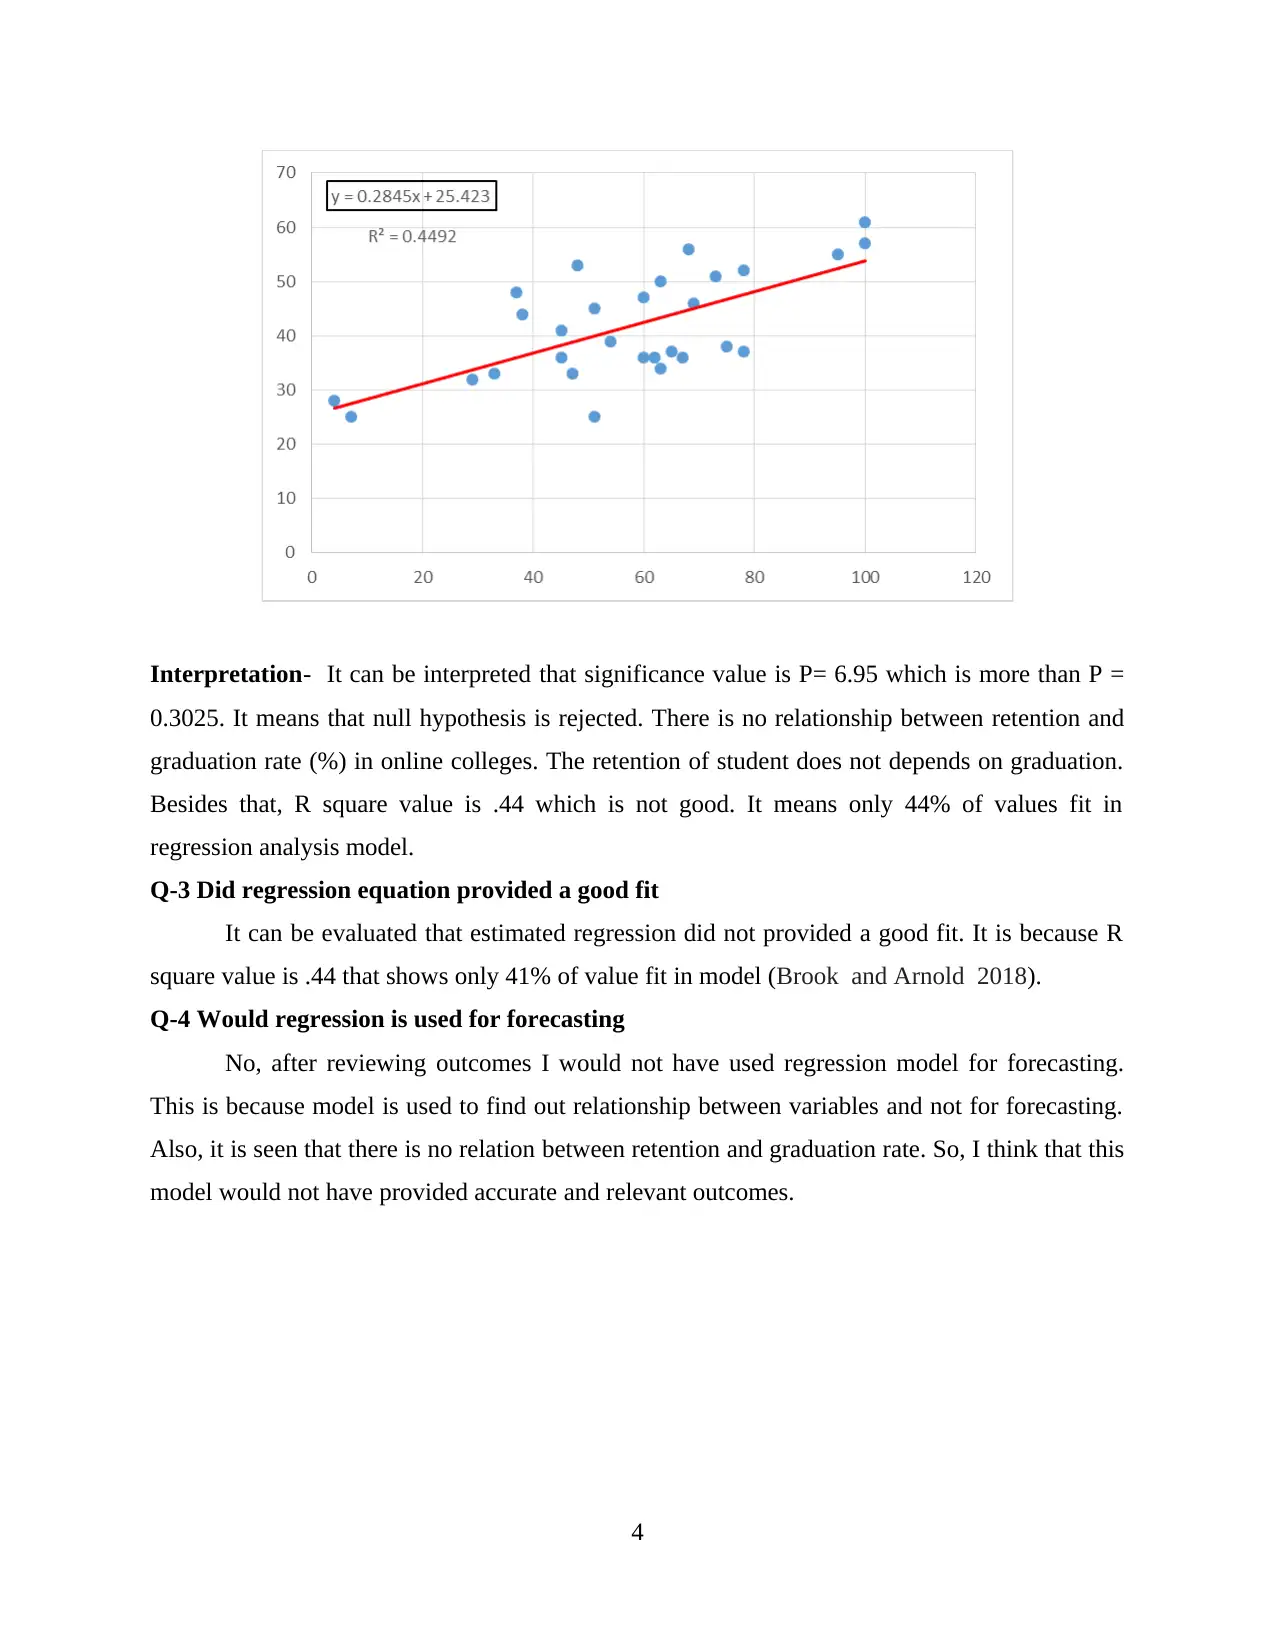
This report presents a regression analysis of data, focusing on the relationship between retention and graduation rates in online colleges. The analysis includes the calculation of regression statistics, such as R-squared, and the interpretation of these values to determine the significance of the relationship. The report also addresses the goodness of fit of the regression model, evaluating whether the estimated regression provided a good fit for the data. Furthermore, it discusses the suitability of using the regression model for forecasting, concluding that it is not appropriate due to the lack of a significant relationship between the variables. The report uses the provided data to answer the questions, including the interpretation of the regression output and the decision to reject or accept the null hypothesis. The R-squared value is used to assess the model's fit, and the overall conclusions are drawn based on the statistical analysis and interpretation of the regression results. The report concludes by stating that the regression model is not suitable for forecasting purposes.
tabler-icon-diamond-filled.svg

Contribute Materials

Your contribution can guide someone’s learning journey. Share your documents today.
Document Page
Managing data
1
tabler-icon-diamond-filled.svg

Secure Best Marks with AI Grader

Need help grading? Try our AI Grader for instant feedback on your assignments.
Document Page
Table of Contents
REFERENCES................................................................................................................................4
2
Document Page
Q-1 Regression between two variables
Regression Statistics
Multiple R 0.670244797
R Square 0.449228088
Adjusted R
Square 0.428829129
Standard Error 17.56400213
Observations 29
ANOVA
df SS MS F
Significance
F
Regression 1 6793.692 6793.692 22.02210775 6.95491E-05
Residual 27 8329.343 308.4942
Total 28 15123.03
Coefficient
s
Standar
d Error t Stat P-value Lower 95%
Upper
95%
Lower
95.0%
Upper
95.0%
Intercept
-
8.5174228
8
14.4231
4 -0.59054
0.5597
40459 -38.1112558
21.076
41 -38.1113 21.07641
X Variable
1
1.5788647
92
0.33644
6
4.69277
2
6.9549
1E-05 0.888534417
2.2691
95 0.888534 2.269195
Q-2 Scatter diagram for variables
3
Document Page
Interpretation- It can be interpreted that significance value is P= 6.95 which is more than P =
0.3025. It means that null hypothesis is rejected. There is no relationship between retention and
graduation rate (%) in online colleges. The retention of student does not depends on graduation.
Besides that, R square value is .44 which is not good. It means only 44% of values fit in
regression analysis model.
Q-3 Did regression equation provided a good fit
It can be evaluated that estimated regression did not provided a good fit. It is because R
square value is .44 that shows only 41% of value fit in model (Brook and Arnold 2018).
Q-4 Would regression is used for forecasting
No, after reviewing outcomes I would not have used regression model for forecasting.
This is because model is used to find out relationship between variables and not for forecasting.
Also, it is seen that there is no relation between retention and graduation rate. So, I think that this
model would not have provided accurate and relevant outcomes.
4
tabler-icon-diamond-filled.svg

Secure Best Marks with AI Grader

Need help grading? Try our AI Grader for instant feedback on your assignments.
Document Page
REFERENCES
Books and journals
Brook, R.J. and Arnold, G.C., 2018. Applied regression analysis and experimental design. CRC
Press.
5
chevron_up_icon
1 out of 5
circle_padding
hide_on_mobile
zoom_out_icon
logo.png

Your All-in-One AI-Powered Toolkit for Academic Success.

Available 24*7 on WhatsApp / Email

[object Object]