Rental Property Analysis: Data on Rent, Dwelling Type, and Suburbs

Verified

Added on  2020/03/28

|7
|1422
|219
Report
AI Summary
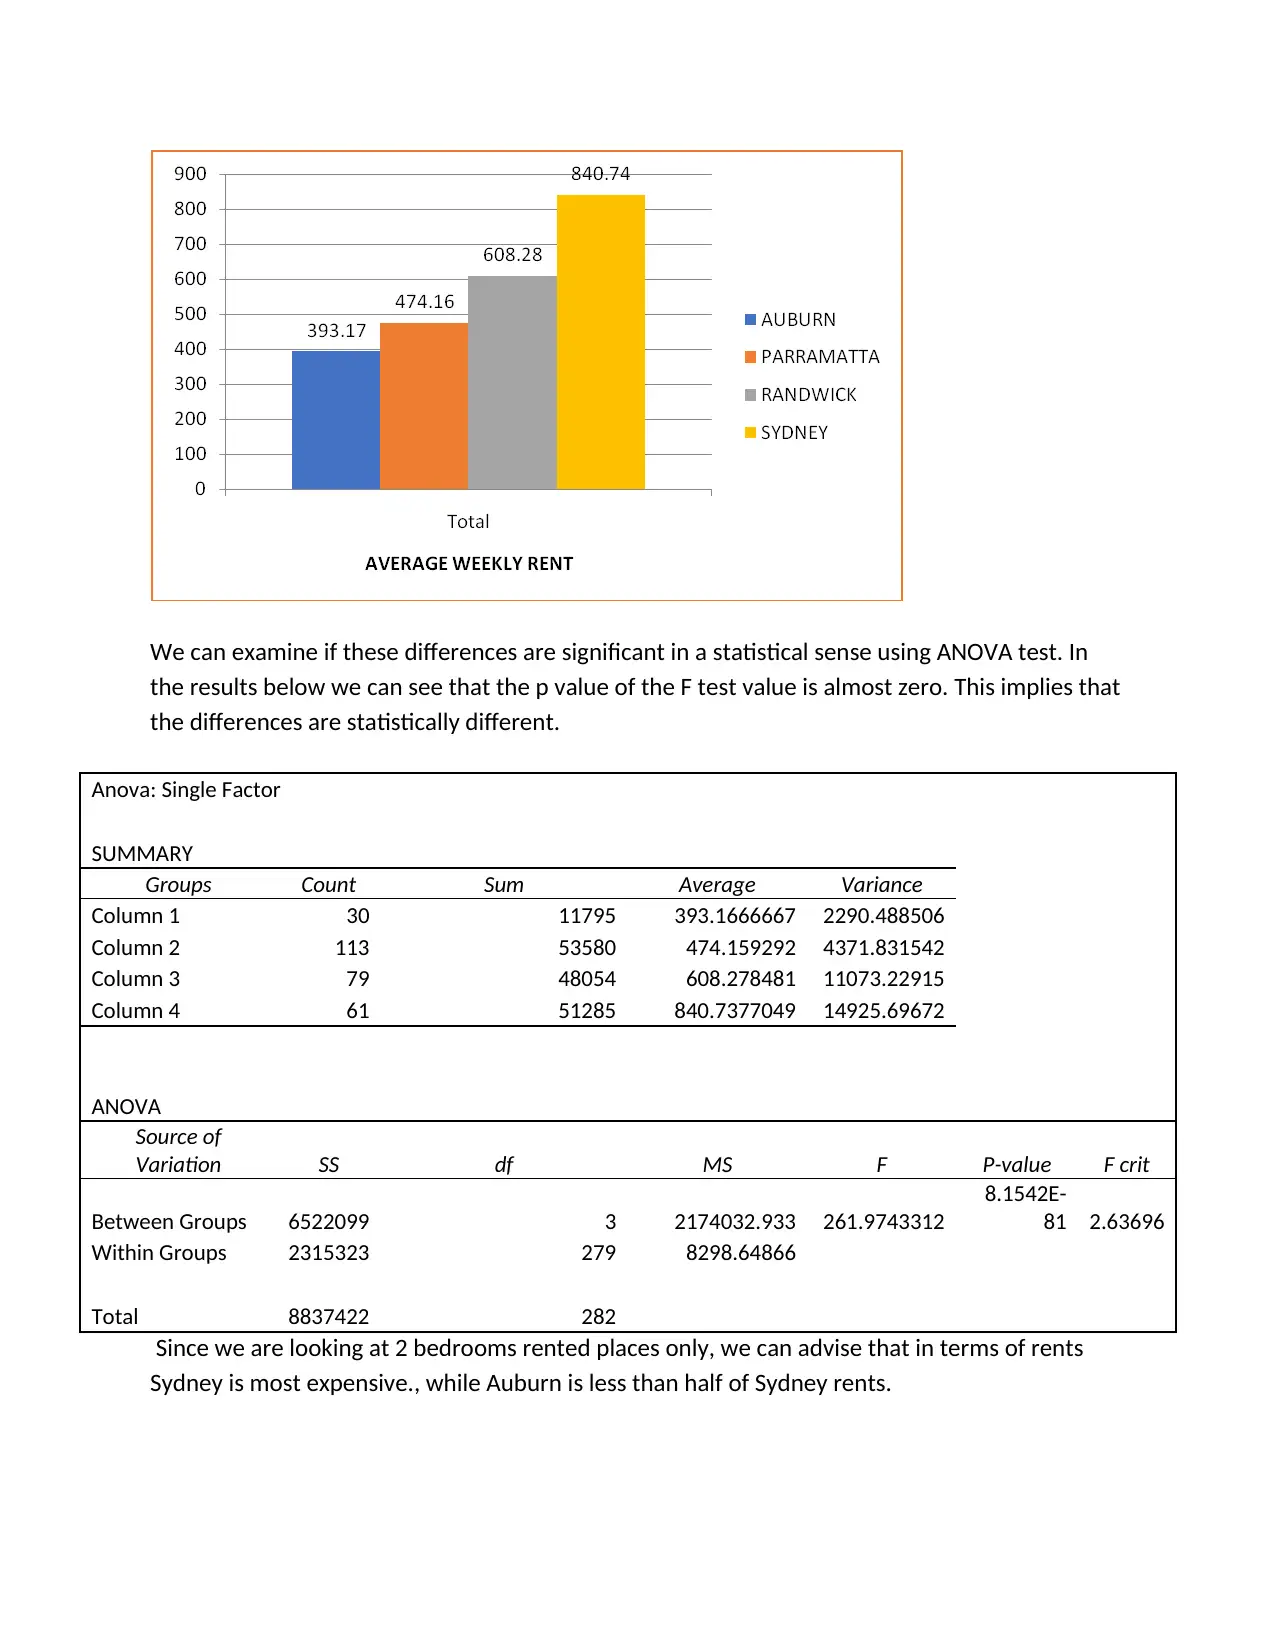
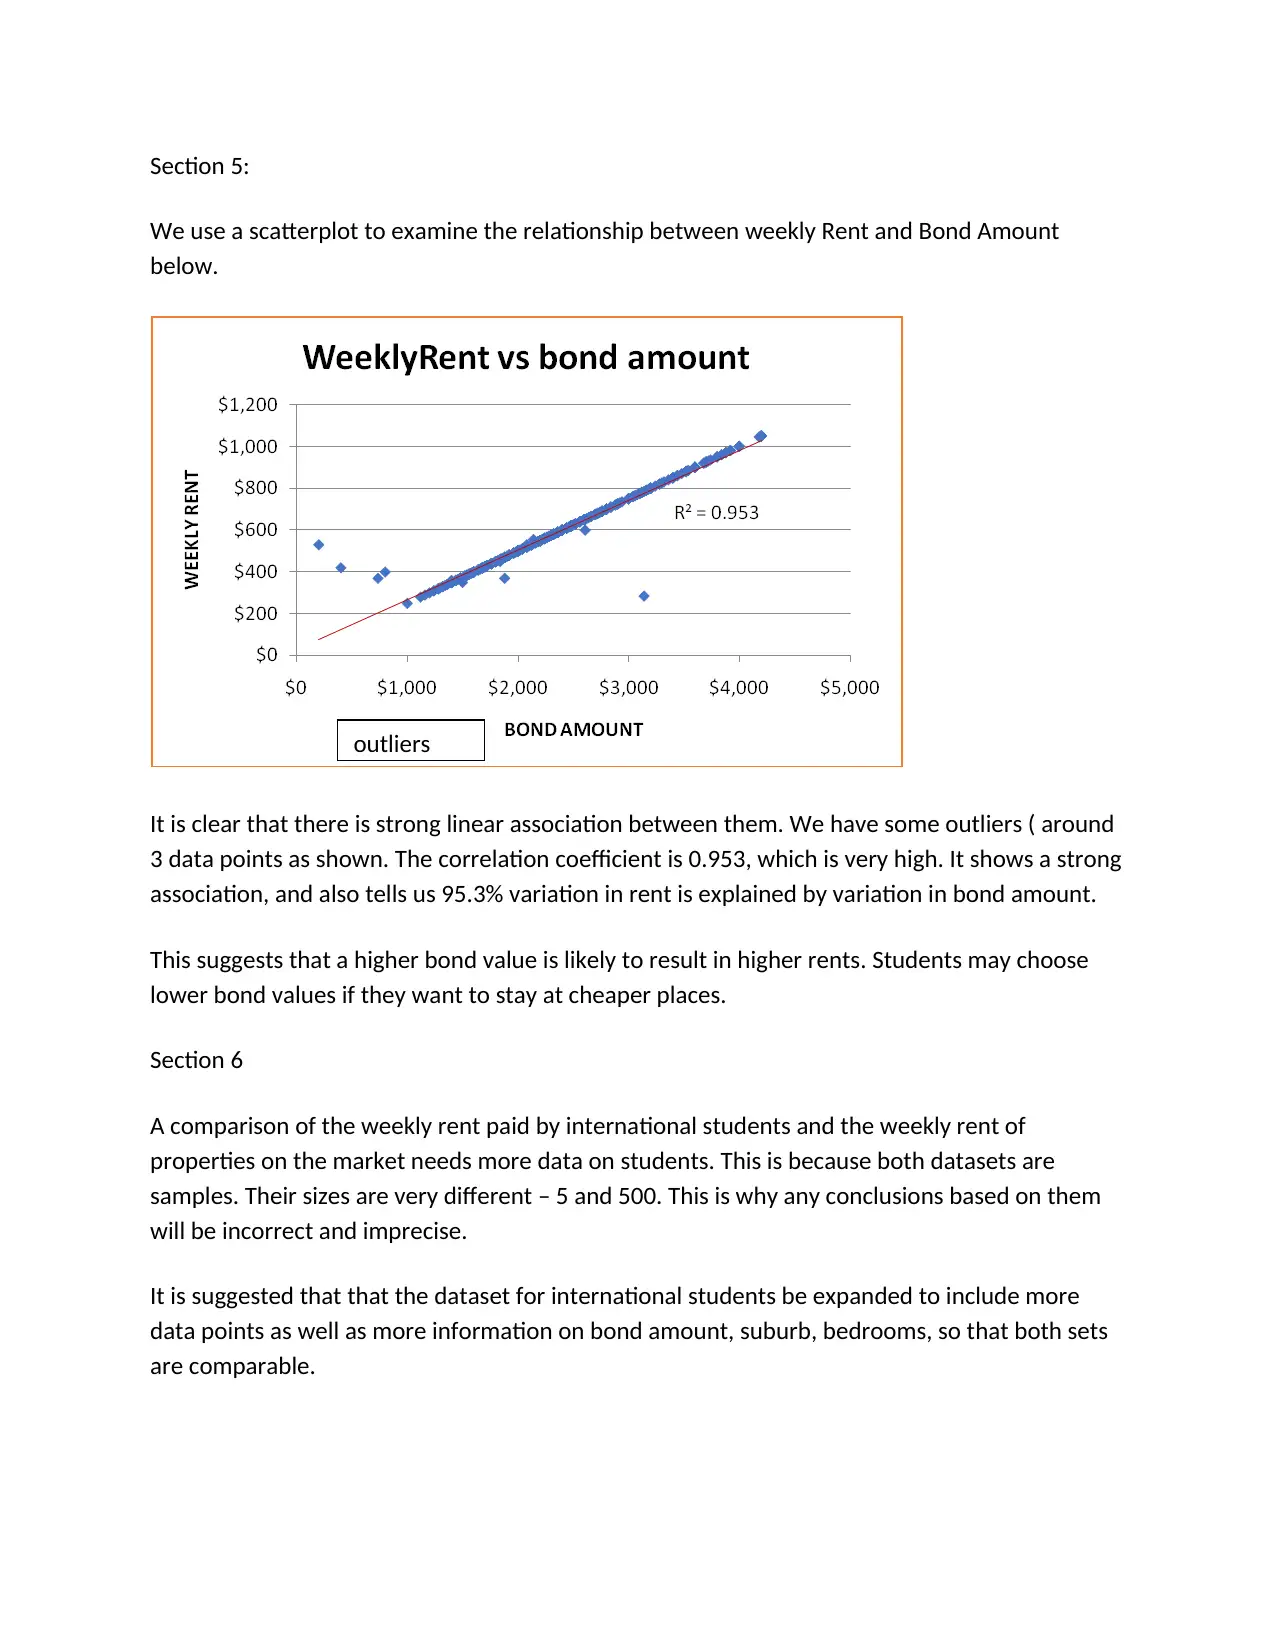
This report presents a statistical analysis of rental property data, focusing on weekly rent, dwelling types (flats/houses), number of bedrooms, and bond amounts across four different suburbs. The analysis includes both primary (interview-based) and secondary (larger dataset) data sources. Key findings include a predominance of flats, with the majority of students residing in Parramatta. Statistical tests, such as the ANOVA test, reveal significant differences in average weekly rent across suburbs for two-bedroom dwellings, with Sydney having the highest average rent. A strong positive correlation (0.953) is identified between weekly rent and bond amount, indicating a linear relationship. The report highlights limitations in comparing datasets and suggests expanding the international student dataset for more accurate comparisons. The report utilizes various statistical methods and visual aids, such as bar charts and scatterplots, to present and interpret the data.
Document Page
Student name:
Course:
tabler-icon-diamond-filled.svg

Paraphrase This Document

Need a fresh take? Get an instant paraphrase of this document with our AI Paraphraser
Document Page
Section 1
This assignment looks at primary and secondary data on properties, in terms of their weekly
rent, dwelling type( flat/house), no of bedrooms, and bond amount paid . It covers 4 different
suburbs. It reports on a variety of questions relating to these parameters.
In dataset 1, we use primary data on the basis of interview of 5 students on their weekly rent.
This sample can be biased as it uses respondents from my university campus only, so that its
applicability across Australia is questionable. The sample size is also low as we use only 5
respondents. It will be inappropriate to use this small dataset to make any conclusions about
the whole University.
Dataset 2 is larger as it has 500 observations. It is secondary data on weekly rent paid, dwelling
type (flat/house), no of bedrooms, and bond amount paid . It covers 4 different suburbs, and
provides their post codes as well. The first 5 cases of your dataset are shown below.
BondAmount WeeklyRent DwellingType NumberBedrooms Postcode Suburb
$2,900 $725 Flat 3 2031 RANDWICK
$2,480 $620 Flat 1 2031 RANDWICK
$1,960 $490 Flat 2 2150 PARRAMATTA
$2,200 $550 Flat 2 2031 RANDWICK
$2,280 $570 Flat 2 2031 RANDWICK
Section 2
THE following table gives a numerical summary of the data. Median > mean which implies
negative skewed distribution. The data is left skewed. The spread of data is high at a variance of
1032.5. As we can see students 5 has highest rent of $165, while student 2 has lowest rent of
$90.
DATASET 1
Mean 128
Standard Error 14.3701079
Median 135
Mode #N/A
Standard Deviation 32.132538
Sample Variance 1032.5
Kurtosis -2.35933845
Skewness -0.19064501
Document Page
Range 75
Minimum 90
Maximum 165
Sum 640
Count 5
Section 3:
a. Using the data relating to Dwelling Type, we show that there is predominance of flats- 462/500
stay in flats. The majority students stay in Parramatta. (163/500). In Sydney no student from
our sample set stays in houses.
SUBURB Flat House
Grand
Total
AUBURN 38 19 57
PARRAMATTA 151 12 163
RANDWICK 117 7 124
SYDNEY 156 156
Grand Total 462 38 500
.
The bar chart shows the same information in a graphical form. The predominance of flats (in
blue) is clear, as is the preference for Parramatta and Sydney.
The proportion of House as a dwelling type is 38/500 = sample proportion= p
Document Page
Ho: p= 0.1
H1: p < 0.1
Sample proportion = 38/500 = 0.076
Test value = (0.076 – 0.1)/ SE where SE = (0.076 *.924 /500)^.5 = 0.0118
Test value = - 0.024/0.0118 = -2.015. Using a 5% level of significance, the critical z value is -
1.645. as test value is > critical value in absolute terms we conclude that we do not accept the
null hypothesis. There is evidence that proportion of Houses is less than 0.1.
Those who want to rent a house can use this data to see that less than 10% of existing students
stay in houses. In Sydney no one stays in houses. This points to some advantages of flats, which
are beyond discussion here. A simple look at this data tells us that students prefer flat by an
overwhelming majority. It is advisable to stay in flats than houses as students.
Section 4: R
b. We now consider dwellings with 2 bedrooms only, and compare the weekly rent across
different suburbs with average rent as the criteria. As we can see Auburn has the lowest
average rent of $393.17, while Sydney has the highest average rent of $840.74.
AUBURN PARRAMATTA RANDWICK SYDNEY
Average of WeeklyRent 393.17 474.16 608.28 840.74
tabler-icon-diamond-filled.svg

Paraphrase This Document

Need a fresh take? Get an instant paraphrase of this document with our AI Paraphraser
Document Page
We can examine if these differences are significant in a statistical sense using ANOVA test. In
the results below we can see that the p value of the F test value is almost zero. This implies that
the differences are statistically different.
Anova: Single Factor
SUMMARY
Groups Count Sum Average Variance
Column 1 30 11795 393.1666667 2290.488506
Column 2 113 53580 474.159292 4371.831542
Column 3 79 48054 608.278481 11073.22915
Column 4 61 51285 840.7377049 14925.69672
ANOVA
Source of
Variation SS df MS F P-value F crit
Between Groups 6522099 3 2174032.933 261.9743312
8.1542E-
81 2.63696
Within Groups 2315323 279 8298.64866
Total 8837422 282
Since we are looking at 2 bedrooms rented places only, we can advise that in terms of rents
Sydney is most expensive., while Auburn is less than half of Sydney rents.
Document Page
Section 5:
We use a scatterplot to examine the relationship between weekly Rent and Bond Amount
below.
It is clear that there is strong linear association between them. We have some outliers ( around
3 data points as shown. The correlation coefficient is 0.953, which is very high. It shows a strong
association, and also tells us 95.3% variation in rent is explained by variation in bond amount.
This suggests that a higher bond value is likely to result in higher rents. Students may choose
lower bond values if they want to stay at cheaper places.
Section 6
A comparison of the weekly rent paid by international students and the weekly rent of
properties on the market needs more data on students. This is because both datasets are
samples. Their sizes are very different – 5 and 500. This is why any conclusions based on them
will be incorrect and imprecise.
It is suggested that that the dataset for international students be expanded to include more
data points as well as more information on bond amount, suburb, bedrooms, so that both sets
are comparable.
outliers
Document Page
References
Anon., n.d. How to choose no of bins. [Online] [Accessed 12 Sep 2017].
Anon., n.d. Hypothesis Testing. [Online] Available at:
https://onlinecourses.science.psu.edu/statprogram/node/138 [Accessed 8 Sep 2017].
Anon., n.d. Hypothess testing. [Online] Available at:
http://www.statisticshowto.com/probability-and-statistics/hypothesis-testing/ [Accessed 12
Sep 2017].
Anon., n.d. Mean, median, mode. [Online] Available at:
http://www.bbc.co.uk/schools/gcsebitesize/maths/statistics/measuresofaveragerev6.shtml
[Accessed 13 Sep 2017].
Home.iitk.ac.in, n.d. Regression analysis. [Online] Available at:
SimpleLinearRegressionAnalysis.pdf" http://home.iitk.ac.in/~shalab/regression/Chapter2-
Regression-SimpleLinearRegressionAnalysis.pdf [Accessed 6 Sep 2017].
Learn,bu.edu, n.d. The 5 steps in Hypothesis testing. [Online] Available at:
https://learn.bu.edu/bbcswebdav/pid-826908-dt-content-rid-2073693_1/courses/
13sprgmetcj702_ol/week04/metcj702_W04S01T05_fivesteps.html [Accessed 5 Sep 2017].
Rgs.org, n.d. Sampling techniques. [Online] Available
athttp://www.rgs.org/OurWork/Schools/Fieldwork+and+local+learning/
Fieldwork+techniques/Sampling+techniques.htm [Accessed 15 Sep 2017].
stat.ualberta.ca, n.d. What isa P value. [Online] Available at:
http://www.stat.ualberta.ca/~hooper/teaching/misc/Pvalue.pdf [Accessed 9 Sep 2017].
chevron_up_icon
1 out of 7
circle_padding
hide_on_mobile
zoom_out_icon
[object Object]