Statistical Report: Analysis of Insurance Fraud for IFBA Finance Team
VerifiedAdded on 2022/10/17
|11
|1457
|9
Report
AI Summary
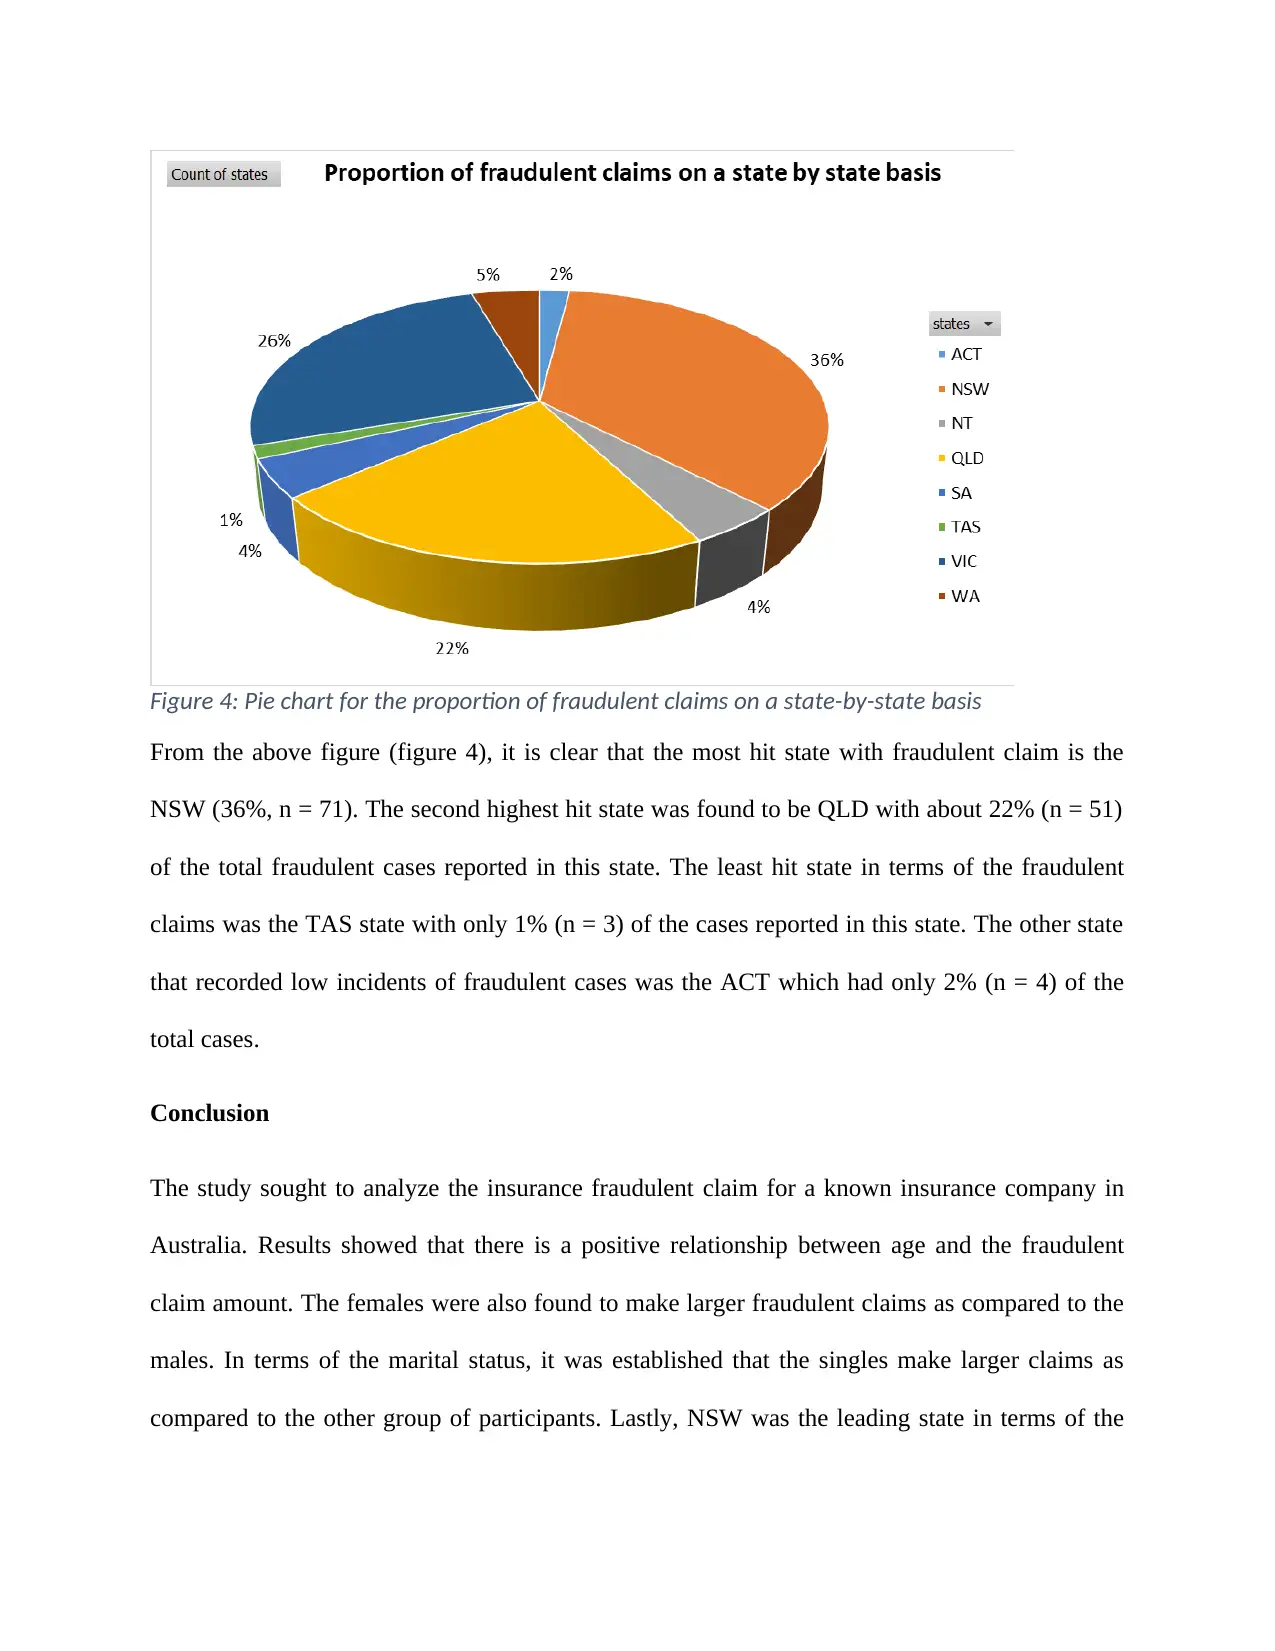
This report analyzes insurance fraud within a major Australian insurance company using 2016 data, addressing research questions on the relationship between gender, marital status, age, and fraudulent claim amounts. The study employs descriptive statistics, including mean, median, standard deviation, and boxplots, to identify trends and outliers. Findings reveal a positive correlation between age and claim amount, with females making larger claims on average. Single participants were found to have the highest average claim amounts. The report also examines the proportion of fraudulent claims by state, highlighting NSW as the most affected. The analysis concludes with key insights into the factors influencing insurance fraud and provides recommendations for fraud detection and prevention.

Business Data Analysis and Interpretation
Student Name:
Instructor Name:
Course Number:
20th September 2019
Introduction
Globally, insurance fraud is a great risk affecting many insurance companies and the trend has
been on the rise every year (Pao, Tzeng, & Wang, 2014). Australian insurers for instance, loses
about $2 billion every year concerning fraudulent/exaggerated claims. Frauds are typically done
by group of people or individuals who are out to get money through dubious means (Akotey &
Abor, 2013). On the impact of insurance fraud in the financial sector, there are currently no
Paraphrase This Document
Need a fresh take? Get an instant paraphrase of this document with our AI Paraphraser

agreed internationally recognized methods or bases for measuring the degree of insurance fraud
hence resulting in subjective judgments by the researchers (Miyazaki, 2015). This study
therefore sought to understand and analyze the insurance fraud in a known major insurance
company in Australia suing 2016 dataset.
Research questions
The study sought to answer the following research questions;
What is the relationship between gender and the fraudulent claim amount?
What is the relationship between marital status and the fraudulent claim amount?
What is the relationship between age and the fraudulent claim amount?
Results and findings
Descriptive (summary) statistics
Summary statistics on age
The average age of the participants was found to be 39.26 years old with the median age being
39 years old and the oldest participant being 68 years of age. The youngest participant on the
other hand was aged 18 years of age.
Table 1: Descriptive statistics for Age
Mean 39.26
Standard Error 0.76
Median 38.00
Mode 39.00
Standard Deviation 10.79
Sample Variance 116.46
Kurtosis -0.01
Skewness 0.65

Range 50.00
Minimum 18.00
Maximum 68.00
Sum 7811.79
Count 199
The standard deviation for the age of participants was found to be 10.79; this shows that the data
is slightly widely distributed apart when compared with the mean. The skewness value indicates
that the distribution of age of the participants is slightly skewed to the right (positively skewed).
Computation of the coefficient of variation (CoV) for the age
CoV = σ
x ∗100 %= 10.79
39.26∗100 %=27.48 %
Therefore the coefficient of variation for the age was found to be 27.48%.
Gender distribution
In terms of the participants ‘distribution in terms of gender, results showed that majority of the
participants were male participants (62%, n = 124) while the female participants were
represented by 38% (n = 75) of the participants.
⊘ This is a preview!⊘
Do you want full access?
Subscribe today to unlock all pages.

Trusted by 1+ million students worldwide

Summary statistics on claims
The average claim made by the participants was found to be $1491.11 with the median claim
amount being $1481.45 and the highest claim made by the participants being $2681.45. The
lowest claim by the participants on the other hand was $402.60.
Table 2: Descriptive statistics for claim($)
Mean 1491.111
Standard Error 35.09053
Median 1481.454
Mode 402.6002
Standard Deviation 495.0128
Sample Variance 245037.7
Kurtosis -0.44999
Skewness -0.05198
Range 2278.854
Minimum 402.6002
Maximum 2681.454
Sum 296731.2
Count 199
Paraphrase This Document
Need a fresh take? Get an instant paraphrase of this document with our AI Paraphraser

The most common claim was found to amount to $402.60. The standard deviation for the claim
made by the participants was found to be 495.01; this shows that the data is less widely
distributed apart when compared with the mean. The skewness value indicates that the claim
distribution is close to follow a normal distribution (skewness value approaching zero).
Checking for outliers
To check on whether there are outliers in the datasets. A boxplot was constructed and as can be
seen in figure 1 below, there are some outliers in the variable age
Figure 1: Box plot for age
There was however no any outlier for the variable claims as can be seen in the boxplot below
(figure 2).

Figure 2: Boxplot for claims
Relationship between age and claim
In order to analyze the relationship between age of the participant and the claim, a scatterplot
was constructed (Nikolić, Muresan, Feng, & Singer, 2012). The scatterplot in figure 3 below
gives the relationship between the age of the participant and the claim by the participant
(Mahdavi , 2012).
⊘ This is a preview!⊘
Do you want full access?
Subscribe today to unlock all pages.

Trusted by 1+ million students worldwide

Figure 3: A scatter plot of claim versus age
As can be seen from the figure above, there is evidence of a moderately strong positive
relationship between age and the claim amount. This implies that an increase in age is expected
to result in an increase in the claim amount. Older participants tend to claim bigger amounts as
compared to the younger participants.
Cross-tabulations
Gender and claim
Table 3 below presents a cross-tabulation of gender and the average claim. As can be seen from
the table, female participants seem to claim more amount as compared to the male participants.
On average female participants claim $1554.67 while the male participants claim $1452.67 on
average.
Table 3: Cross-tabulation of gender and claim
Gender Average of claim($)
Female 1554.67
Paraphrase This Document
Need a fresh take? Get an instant paraphrase of this document with our AI Paraphraser

Male 1452.67
Grand Total 1491.11
Marital status and claim
Table 4 below presents a cross-tabulation of marital status and the average claim. As can be seen
from the table, single participants seem to claim more amount while the separated participants
claim the least. On average single participants claim $1585.89 while the separated participants
claim $107.70 on average. Participants who claim the second highest claims are the married with
an average claim amount of $1538.23 while the widowed and the divorced claim an average of
$1508.89 and $1450.52 respectively.
Table 4: Cross-tabulation of gender and claim
Marital status Average of claim($)
Divorced 1450.52
Married 1538.23
Separate 1407.70
Single 1585.89
Widowed 1508.89
Grand Total 1491.11
Proportion of fraudulent claims on a state by state basis.
The pie-chart below presents a proportion of the fraudulent and/ or exaggerated claims in 2016
for the different states.
Grand Total 1491.11
Marital status and claim
Table 4 below presents a cross-tabulation of marital status and the average claim. As can be seen
from the table, single participants seem to claim more amount while the separated participants
claim the least. On average single participants claim $1585.89 while the separated participants
claim $107.70 on average. Participants who claim the second highest claims are the married with
an average claim amount of $1538.23 while the widowed and the divorced claim an average of
$1508.89 and $1450.52 respectively.
Table 4: Cross-tabulation of gender and claim
Marital status Average of claim($)
Divorced 1450.52
Married 1538.23
Separate 1407.70
Single 1585.89
Widowed 1508.89
Grand Total 1491.11
Proportion of fraudulent claims on a state by state basis.
The pie-chart below presents a proportion of the fraudulent and/ or exaggerated claims in 2016
for the different states.

Figure 4: Pie chart for the proportion of fraudulent claims on a state-by-state basis
From the above figure (figure 4), it is clear that the most hit state with fraudulent claim is the
NSW (36%, n = 71). The second highest hit state was found to be QLD with about 22% (n = 51)
of the total fraudulent cases reported in this state. The least hit state in terms of the fraudulent
claims was the TAS state with only 1% (n = 3) of the cases reported in this state. The other state
that recorded low incidents of fraudulent cases was the ACT which had only 2% (n = 4) of the
total cases.
Conclusion
The study sought to analyze the insurance fraudulent claim for a known insurance company in
Australia. Results showed that there is a positive relationship between age and the fraudulent
claim amount. The females were also found to make larger fraudulent claims as compared to the
males. In terms of the marital status, it was established that the singles make larger claims as
compared to the other group of participants. Lastly, NSW was the leading state in terms of the
⊘ This is a preview!⊘
Do you want full access?
Subscribe today to unlock all pages.

Trusted by 1+ million students worldwide

proportion of fraudulent claims and it was closely followed by the QLD state. TAS had the least
proportion of fraudulent claims followed by ACT state.
References
Akotey, J. O., & Abor, J. (2013). Risk management in the insurance industry. Qualitative
Research in Financial Markets, 5(1), 26-42.
Mahdavi , D. B. (2012). The Misleading Value of Measured Correlation. Wilmott, 1(4), 64–73.
Miyazaki, A. D. (2015). Perceived ethicality of insurance claim fraud: do higher deductibles lead
to lower ethical standards? Journal of Business Ethics, 87(4), 589-598.
Nikolić, D., Muresan, R. C., Feng, W., & Singer, W. (2012). Scaled correlation analysis: a better
way to compute a cross-correlogram. European Journal of Neuroscience, 35(5), 1–21.
Pao, T. I., Tzeng, L. Y., & Wang, C. W. (2014). Typhoons and opportunistic fraud: claim
patterns of automobile theft insurance in Taiwan. Journal of Risk and Insurance, 8(1),
Paraphrase This Document
Need a fresh take? Get an instant paraphrase of this document with our AI Paraphraser

91-112.
1 out of 11
Related Documents
Your All-in-One AI-Powered Toolkit for Academic Success.
+13062052269
info@desklib.com
Available 24*7 on WhatsApp / Email
Unlock your academic potential
Copyright © 2020–2025 A2Z Services. All Rights Reserved. Developed and managed by ZUCOL.


