Schmeckt Gut Sales Analysis Report: 25-Year Data and Future Forecast
VerifiedAdded on 2020/04/13
|25
|4064
|95
Report
AI Summary
This report presents a comprehensive sales analysis of Schmeckt Gut's performance over 25 years in three countries: Federated Island, Industria, and Nokaragua. The analysis utilizes statistical techniques including correlation and multiple linear regression to examine the relationships between sales and various determinants such as GDP, price index, population, survey scores, advertising, and the number of stores. The report provides an overview of sales trends, correlation analysis to assess the association between variables, and multiple regression models to predict future sales figures from 2016 to 2020. Furthermore, the report includes a business scenario for Sweden, suggesting strategies for market entry based on the analysis of similar markets. The report concludes with recommendations for sales expansion, leveraging the insights gained from the statistical analysis.

Running Head: STATISTICS FOR FINANCIAL DECISIONS
Statistics for Financial Decisions
Name of the Student
Name of the University
Author Note
Statistics for Financial Decisions
Name of the Student
Name of the University
Author Note
Paraphrase This Document
Need a fresh take? Get an instant paraphrase of this document with our AI Paraphraser
1STATISTICS FOR FINANCIAL DECISIONS
Table of Contents
1.0 Introduction................................................................................................................................2
2.0 Sales Analysis in Federated Island, Industria and Nokaragua...................................................3
2.1 Statistical Data Overview......................................................................................................3
2.2 Correlation Analysis..............................................................................................................6
2.2.1 Correlation for Federated Islands...................................................................................6
2.2.2 Correlation for Industria.................................................................................................7
2.2.3 Correlation for Nokaragua..............................................................................................7
2.3 Multiple Regression Analysis for prediction of Sales...........................................................8
2.3.1 Federated Island sales prediction....................................................................................8
2.3.2 Industria Sales Prediction...............................................................................................9
2.3.3 Nokaragua Sales Prediction..........................................................................................10
2.3.4 Forecast of Sales...........................................................................................................11
2.4 Hypothesis Testing..............................................................................................................12
3.0 Sweden Market Structure........................................................................................................13
3.1 Forecasted Sales of Sweden.................................................................................................14
4.0 Conclusion and Recommendation...........................................................................................14
Appendices....................................................................................................................................16

2STATISTICS FOR FINANCIAL DECISIONS
⊘ This is a preview!⊘
Do you want full access?
Subscribe today to unlock all pages.
Trusted by 1+ million students worldwide
3STATISTICS FOR FINANCIAL DECISIONS
1.0 Introduction
The main aim of this report is to evaluate the development the sales of Schmeckt Gut for
the last 25 years over three different countries namely, Federated Island, Industria and
Nokaragua. The data of the last 25 years has been used to forecast the sales figures of the next
five years, from 2016 to 2020. There are various factors that are considered as the sales
determinants. These factors include Gross Domestic product (GDP), Average Price Index,
Population, Survey Score, number of advertisements and the number of stores. The relationship
between these variables in predicting the sales figures for the countries has to be estimated. To
establish the association between three variables such as Survey Score, number of
advertisements and number of stores, a correlation analysis has been made. Using multiple linear
regression, the relationship of the variables which are the sales determinants as mentioned above
with sales has been established. Using this relationship, the sales figures for the future years can
be forecasted for each of the three different countries.
The second part of this study includes a business scenario for Sweden. The intention of
Schmeckt Gut is to spread his business in the Swedish market. The business strategy is designed
on the basis of the sales trend in a particular market. There is no sales data available for Sweden.
Thus, the sales data has to be taken from the country which has a GDP or Price index close to
Sweden. Suggestions for sales expansion in Sweden is given in the end after the analysis will be
performed.
Paraphrase This Document
Need a fresh take? Get an instant paraphrase of this document with our AI Paraphraser
4STATISTICS FOR FINANCIAL DECISIONS
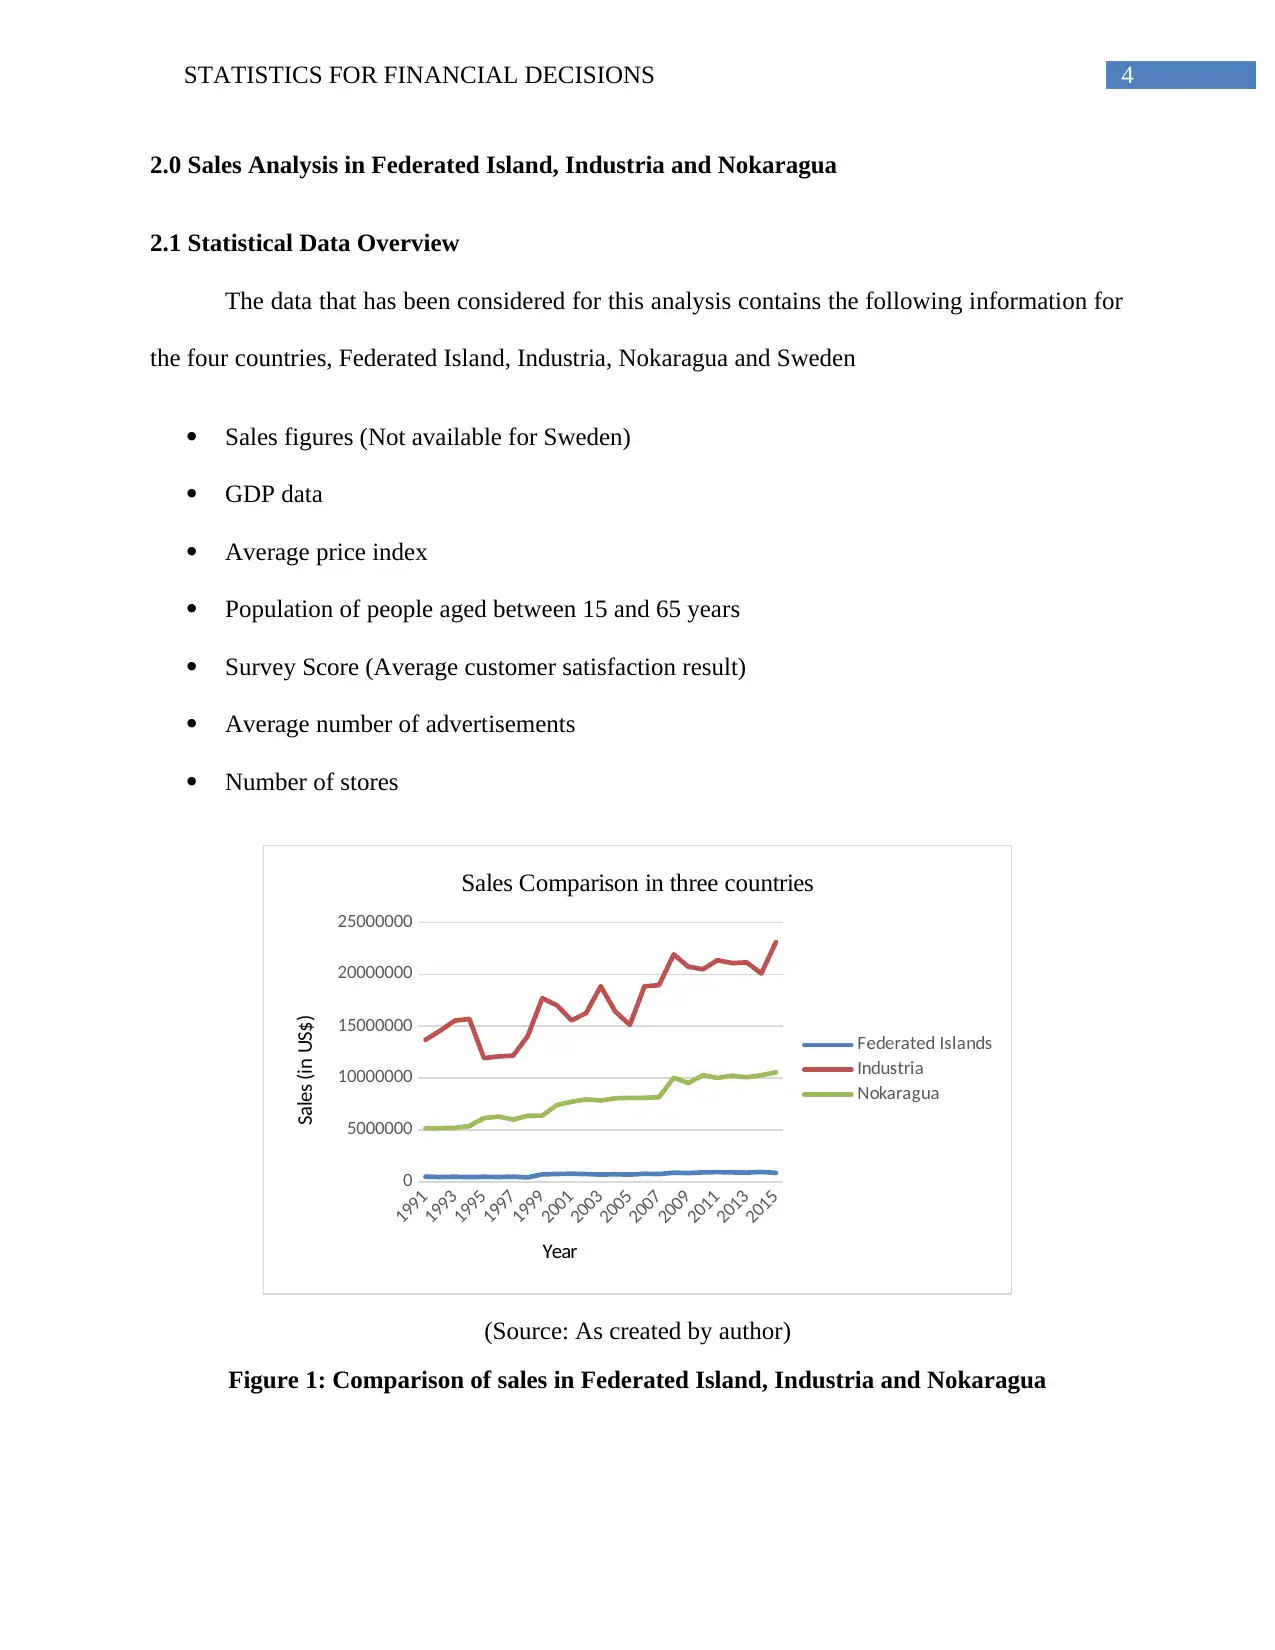
2.0 Sales Analysis in Federated Island, Industria and Nokaragua
2.1 Statistical Data Overview
The data that has been considered for this analysis contains the following information for
the four countries, Federated Island, Industria, Nokaragua and Sweden
Sales figures (Not available for Sweden)
GDP data
Average price index
Population of people aged between 15 and 65 years
Survey Score (Average customer satisfaction result)
Average number of advertisements
Number of stores
1991
1993
1995
1997
1999
2001
2003
2005
2007
2009
2011
2013
2015
0
5000000
10000000
15000000
20000000
25000000
Sales Comparison in three countries
Federated Islands
Industria
Nokaragua
Year
Sales (in US$)
(Source: As created by author)
Figure 1: Comparison of sales in Federated Island, Industria and Nokaragua
5STATISTICS FOR FINANCIAL DECISIONS
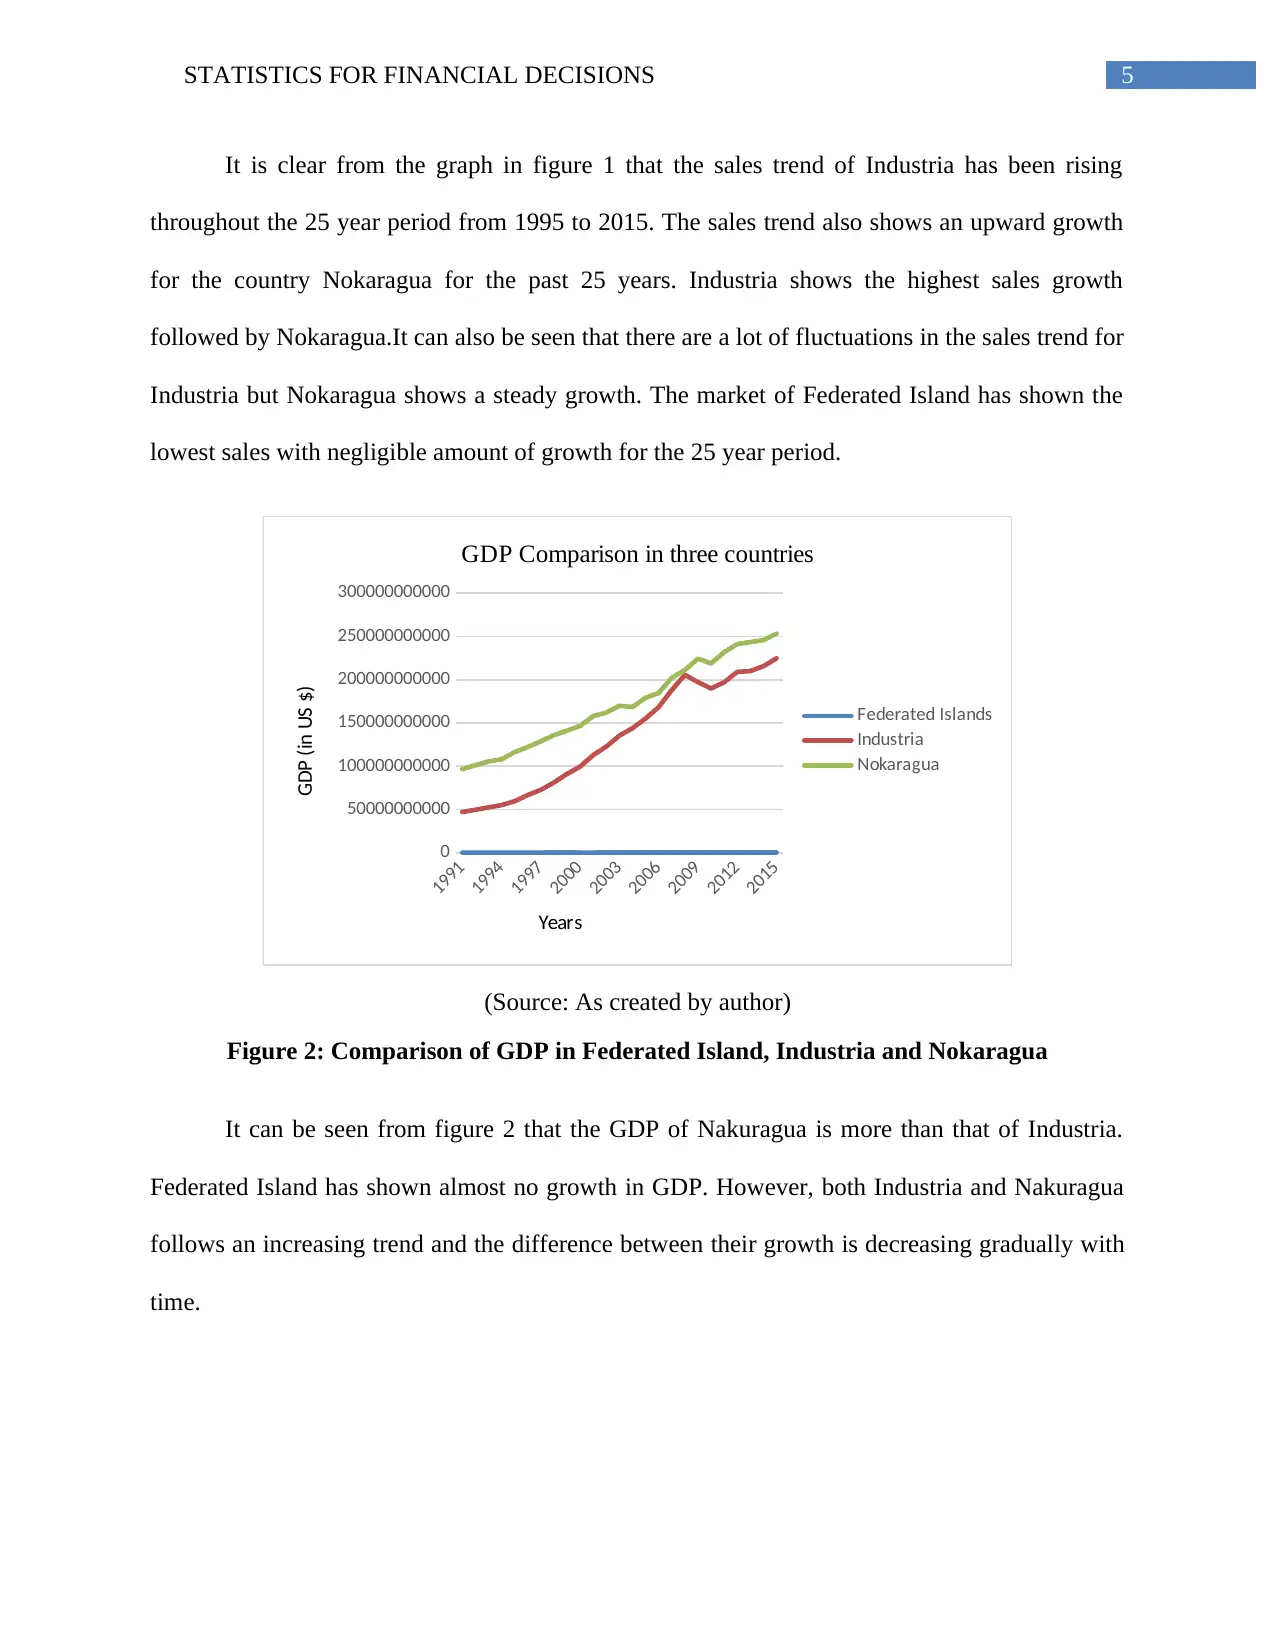
It is clear from the graph in figure 1 that the sales trend of Industria has been rising
throughout the 25 year period from 1995 to 2015. The sales trend also shows an upward growth
for the country Nokaragua for the past 25 years. Industria shows the highest sales growth
followed by Nokaragua.It can also be seen that there are a lot of fluctuations in the sales trend for
Industria but Nokaragua shows a steady growth. The market of Federated Island has shown the
lowest sales with negligible amount of growth for the 25 year period.
1991
1994
1997
2000
2003
2006
2009
2012
2015
0
50000000000
100000000000
150000000000
200000000000
250000000000
300000000000
GDP Comparison in three countries
Federated Islands
Industria
Nokaragua
Years
GDP (in US $)
(Source: As created by author)
Figure 2: Comparison of GDP in Federated Island, Industria and Nokaragua
It can be seen from figure 2 that the GDP of Nakuragua is more than that of Industria.
Federated Island has shown almost no growth in GDP. However, both Industria and Nakuragua
follows an increasing trend and the difference between their growth is decreasing gradually with
time.
⊘ This is a preview!⊘
Do you want full access?
Subscribe today to unlock all pages.
Trusted by 1+ million students worldwide
6STATISTICS FOR FINANCIAL DECISIONS
1991
1993
1995
1997
1999
2001
2003
2005
2007
2009
2011
2013
2015
0
1
2
3
4
5
6
7
8
Comparison of Price Index
Federated Islands
Industria
Nokaragua
Year
Average Price Index (in %)
(Source: As created by author)
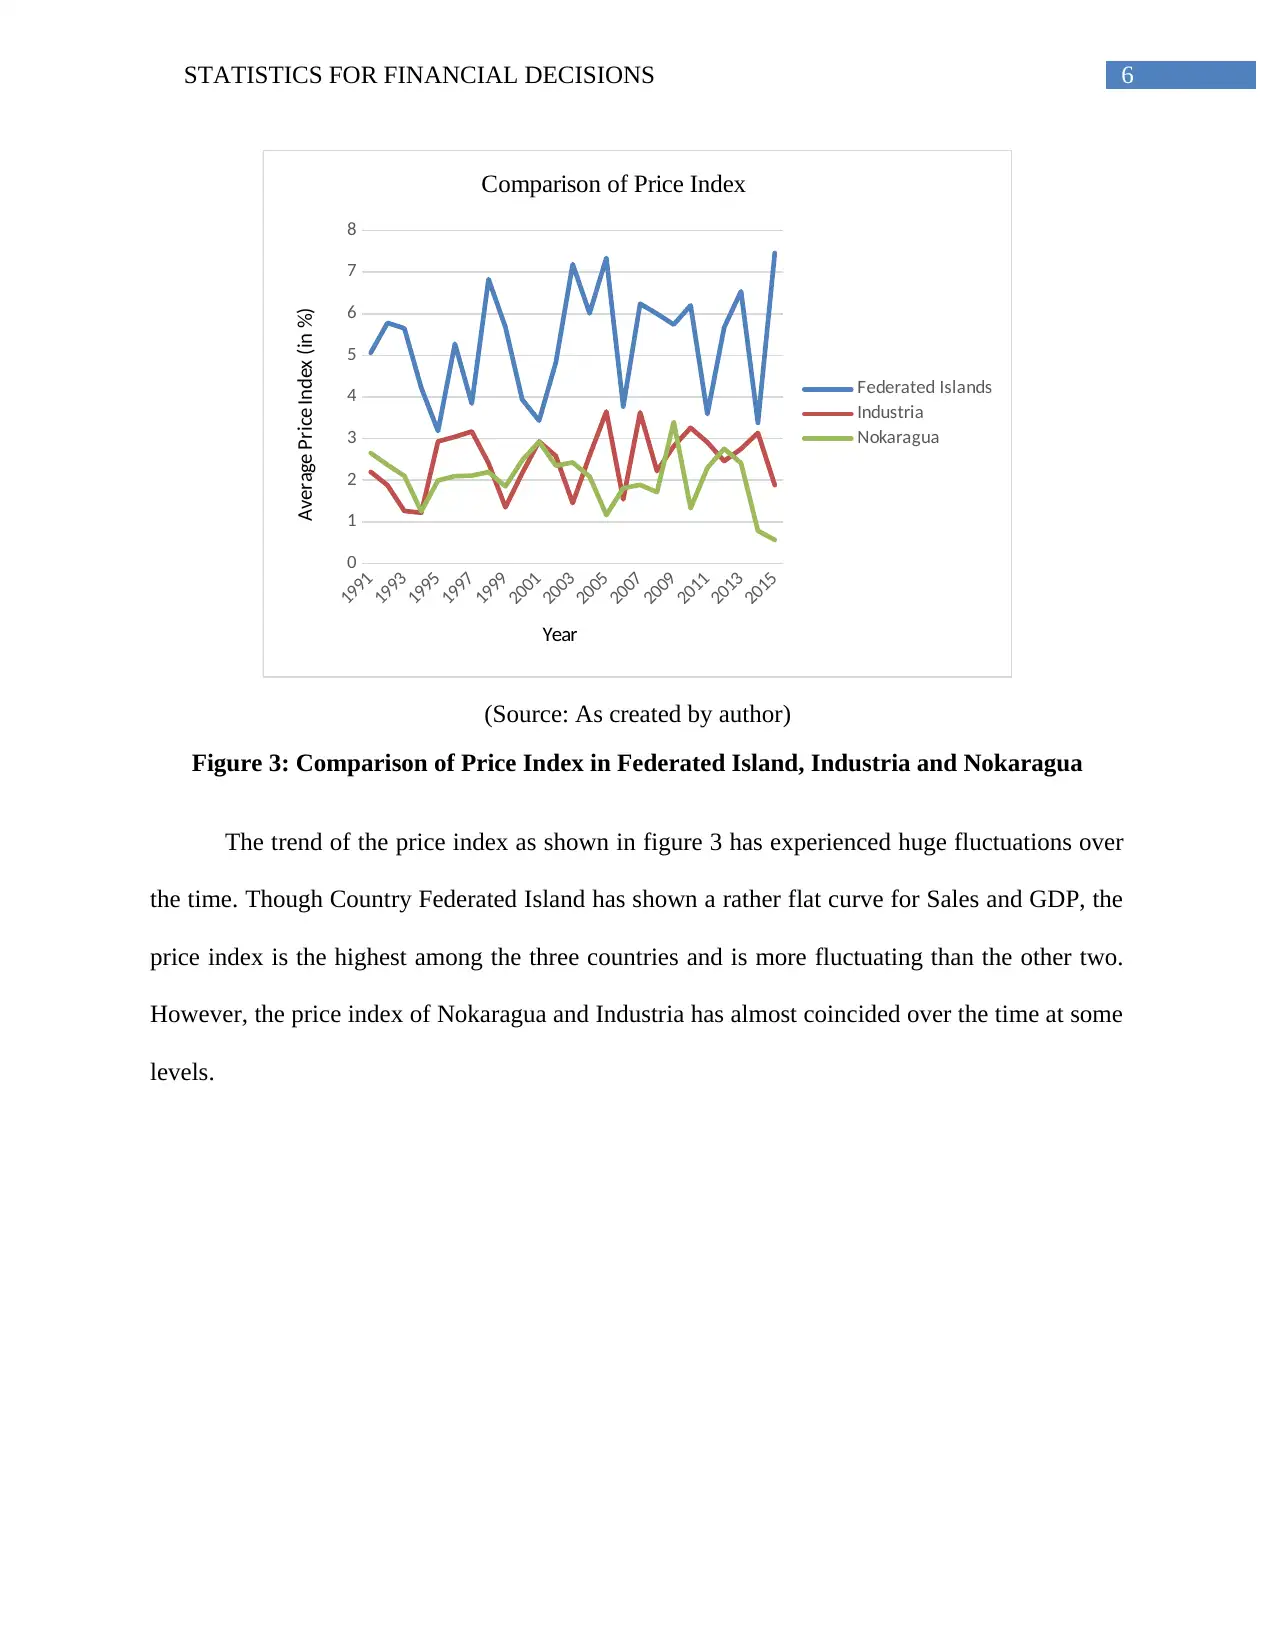
Figure 3: Comparison of Price Index in Federated Island, Industria and Nokaragua
The trend of the price index as shown in figure 3 has experienced huge fluctuations over
the time. Though Country Federated Island has shown a rather flat curve for Sales and GDP, the
price index is the highest among the three countries and is more fluctuating than the other two.
However, the price index of Nokaragua and Industria has almost coincided over the time at some
levels.
1991
1993
1995
1997
1999
2001
2003
2005
2007
2009
2011
2013
2015
0
1
2
3
4
5
6
7
8
Comparison of Price Index
Federated Islands
Industria
Nokaragua
Year
Average Price Index (in %)
(Source: As created by author)
Figure 3: Comparison of Price Index in Federated Island, Industria and Nokaragua
The trend of the price index as shown in figure 3 has experienced huge fluctuations over
the time. Though Country Federated Island has shown a rather flat curve for Sales and GDP, the
price index is the highest among the three countries and is more fluctuating than the other two.
However, the price index of Nokaragua and Industria has almost coincided over the time at some
levels.
Paraphrase This Document
Need a fresh take? Get an instant paraphrase of this document with our AI Paraphraser
7STATISTICS FOR FINANCIAL DECISIONS
1991
1993
1995
1997
1999
2001
2003
2005
2007
2009
2011
2013
2015
0
500000
1000000
1500000
2000000
2500000
3000000
3500000
4000000
Population Comparison
Federated Islands
Industria
Nokaragua
Year
Population (15 - 65 Years)
(Source: As created by author)
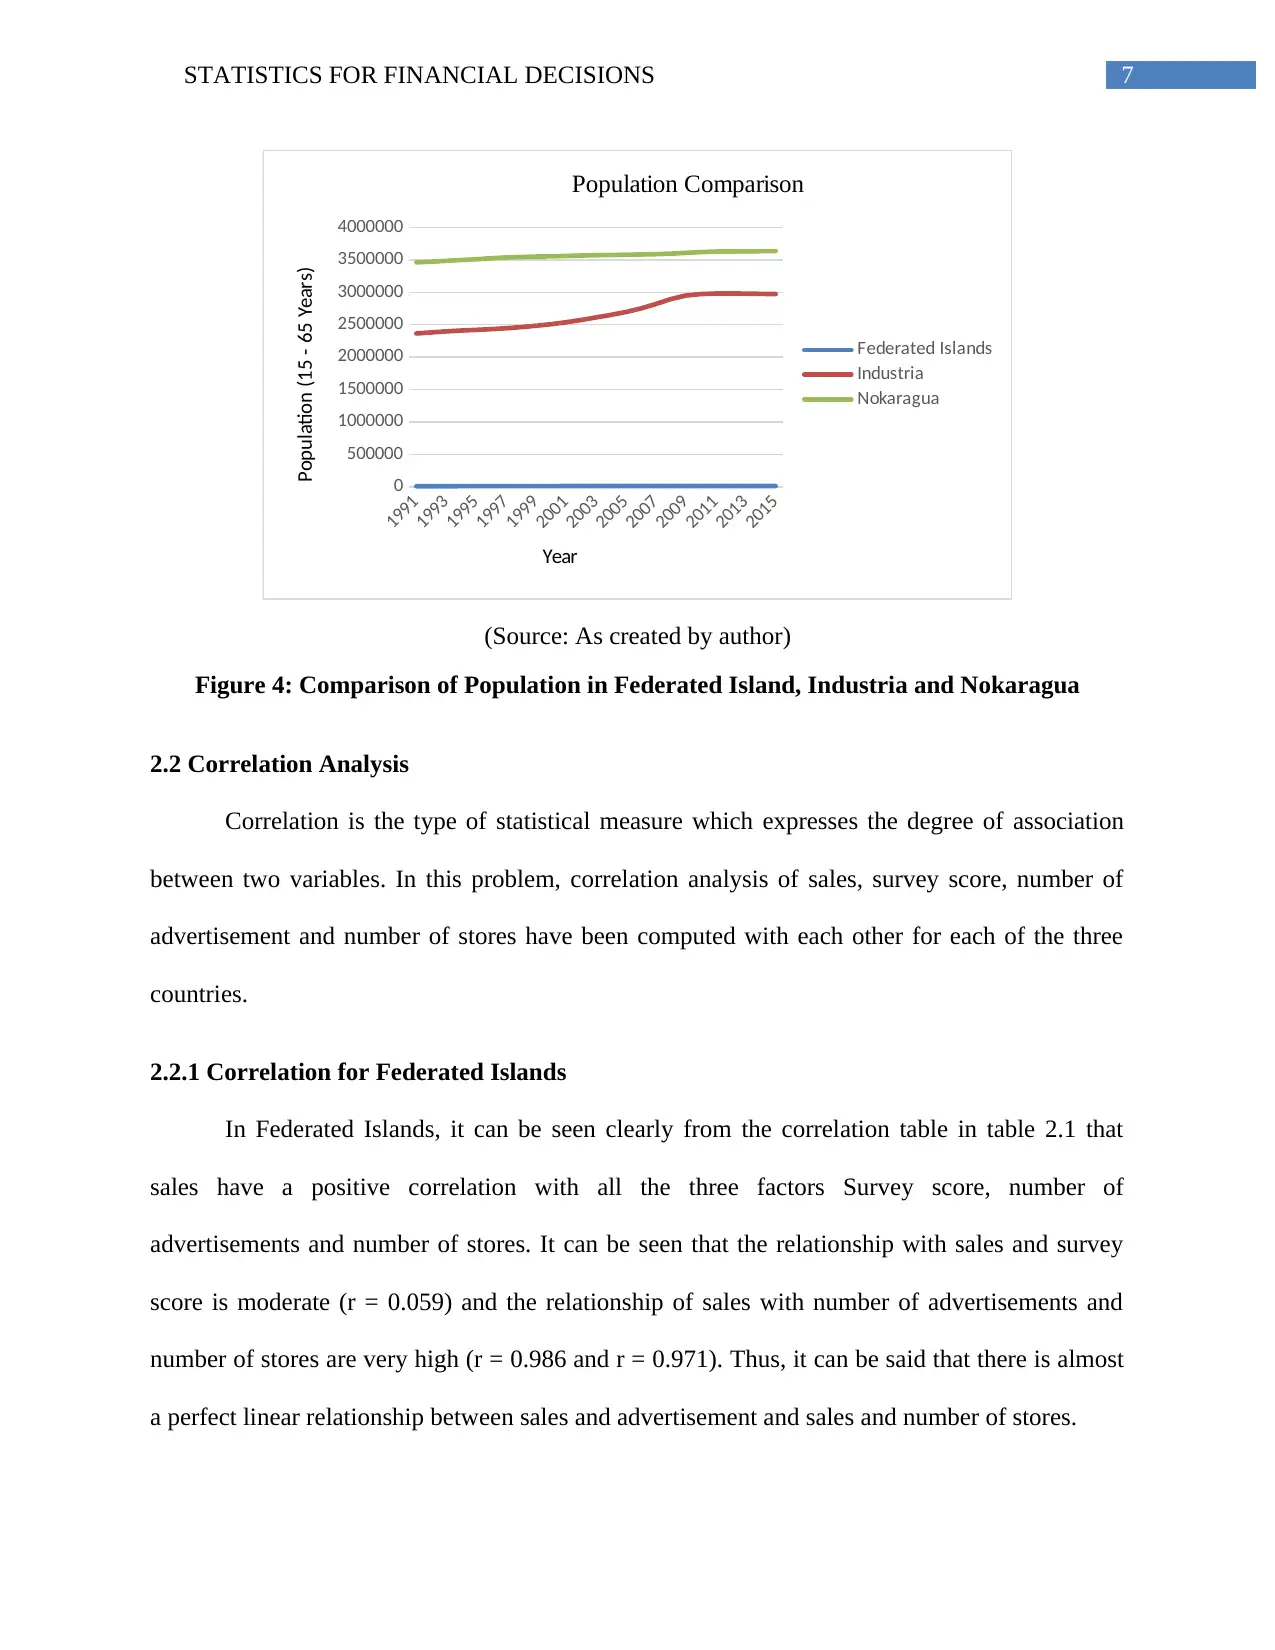
Figure 4: Comparison of Population in Federated Island, Industria and Nokaragua
2.2 Correlation Analysis
Correlation is the type of statistical measure which expresses the degree of association
between two variables. In this problem, correlation analysis of sales, survey score, number of
advertisement and number of stores have been computed with each other for each of the three
countries.
2.2.1 Correlation for Federated Islands
In Federated Islands, it can be seen clearly from the correlation table in table 2.1 that
sales have a positive correlation with all the three factors Survey score, number of
advertisements and number of stores. It can be seen that the relationship with sales and survey
score is moderate (r = 0.059) and the relationship of sales with number of advertisements and
number of stores are very high (r = 0.986 and r = 0.971). Thus, it can be said that there is almost
a perfect linear relationship between sales and advertisement and sales and number of stores.
1991
1993
1995
1997
1999
2001
2003
2005
2007
2009
2011
2013
2015
0
500000
1000000
1500000
2000000
2500000
3000000
3500000
4000000
Population Comparison
Federated Islands
Industria
Nokaragua
Year
Population (15 - 65 Years)
(Source: As created by author)
Figure 4: Comparison of Population in Federated Island, Industria and Nokaragua
2.2 Correlation Analysis
Correlation is the type of statistical measure which expresses the degree of association
between two variables. In this problem, correlation analysis of sales, survey score, number of
advertisement and number of stores have been computed with each other for each of the three
countries.
2.2.1 Correlation for Federated Islands
In Federated Islands, it can be seen clearly from the correlation table in table 2.1 that
sales have a positive correlation with all the three factors Survey score, number of
advertisements and number of stores. It can be seen that the relationship with sales and survey
score is moderate (r = 0.059) and the relationship of sales with number of advertisements and
number of stores are very high (r = 0.986 and r = 0.971). Thus, it can be said that there is almost
a perfect linear relationship between sales and advertisement and sales and number of stores.
8STATISTICS FOR FINANCIAL DECISIONS
Table 2.1: Correlation table for Federated Islands
Sales US$ Survey score Advertisement Stores
Sales US$ 1
Survey score 0.589 1
Advertisement 0.986 0.548 1
Stores 0.971 0.529 0.971 1
(Source: As created by author)
2.2.2 Correlation for Industria
In Industria, it can be seen clearly from the correlation table in table 2.2 that sales have a
negative correlation with the factor Survey score. In this country, sales of a product decreases
with the increase in the survey score. However the negative relationship is not that strong. Thus,
sales do not depend much on the survey score. Sales is not much affected by the survey score. It
can be seen that the relationship with sales and with number of advertisements and number of
stores are very high (r = 0.913 and r = 0.916). Thus, it can be said that there is almost a perfect
linear relationship between sales and advertisement and sales and number of stores.
Table 2.2: Correlation table for Industria
Sales US$ Survey score Advertisement Stores
Sales US$ 1
Survey score -0.201 1
Advertisement 0.913 -0.202 1
Stores 0.916 -0.231 0.970 1
(Source: As created by author)
2.2.3 Correlation for Nokaragua
In the country Nokaragua, it can be seen clearly from the correlation table in table 2.3
that sales have a very weak positive correlation with the factor Survey score (r = 0.02). Thus,
sales do not depend at all on the survey score. It can be seen that the relationship with sales and
⊘ This is a preview!⊘
Do you want full access?
Subscribe today to unlock all pages.
Trusted by 1+ million students worldwide
9STATISTICS FOR FINANCIAL DECISIONS
with number of advertisements and number of stores are very high (r = 0.99 and r = 0.99). Thus,
it can be said that there is a perfect linear relationship between sales and advertisement and sales
and number of stores.
Table 2.3: Correlation table for Nokaragua
Sales US$ Survey score Advertisement Stores
Sales US$ 1
Survey score 0.02 1
Advertisement 0.99 0.00 1
Stores 0.99 0.01 0.99 1
(Source: As created by author)
2.3 Multiple Regression Analysis for prediction of Sales
The relationship of sales with factors such as GDP, price index, population, satisfaction
scores, number of advertisements and number of stores has been established with the help of a
multiple regression model. The general form of the estimated equation can be given by:
ln (Sales¿ ¿t )=α 0 +α 1 ln (GDP¿¿ t)+α 2 ln ( Price Index ¿¿ t)+α 3 ln (Population¿¿ t)+α4 ln (Satisfaction ¿¿ t)+α 5
From the regression analysis, the values of the coefficients in the model can be
determined and then the equation can be used to predict the sales of the countries. The predicted
sales equations for the three selected countries are given in the following sections.
2.3.1 Federated Island sales prediction
The regression equation for the prediction of sales for the country Federated Island is
given by the following equation:
ln (Sales¿ ¿t )=12.76+0.07 ln (GDP¿¿ t )−0.13 ln (Price Index¿¿ t)−0.35 ln ( Population¿¿ t)+ 0.08 ln ( Satisfact
Paraphrase This Document
Need a fresh take? Get an instant paraphrase of this document with our AI Paraphraser
10STATISTICS FOR FINANCIAL DECISIONS
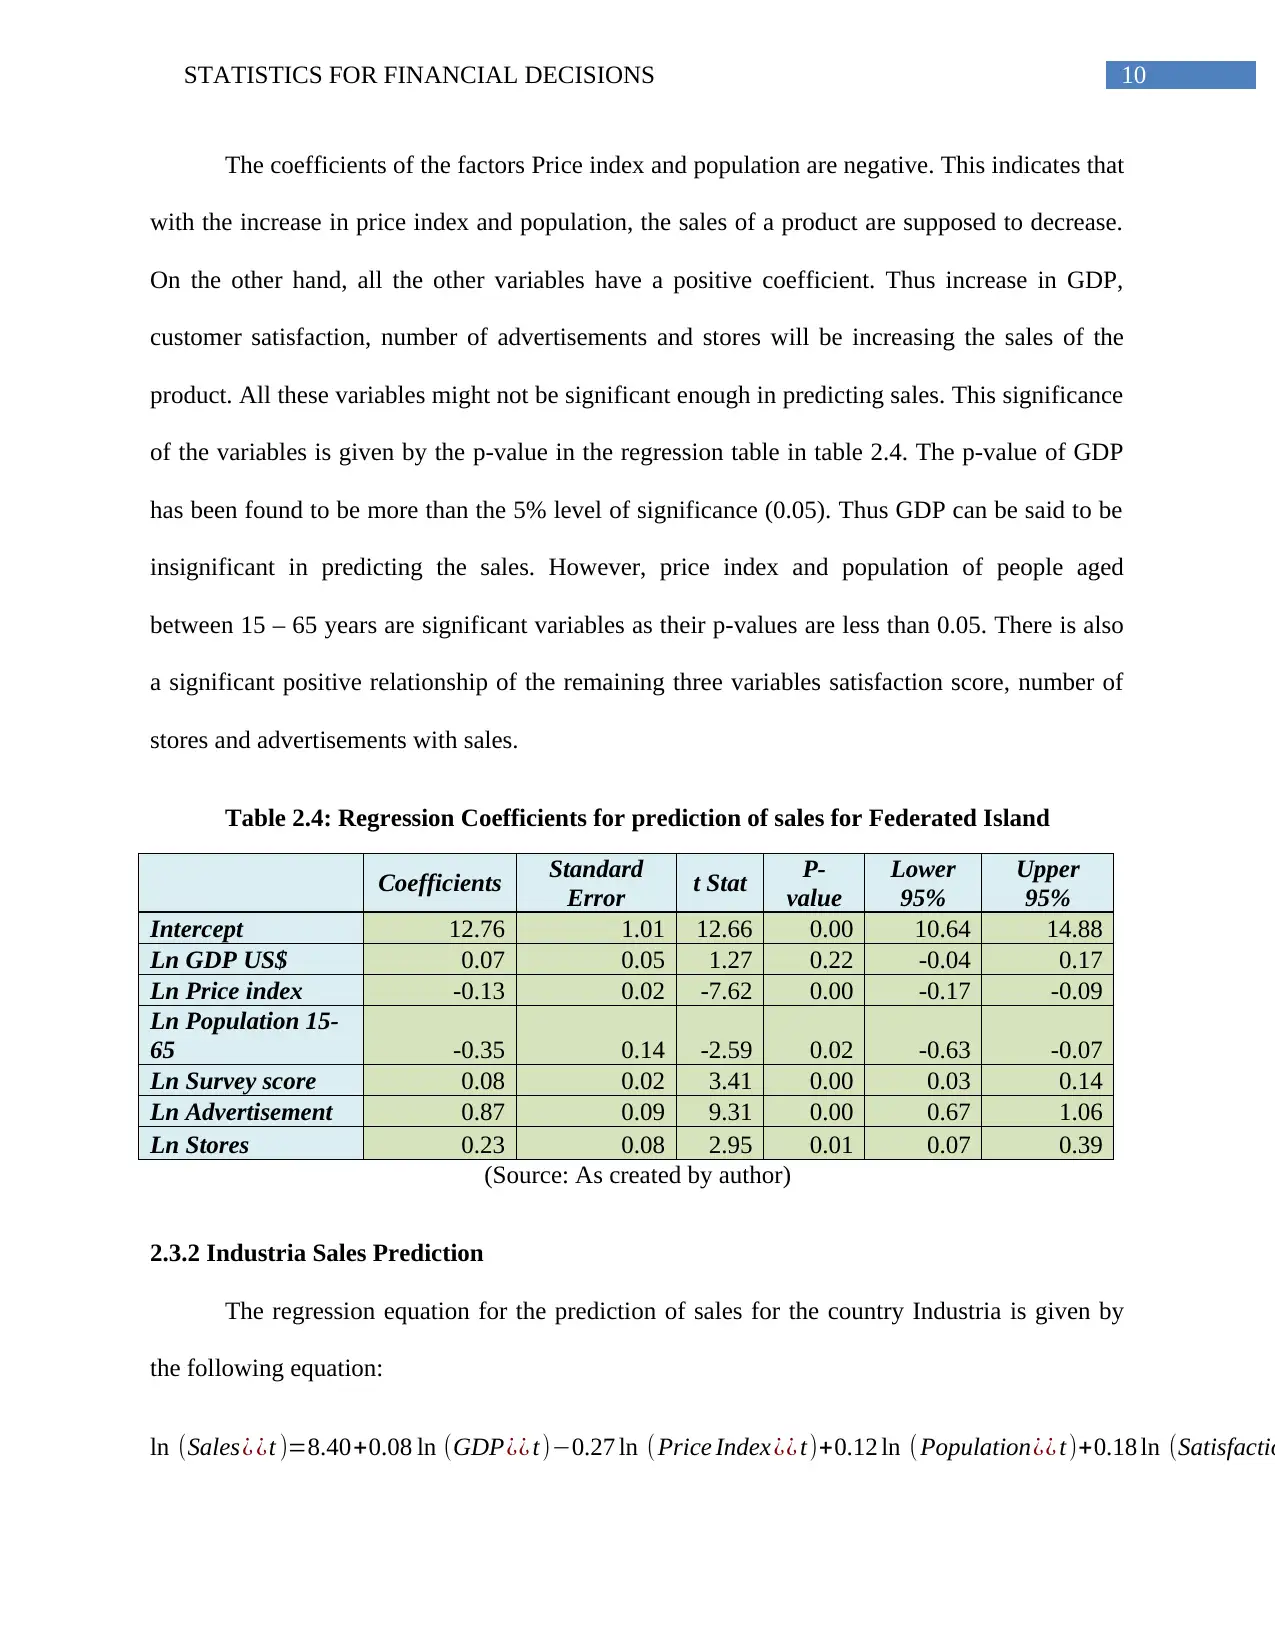
The coefficients of the factors Price index and population are negative. This indicates that
with the increase in price index and population, the sales of a product are supposed to decrease.
On the other hand, all the other variables have a positive coefficient. Thus increase in GDP,
customer satisfaction, number of advertisements and stores will be increasing the sales of the
product. All these variables might not be significant enough in predicting sales. This significance
of the variables is given by the p-value in the regression table in table 2.4. The p-value of GDP
has been found to be more than the 5% level of significance (0.05). Thus GDP can be said to be
insignificant in predicting the sales. However, price index and population of people aged
between 15 – 65 years are significant variables as their p-values are less than 0.05. There is also
a significant positive relationship of the remaining three variables satisfaction score, number of
stores and advertisements with sales.
Table 2.4: Regression Coefficients for prediction of sales for Federated Island
Coefficients Standard
Error t Stat P-
value
Lower
95%
Upper
95%
Intercept 12.76 1.01 12.66 0.00 10.64 14.88
Ln GDP US$ 0.07 0.05 1.27 0.22 -0.04 0.17
Ln Price index -0.13 0.02 -7.62 0.00 -0.17 -0.09
Ln Population 15-
65 -0.35 0.14 -2.59 0.02 -0.63 -0.07
Ln Survey score 0.08 0.02 3.41 0.00 0.03 0.14
Ln Advertisement 0.87 0.09 9.31 0.00 0.67 1.06
Ln Stores 0.23 0.08 2.95 0.01 0.07 0.39
(Source: As created by author)
2.3.2 Industria Sales Prediction
The regression equation for the prediction of sales for the country Industria is given by
the following equation:
ln (Sales¿ ¿t )=8.40+0.08 ln (GDP¿¿ t)−0.27 ln ( Price Index¿¿ t)+0.12 ln ( Population¿¿ t)+0.18 ln (Satisfactio
11STATISTICS FOR FINANCIAL DECISIONS
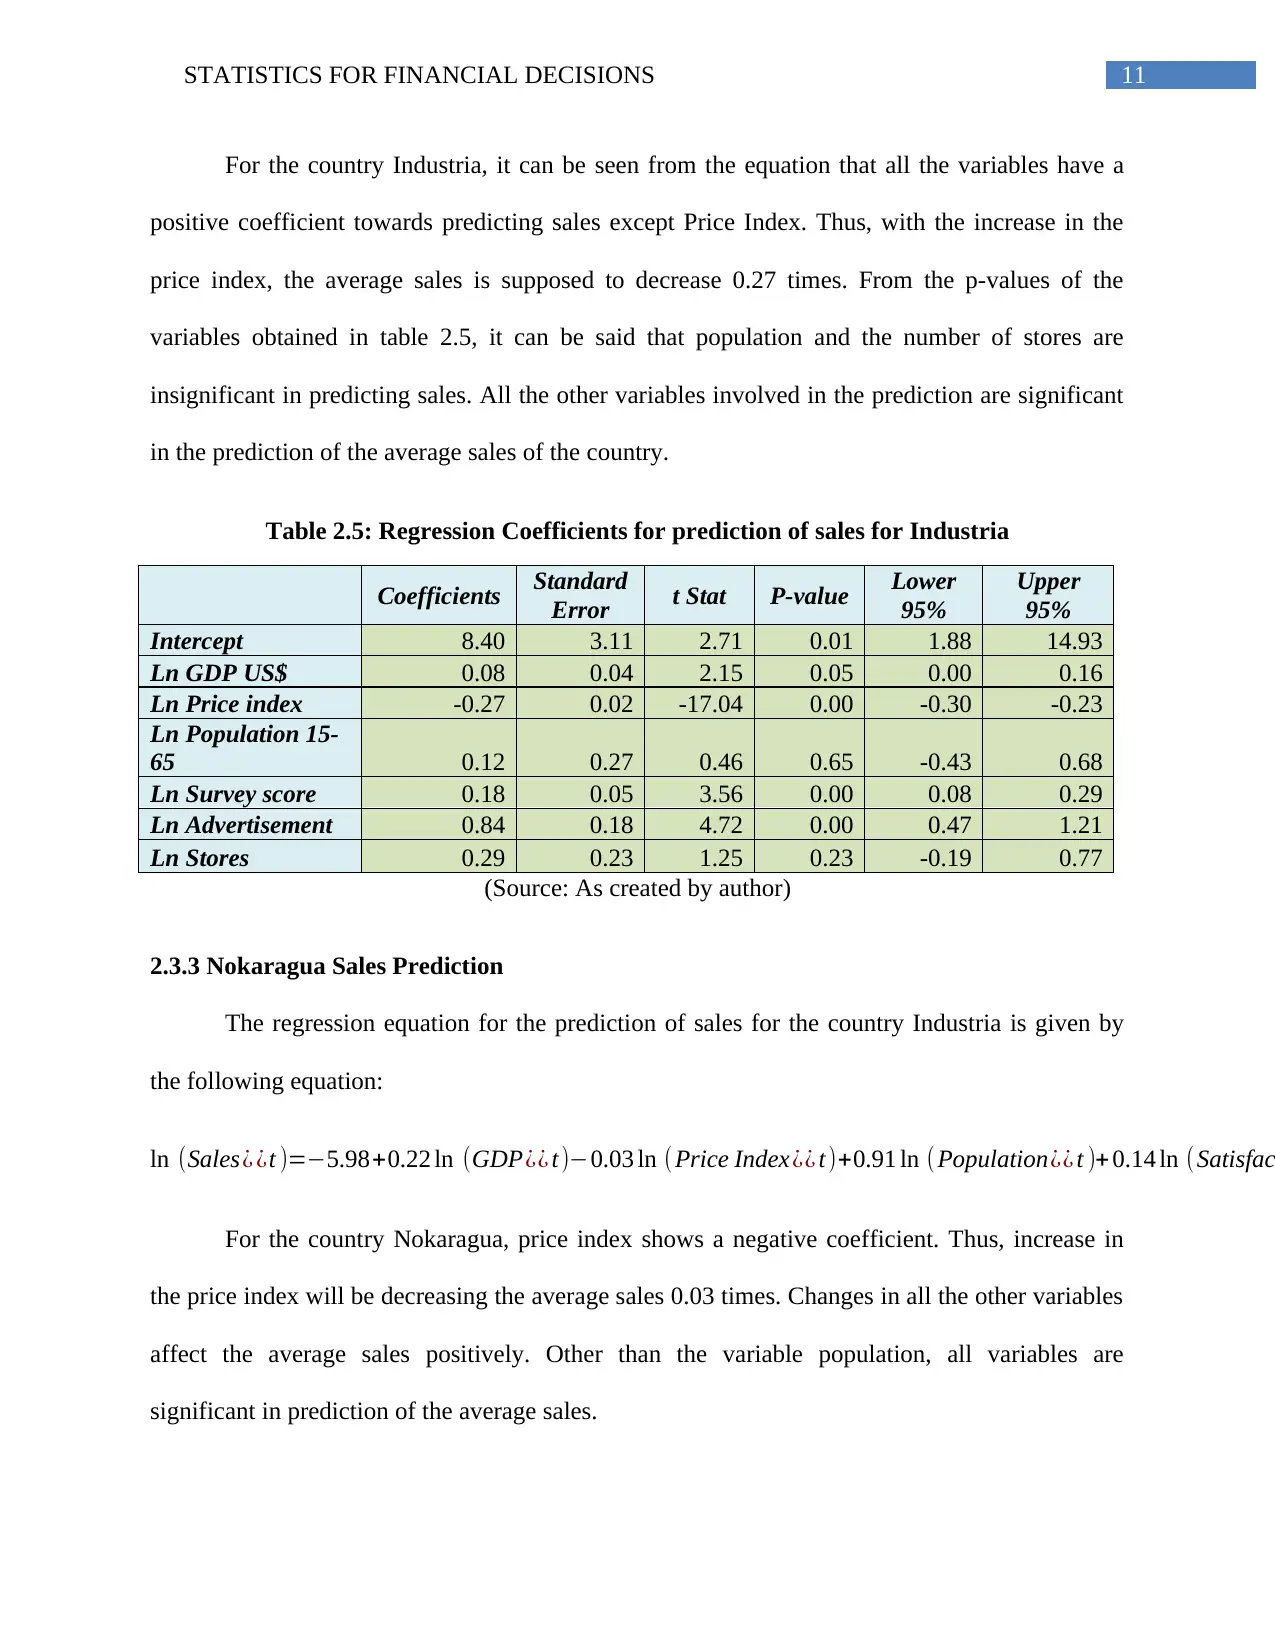
For the country Industria, it can be seen from the equation that all the variables have a
positive coefficient towards predicting sales except Price Index. Thus, with the increase in the
price index, the average sales is supposed to decrease 0.27 times. From the p-values of the
variables obtained in table 2.5, it can be said that population and the number of stores are
insignificant in predicting sales. All the other variables involved in the prediction are significant
in the prediction of the average sales of the country.
Table 2.5: Regression Coefficients for prediction of sales for Industria
Coefficients Standard
Error t Stat P-value Lower
95%
Upper
95%
Intercept 8.40 3.11 2.71 0.01 1.88 14.93
Ln GDP US$ 0.08 0.04 2.15 0.05 0.00 0.16
Ln Price index -0.27 0.02 -17.04 0.00 -0.30 -0.23
Ln Population 15-
65 0.12 0.27 0.46 0.65 -0.43 0.68
Ln Survey score 0.18 0.05 3.56 0.00 0.08 0.29
Ln Advertisement 0.84 0.18 4.72 0.00 0.47 1.21
Ln Stores 0.29 0.23 1.25 0.23 -0.19 0.77
(Source: As created by author)
2.3.3 Nokaragua Sales Prediction
The regression equation for the prediction of sales for the country Industria is given by
the following equation:
ln (Sales¿ ¿t )=−5.98+0.22 ln (GDP¿¿ t)−0.03 ln (Price Index¿¿ t)+0.91 ln (Population¿¿ t )+ 0.14 ln (Satisfac
For the country Nokaragua, price index shows a negative coefficient. Thus, increase in
the price index will be decreasing the average sales 0.03 times. Changes in all the other variables
affect the average sales positively. Other than the variable population, all variables are
significant in prediction of the average sales.
⊘ This is a preview!⊘
Do you want full access?
Subscribe today to unlock all pages.
Trusted by 1+ million students worldwide
1 out of 25
Related Documents


Your All-in-One AI-Powered Toolkit for Academic Success.
+13062052269
info@desklib.com
Available 24*7 on WhatsApp / Email
![[object Object]](/_next/static/media/star-bottom.7253800d.svg)
Unlock your academic potential
Copyright © 2020–2026 A2Z Services. All Rights Reserved. Developed and managed by ZUCOL.