Statistical Analysis of Asian Shoe Market for Manufacturing Company

Verified

Added on  2021/02/21

|17
|2234
|21
Report
AI Summary
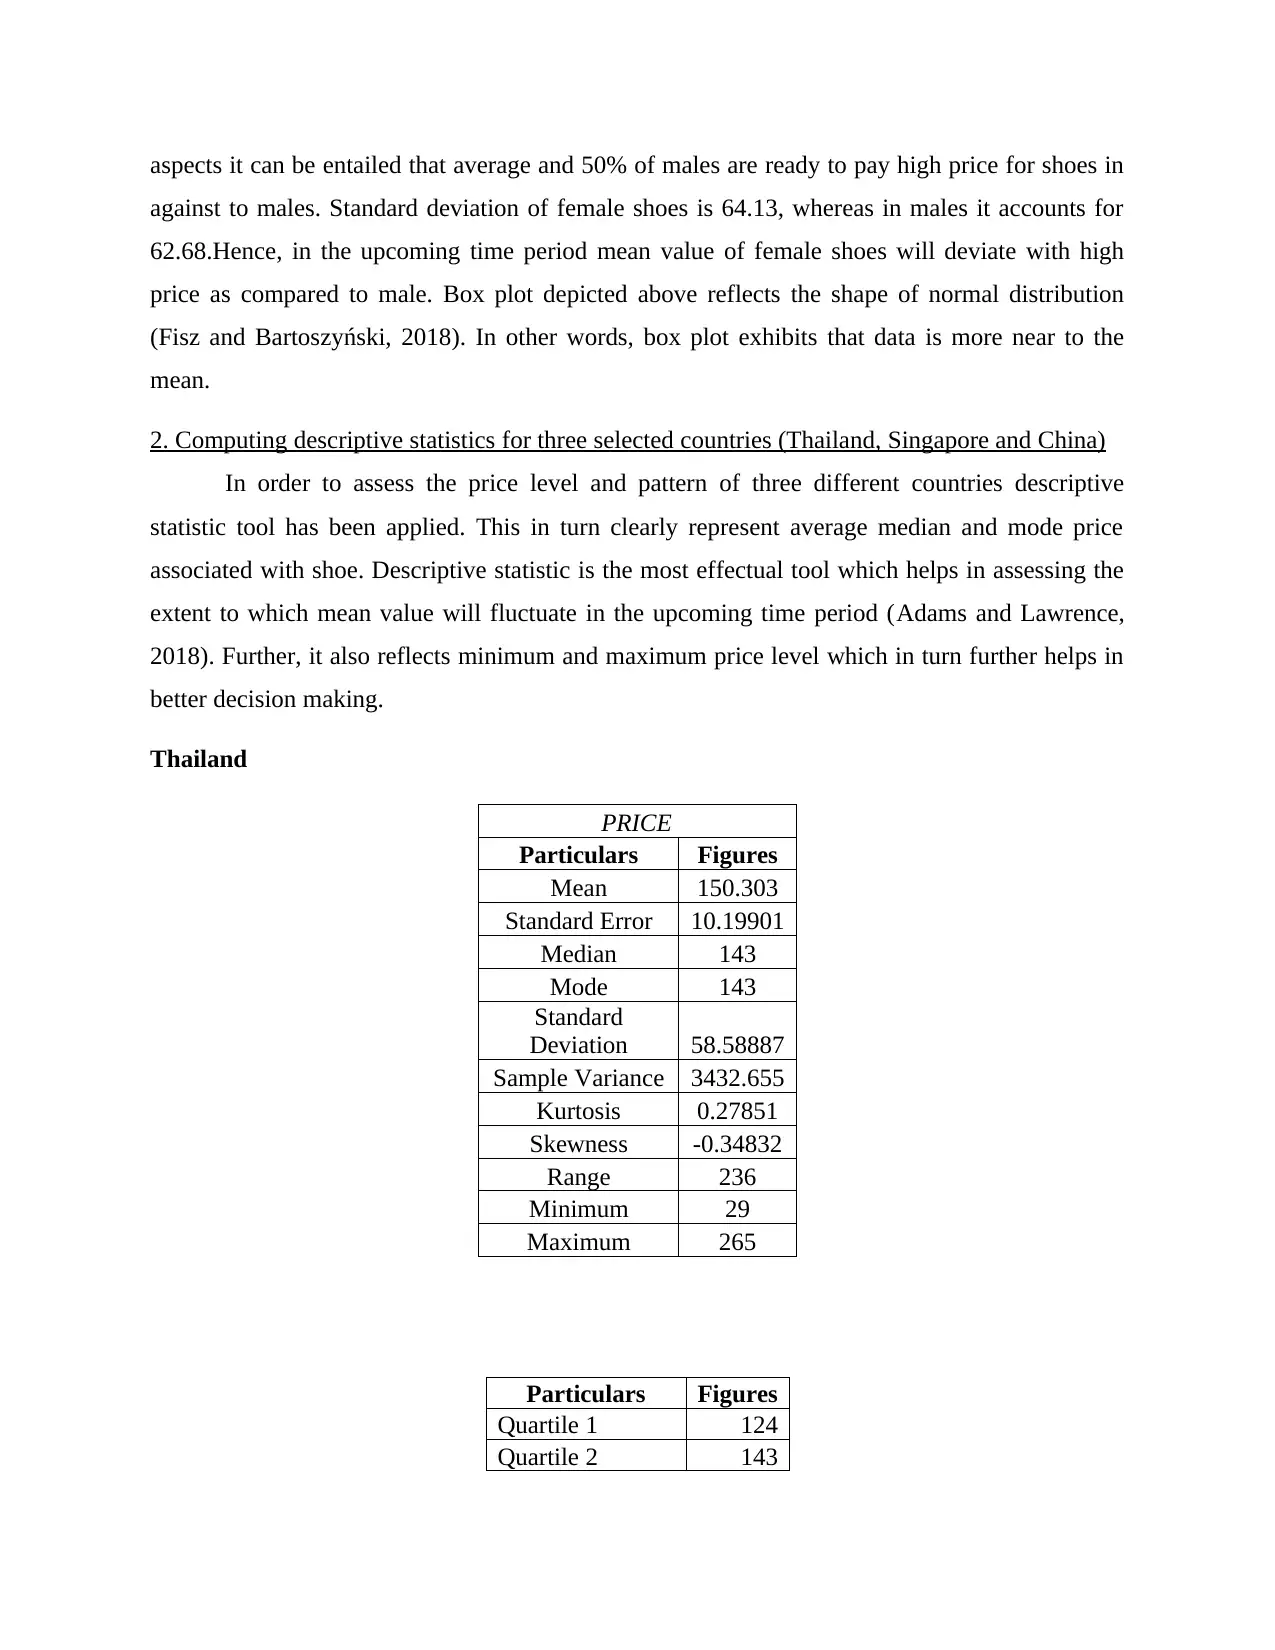
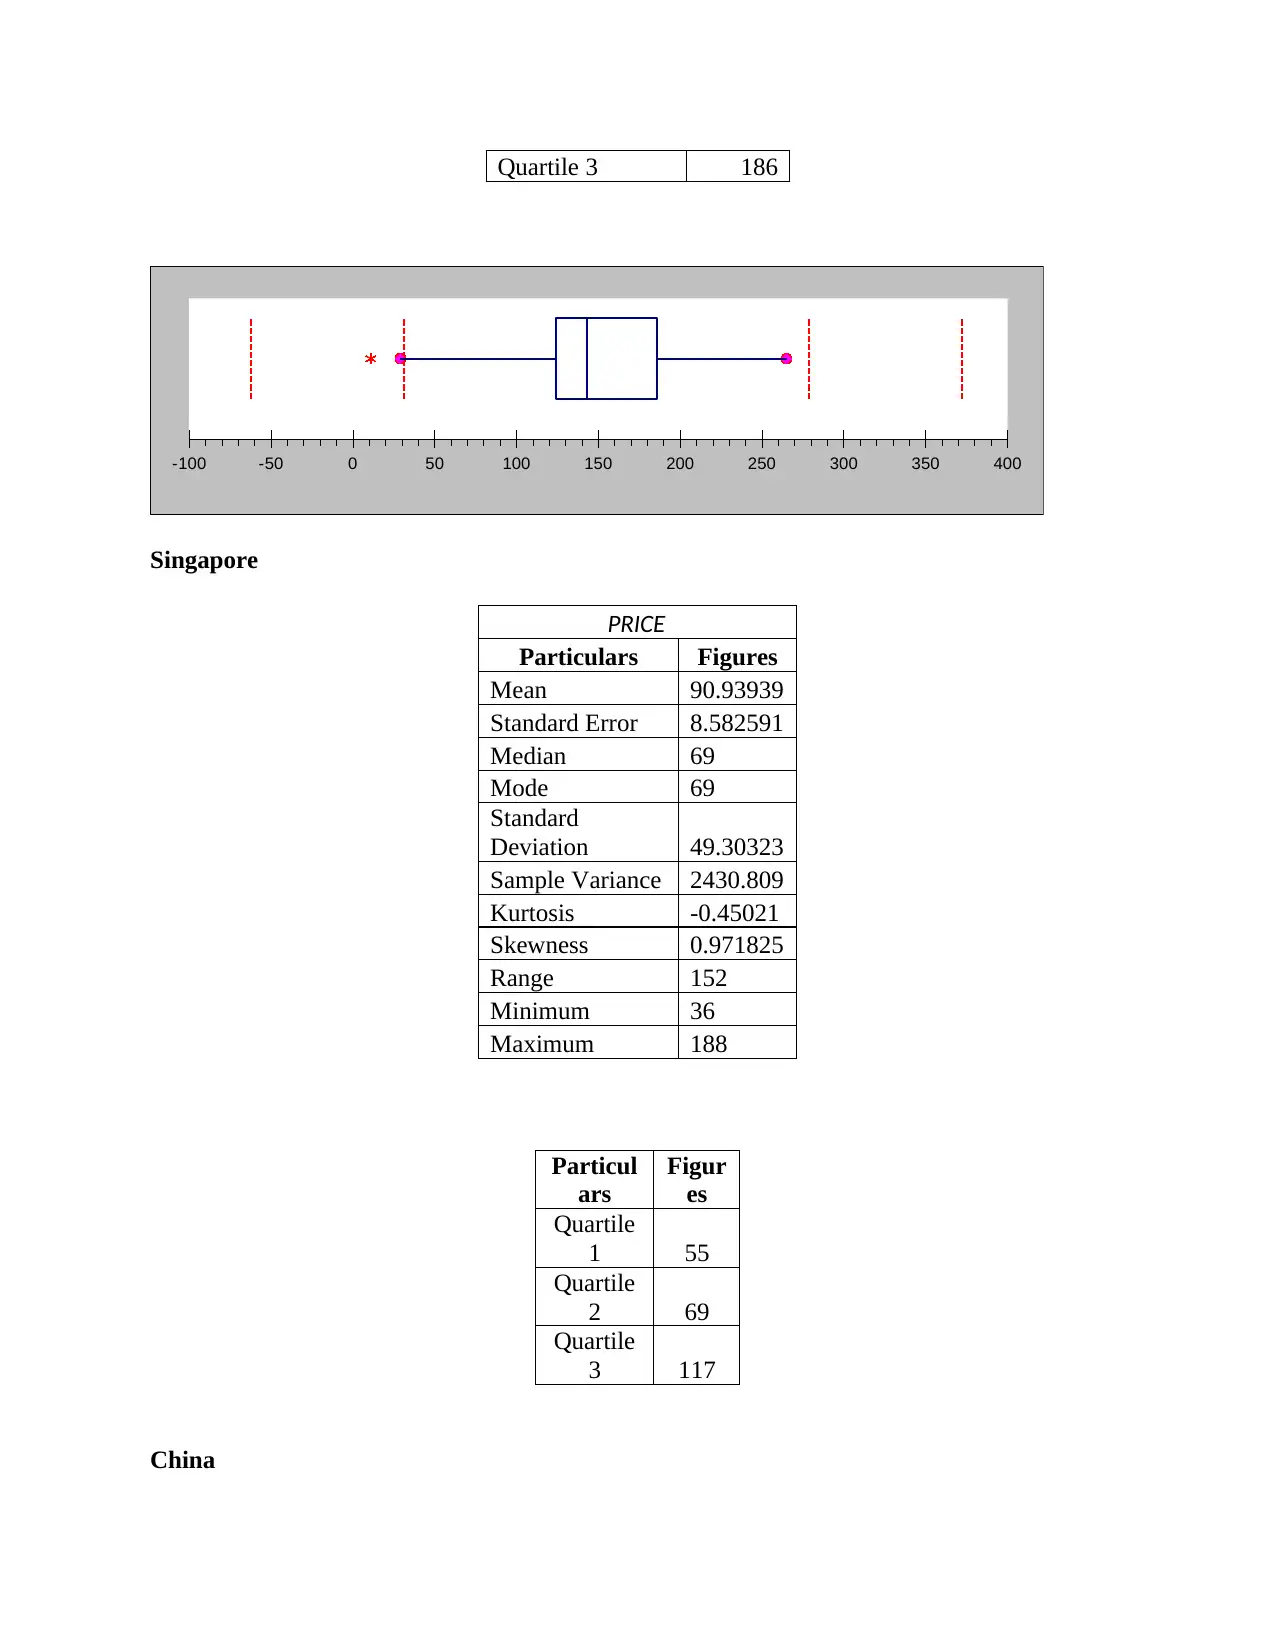
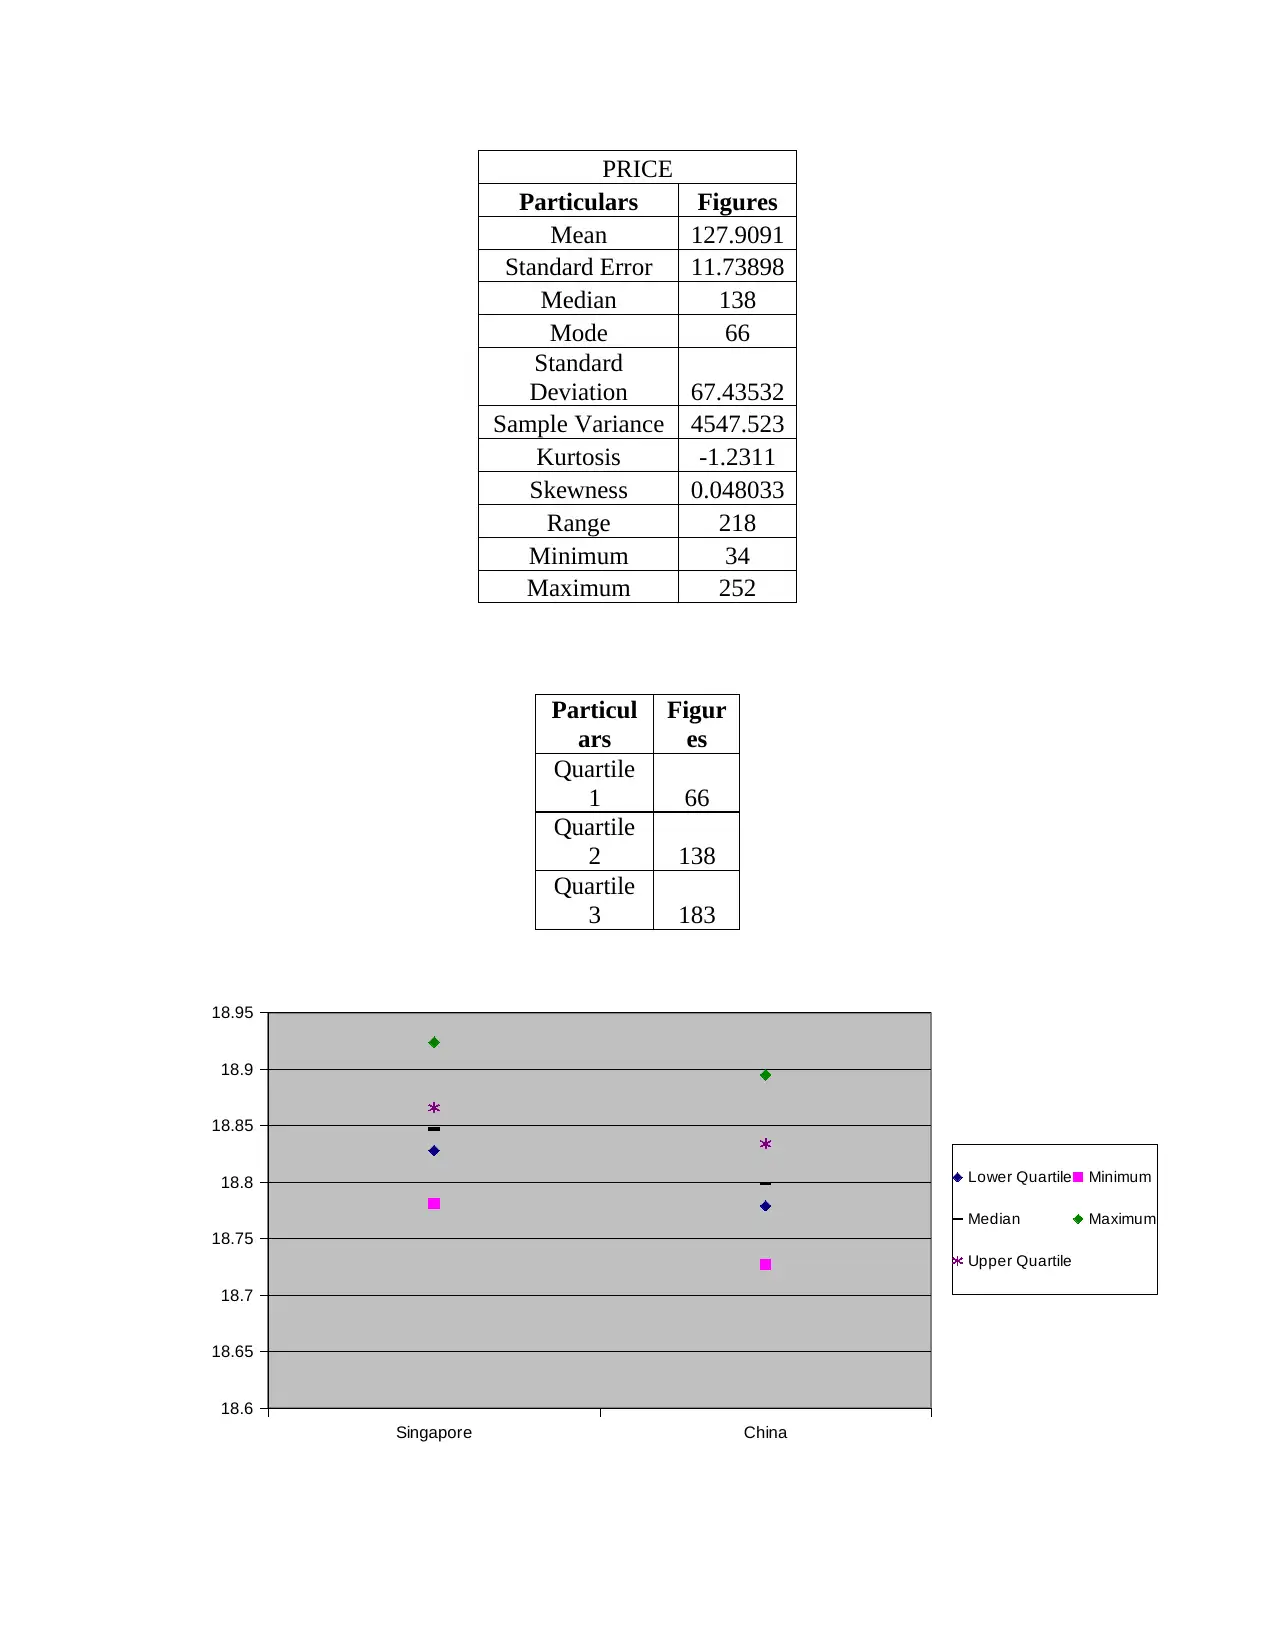
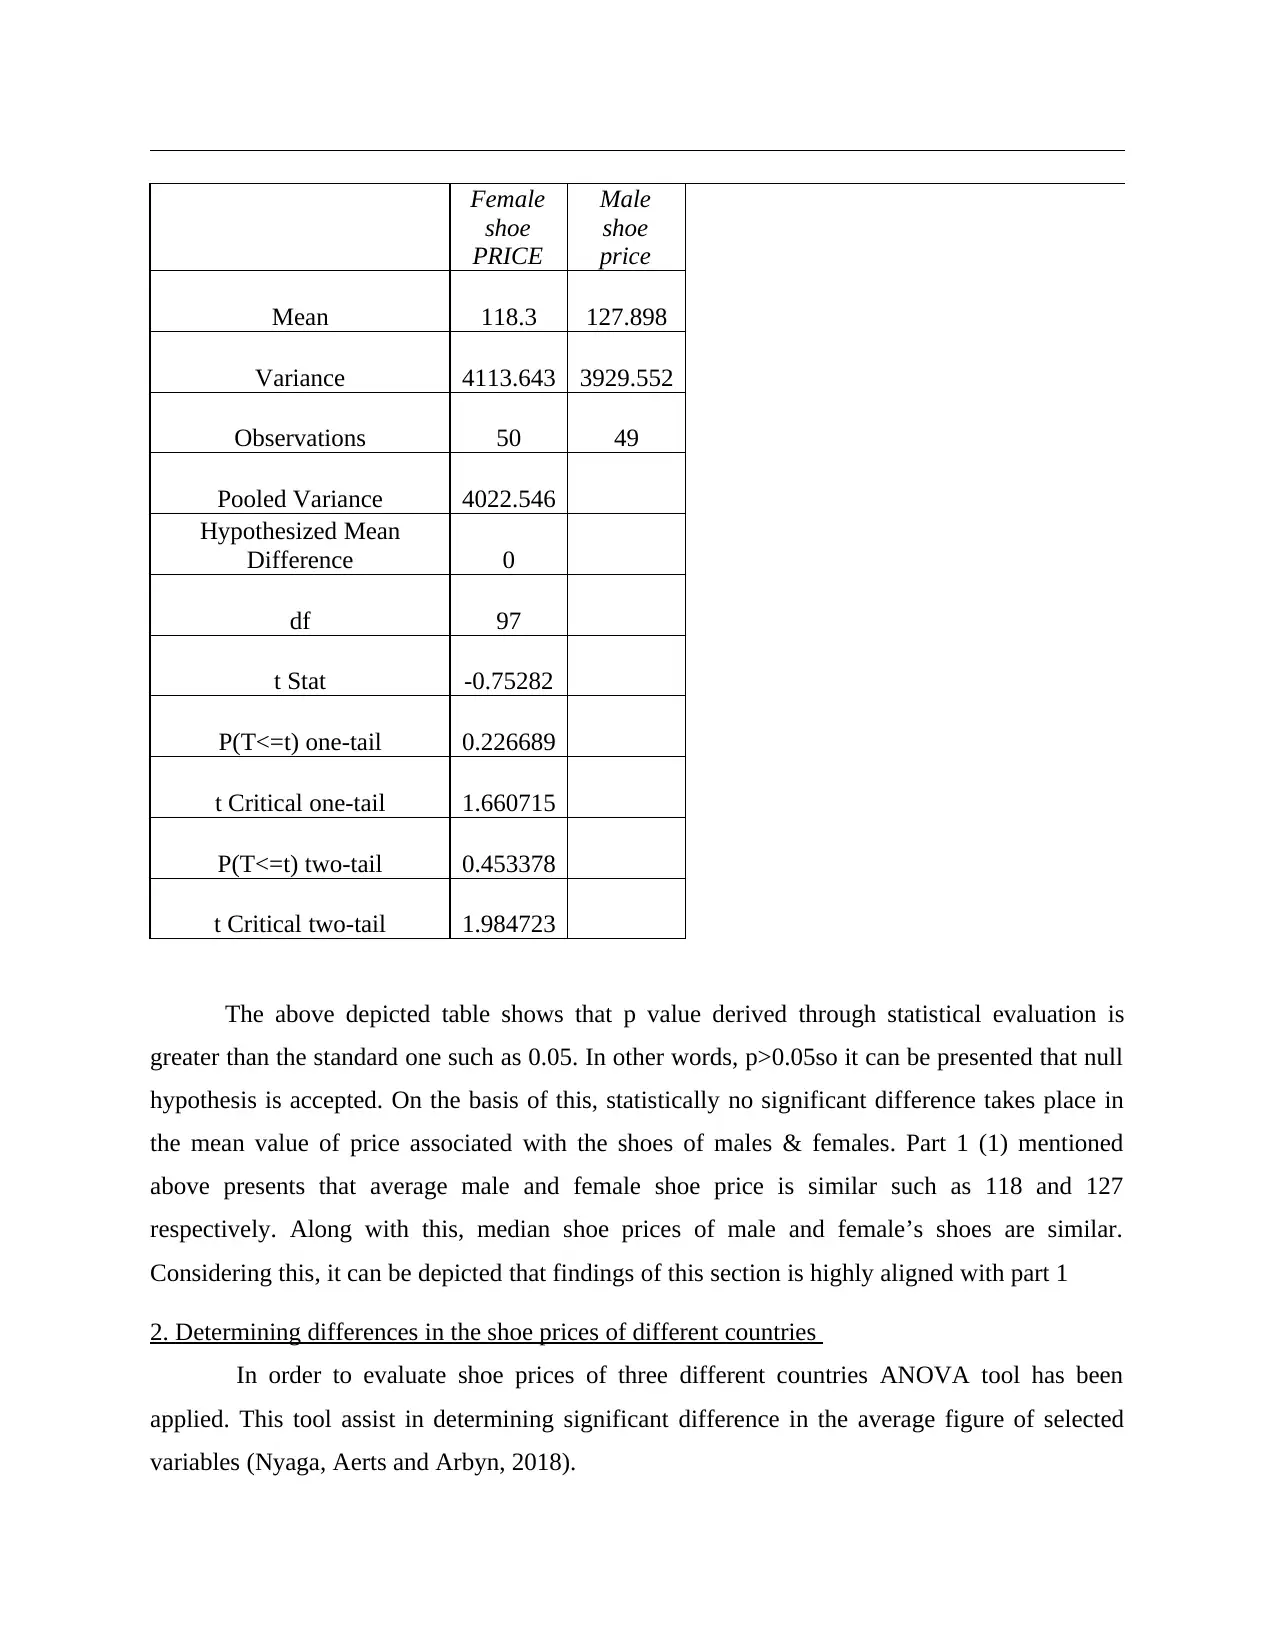
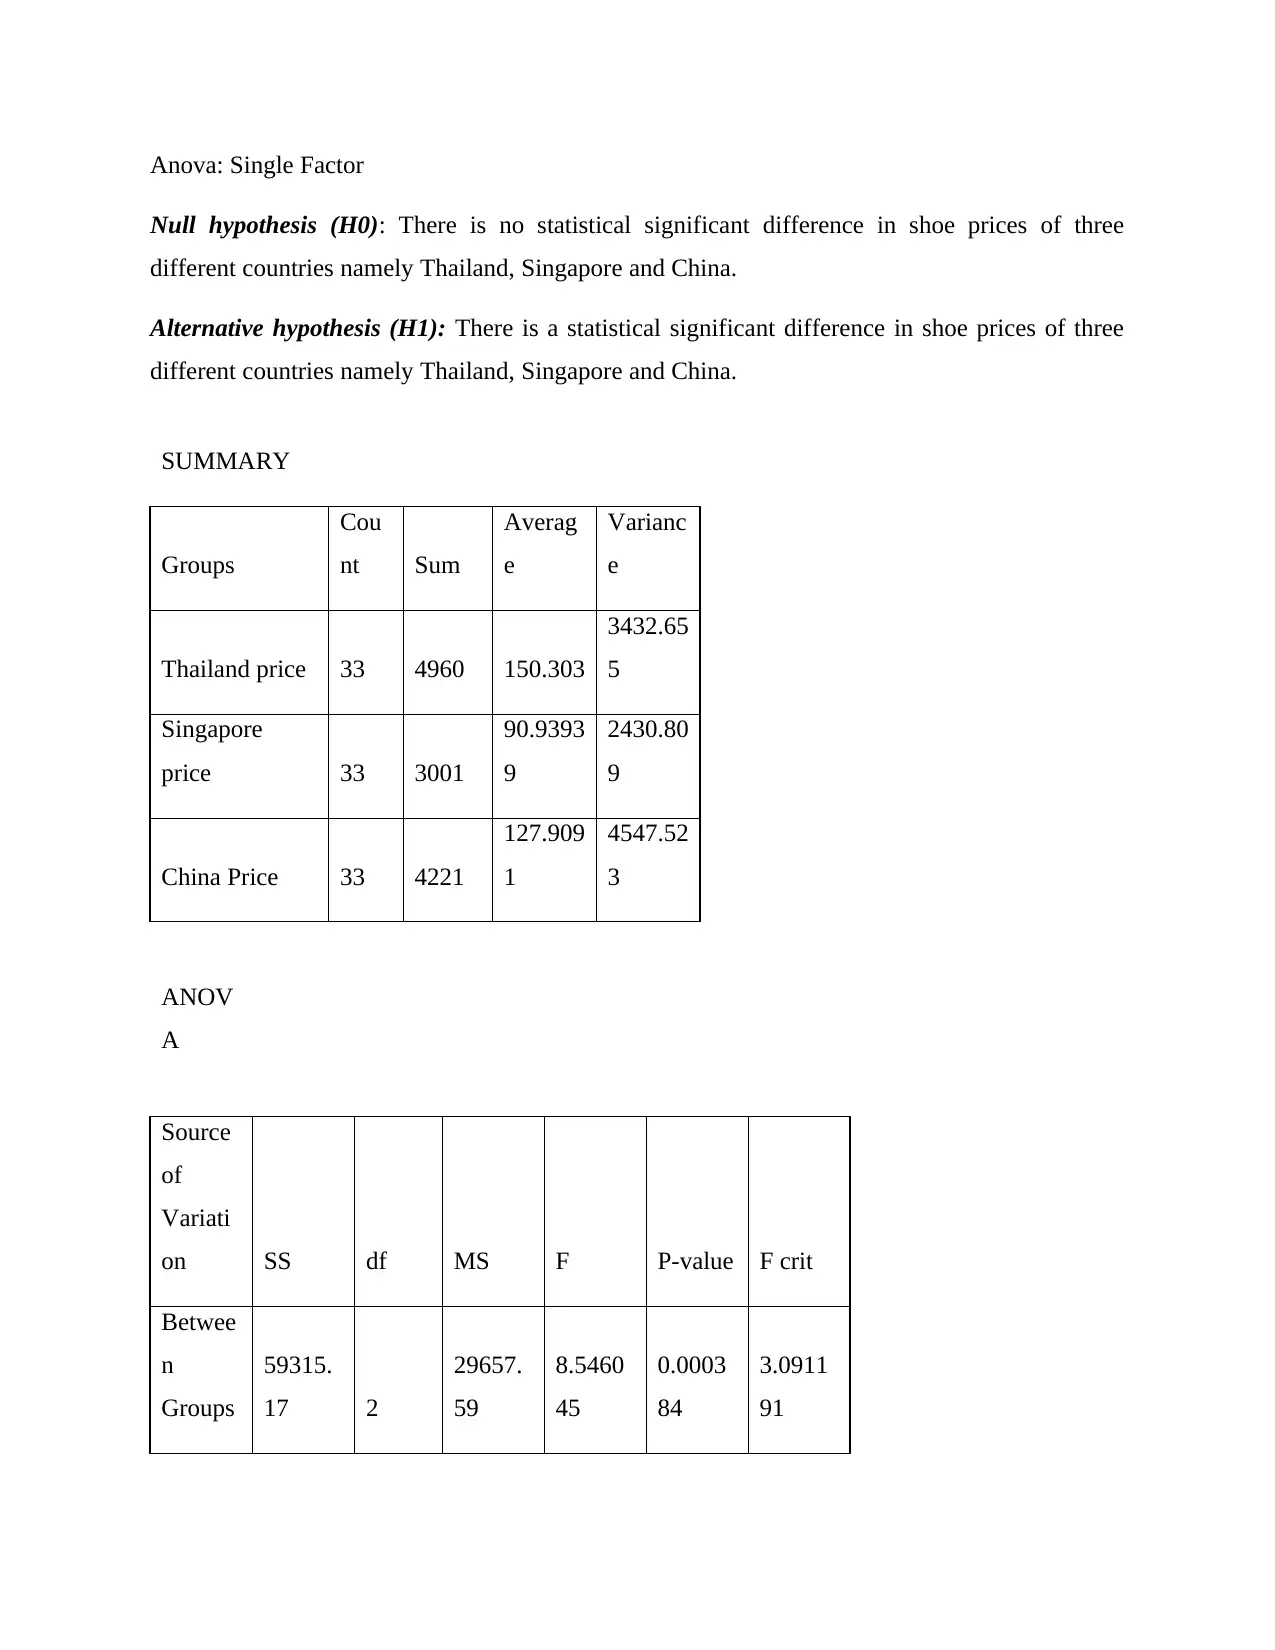
This report presents a statistical analysis conducted for an Australian manufacturing company aiming to identify opportunities in the Asian shoe market. The study utilized a sample of 99 products and employed statistical tools such as descriptive statistics, ANOVA, and regression analysis. The analysis revealed price differences in shoes across Thailand, Singapore, and China, while male and female shoe prices showed similar trends. The report includes calculations of mean, median, mode, standard deviation, and coefficient of variation for shoe prices, along with descriptive statistics for the three countries. It also tests hypotheses regarding price differences between genders and countries, employing t-tests and ANOVA. Furthermore, the report presents graphical representations of production cost and price using scatter diagrams and regression analysis to comment on the relationship between price and production cost. The conclusion suggests focusing on maintaining lower price levels to attract more customers in the Asian market.
Document Page
Statistics
tabler-icon-diamond-filled.svg

Paraphrase This Document

Need a fresh take? Get an instant paraphrase of this document with our AI Paraphraser
Document Page
Executive Summary
In the present era, business units emphasize on undertaking statistical tools and
techniques for deriving useful information from large data set. The aim behind conducting study
is to identify opportunities available in Asian shoe market. For this purpose, An Australian
manufacturing company took sample of 99 products for identifying opportunities. In order to
address such quantitative issue SPSS tools like descriptive statistics, ANOVA and regression has
been applied. It has assessed from the analysis that shoe prices prevailed in countries like
Thailand, Singapore and China are different. However, shoe prices of males and females are
moving in similar direction. Thus, it is recommended to company that focus needs to be placed
on maintaining lower price level which in turn helps in attracting more customers in Asian
market.
Document Page
TABLE OF CONTENTS
INTRODUCTION...........................................................................................................................4
Statistical problem and analysis...................................................................................................4
PART 1............................................................................................................................................4
1. Calculating mean, median, mode, standard deviation and coefficient of variation for prices
for men, women shoes.................................................................................................................4
2. Computing descriptive statistics for three selected countries (Thailand, Singapore and
China)..........................................................................................................................................7
PART 2..........................................................................................................................................10
1. Determining whether average prices for female shoes is less than from male......................10
2. Determining differences in the shoe prices of different countries.........................................11
3. Graphical presentation of production cost and price using scatter diagram..........................12
4. Using regression commenting on the relationship between price and production cost.........13
CONCLUSION..............................................................................................................................15
REFERENCES..............................................................................................................................17
Document Page
INTRODUCTION
Statistics is replicated as branch of mathematics operating through data collection,
analysis, organization, interpretation, analysis and interpretation. The present report would be
developing valid and appropriate research hypothesis and questions with application of
descriptive and inferential data analyse techniques. It will give brief analysis of Australian
manufacturing company which develops new product line of shoes. Part 1 shows descriptive
statistics and part 2 reflects ANOVA and regression analysis.
Statistical problem and analysis
In accordance with cited case situation, an Australian manufacturing company wants to
explore new products as well as shoe line. For this purpose, business unit wishes to investigate
the actual condition of Asian market. Thus, in order to meet research aim and objective shoes
price of males & females as well as three different countries have been evaluated using
ANOVA< t-test and regression.
PART 1
1. Calculating mean, median, mode, standard deviation and coefficient of variation for prices for
men, women shoes
Descriptive statistics: Female
PRICE
Mean 118.3
Standard Error 9.070439
Median 118
Mode 143
Standard
Deviation 64.13769
Sample Variance 4113.643
Kurtosis -0.76924
Skewness 0.43848
Range 231
Minimum 34
Maximum 265
tabler-icon-diamond-filled.svg

Paraphrase This Document

Need a fresh take? Get an instant paraphrase of this document with our AI Paraphraser
Document Page
Sum 5915
Count 50
Particulars
Figure
s
Quartile 1 57.5
Quartile 2 118
Quartile 3 170.5
Price
-
50
100
150
200
250
300
Female's shoes
25th
minimum
median
maximum
75th
Descriptive statistics: Male:
PRICE
Mean 127.898
Standard Error 8.955163
Median 133
Mode 183
Standard
Deviation 62.68614
Sample Variance 3929.552
Kurtosis -1.12644
Document Page
Skewness -0.0253
Range 223
Minimum 29
Maximum 252
Sum 6267
Count 49
Particular
s
Figure
s
Quartile 1 66
Quartile 2 133
Quartile 3 183
Price of male's shoes
-
50.0
100.0
150.0
200.0
250.0
300.0
Box Plot of males shoes price
25th
minimum
median
maximum
75th
Interpretation: Outcome of descriptive statistics shows that average shoe prices of male
and female implies for $118 & $127.89 respectively. Further, in the case of females, frequently
occurred shoe price is $143. On the contrary to this, in the case of males it accounts for $183
significantly. Minimum shoes price under the category of male and females are $29 & $34.
Maximum price level is high in female shoes ($265) over males ($252). Hence, referring all the
Document Page
aspects it can be entailed that average and 50% of males are ready to pay high price for shoes in
against to males. Standard deviation of female shoes is 64.13, whereas in males it accounts for
62.68.Hence, in the upcoming time period mean value of female shoes will deviate with high
price as compared to male. Box plot depicted above reflects the shape of normal distribution
(Fisz and Bartoszyński, 2018). In other words, box plot exhibits that data is more near to the
mean.
2. Computing descriptive statistics for three selected countries (Thailand, Singapore and China)
In order to assess the price level and pattern of three different countries descriptive
statistic tool has been applied. This in turn clearly represent average median and mode price
associated with shoe. Descriptive statistic is the most effectual tool which helps in assessing the
extent to which mean value will fluctuate in the upcoming time period (Adams and Lawrence,
2018). Further, it also reflects minimum and maximum price level which in turn further helps in
better decision making.
Thailand
PRICE
Particulars Figures
Mean 150.303
Standard Error 10.19901
Median 143
Mode 143
Standard
Deviation 58.58887
Sample Variance 3432.655
Kurtosis 0.27851
Skewness -0.34832
Range 236
Minimum 29
Maximum 265
Particulars Figures
Quartile 1 124
Quartile 2 143
tabler-icon-diamond-filled.svg

Paraphrase This Document

Need a fresh take? Get an instant paraphrase of this document with our AI Paraphraser
Document Page
Quartile 3 186
-100 -50 0 50 100 150 200 250 300 350 400
Singapore
PRICE
Particulars Figures
Mean 90.93939
Standard Error 8.582591
Median 69
Mode 69
Standard
Deviation 49.30323
Sample Variance 2430.809
Kurtosis -0.45021
Skewness 0.971825
Range 152
Minimum 36
Maximum 188
Particul
ars
Figur
es
Quartile
1 55
Quartile
2 69
Quartile
3 117
China
Document Page
PRICE
Particulars Figures
Mean 127.9091
Standard Error 11.73898
Median 138
Mode 66
Standard
Deviation 67.43532
Sample Variance 4547.523
Kurtosis -1.2311
Skewness 0.048033
Range 218
Minimum 34
Maximum 252
Particul
ars
Figur
es
Quartile
1 66
Quartile
2 138
Quartile
3 183
Singapore China
18.6
18.65
18.7
18.75
18.8
18.85
18.9
18.95
Lower Quartile Minimum
Median Maximum
Upper Quartile
Document Page
Interpretation: Tabular presentation shows that mean and median shoe price in Thailand
is $150 & $143 respectively. In this country, minimum and maximum shoe price is $29 & $265
significantly. In the upcoming time period shoe price in Thailand will either increase or decrease
by $58. On the other side, in Singapore and China average shoe price is 90.93 & 127.90. In
Singapore, median and mode price is $69 respectively. Whereas, in China, median and mode
price level is $138 and $66. Thus, while entering in Asian market and at the time of setting prices
An Australian manufacturing company should keep in mind all such aspects.
Shapes of box plot mentioned above comes under the following categories:
Thailand Positive skewness
Singapore Normal distribution
China Negative skewness
PART 2
1. Determining whether average prices for female shoes is less than from male
In order to test below mentioned hypothesis t test has been selected and applied. This in
turn helps in assessing the extent to which mean value of selected two sample vary from each
other (Gronau, Ly and Wagenmakers, 2019).
Criteria of hypothesis selection:
P>0.05: Null accepted
P<0.05: alternative accepted
T-test
Null hypothesis (H0): There is no statistical significant difference in the average shoe prices of
male and females.
Alternative hypothesis (H1): There is a statistical significant difference in the average shoe
prices of male and females.
t-Test: Two-Sample Assuming Equal Variances
tabler-icon-diamond-filled.svg

Paraphrase This Document

Need a fresh take? Get an instant paraphrase of this document with our AI Paraphraser
Document Page
Female
shoe
PRICE
Male
shoe
price
Mean 118.3 127.898
Variance 4113.643 3929.552
Observations 50 49
Pooled Variance 4022.546
Hypothesized Mean
Difference 0
df 97
t Stat -0.75282
P(T<=t) one-tail 0.226689
t Critical one-tail 1.660715
P(T<=t) two-tail 0.453378
t Critical two-tail 1.984723
The above depicted table shows that p value derived through statistical evaluation is
greater than the standard one such as 0.05. In other words, p>0.05so it can be presented that null
hypothesis is accepted. On the basis of this, statistically no significant difference takes place in
the mean value of price associated with the shoes of males & females. Part 1 (1) mentioned
above presents that average male and female shoe price is similar such as 118 and 127
respectively. Along with this, median shoe prices of male and female’s shoes are similar.
Considering this, it can be depicted that findings of this section is highly aligned with part 1
2. Determining differences in the shoe prices of different countries
In order to evaluate shoe prices of three different countries ANOVA tool has been
applied. This tool assist in determining significant difference in the average figure of selected
variables (Nyaga, Aerts and Arbyn, 2018).
Document Page
Anova: Single Factor
Null hypothesis (H0): There is no statistical significant difference in shoe prices of three
different countries namely Thailand, Singapore and China.
Alternative hypothesis (H1): There is a statistical significant difference in shoe prices of three
different countries namely Thailand, Singapore and China.
SUMMARY
Groups
Cou
nt Sum
Averag
e
Varianc
e
Thailand price 33 4960 150.303
3432.65
5
Singapore
price 33 3001
90.9393
9
2430.80
9
China Price 33 4221
127.909
1
4547.52
3
ANOV
A
Source
of
Variati
on SS df MS F P-value F crit
Betwee
n
Groups
59315.
17 2
29657.
59
8.5460
45
0.0003
84
3.0911
91
chevron_up_icon
1 out of 17
circle_padding
hide_on_mobile
zoom_out_icon
[object Object]