Statistical Analysis of Online Shopping Customer Behavior Report

Verified

Added on  2023/01/23

|9
|1733
|92
Report
AI Summary
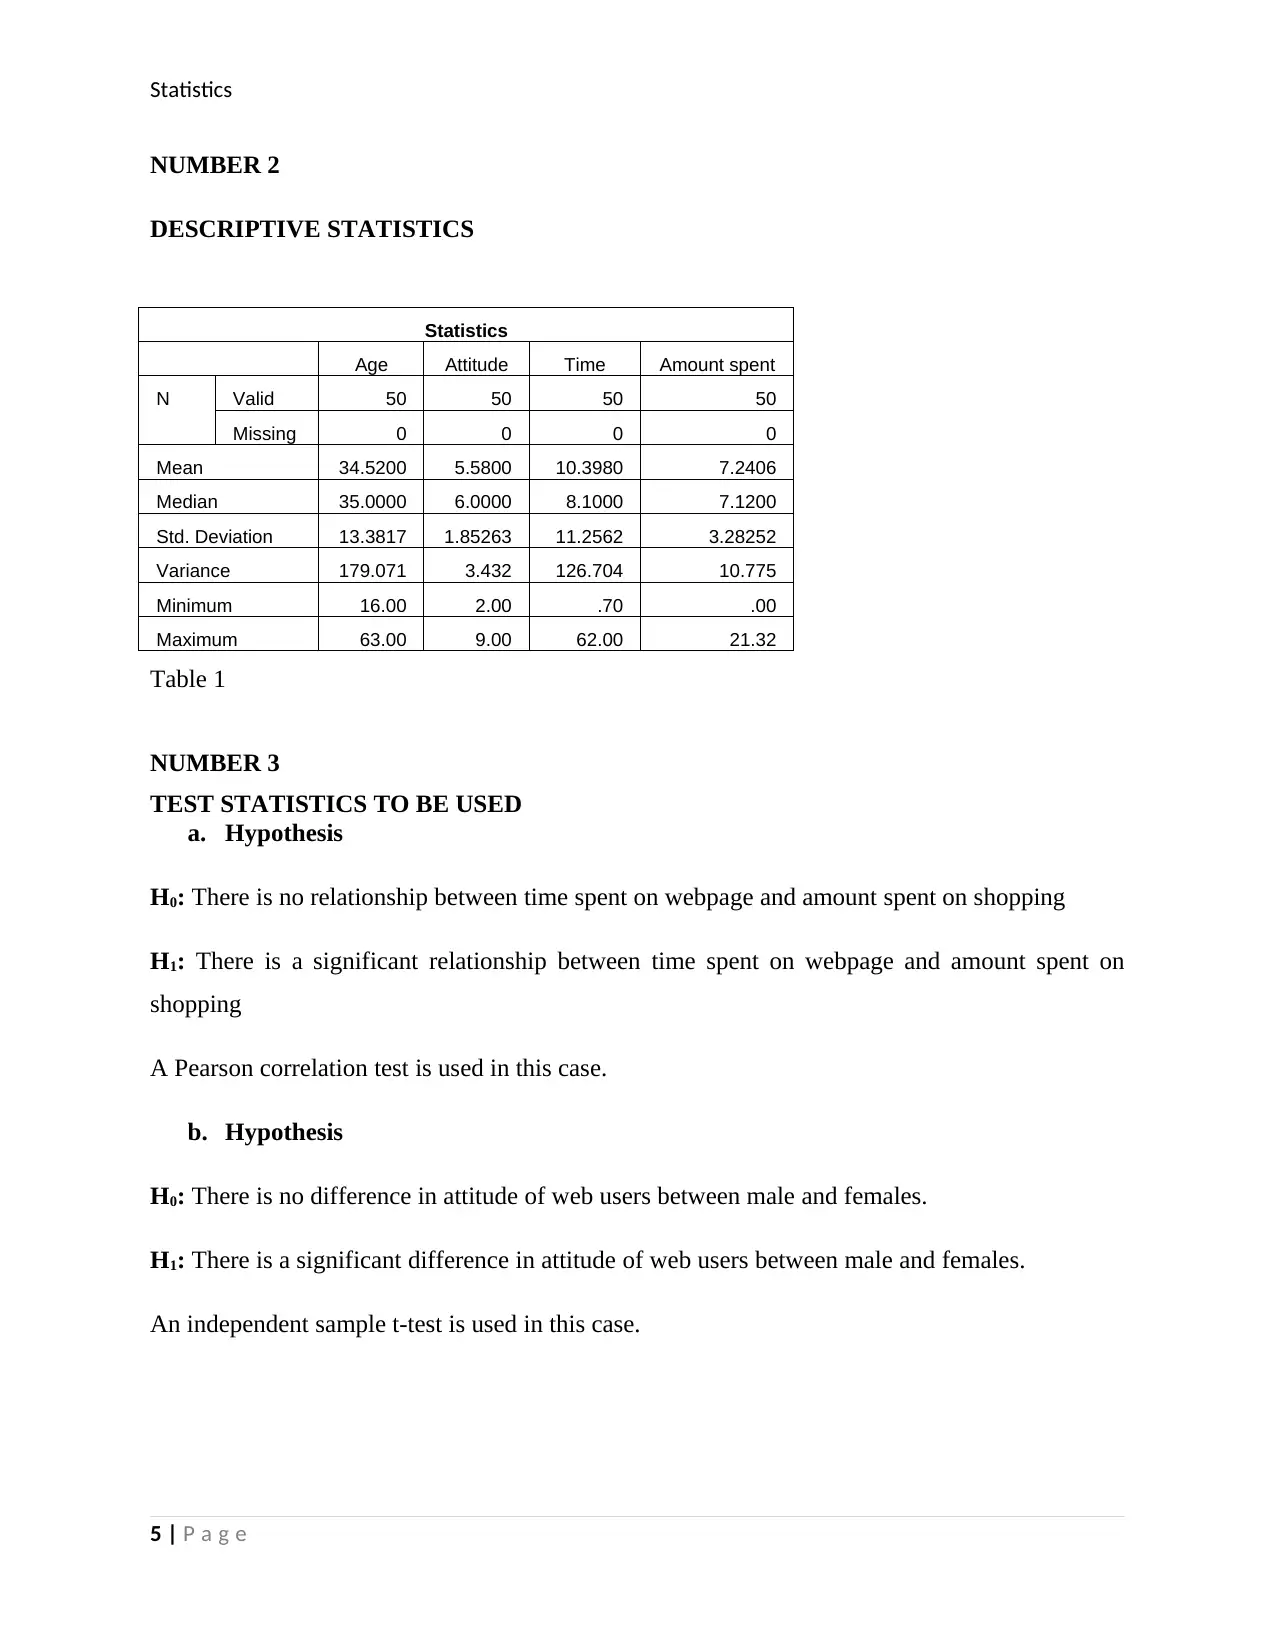
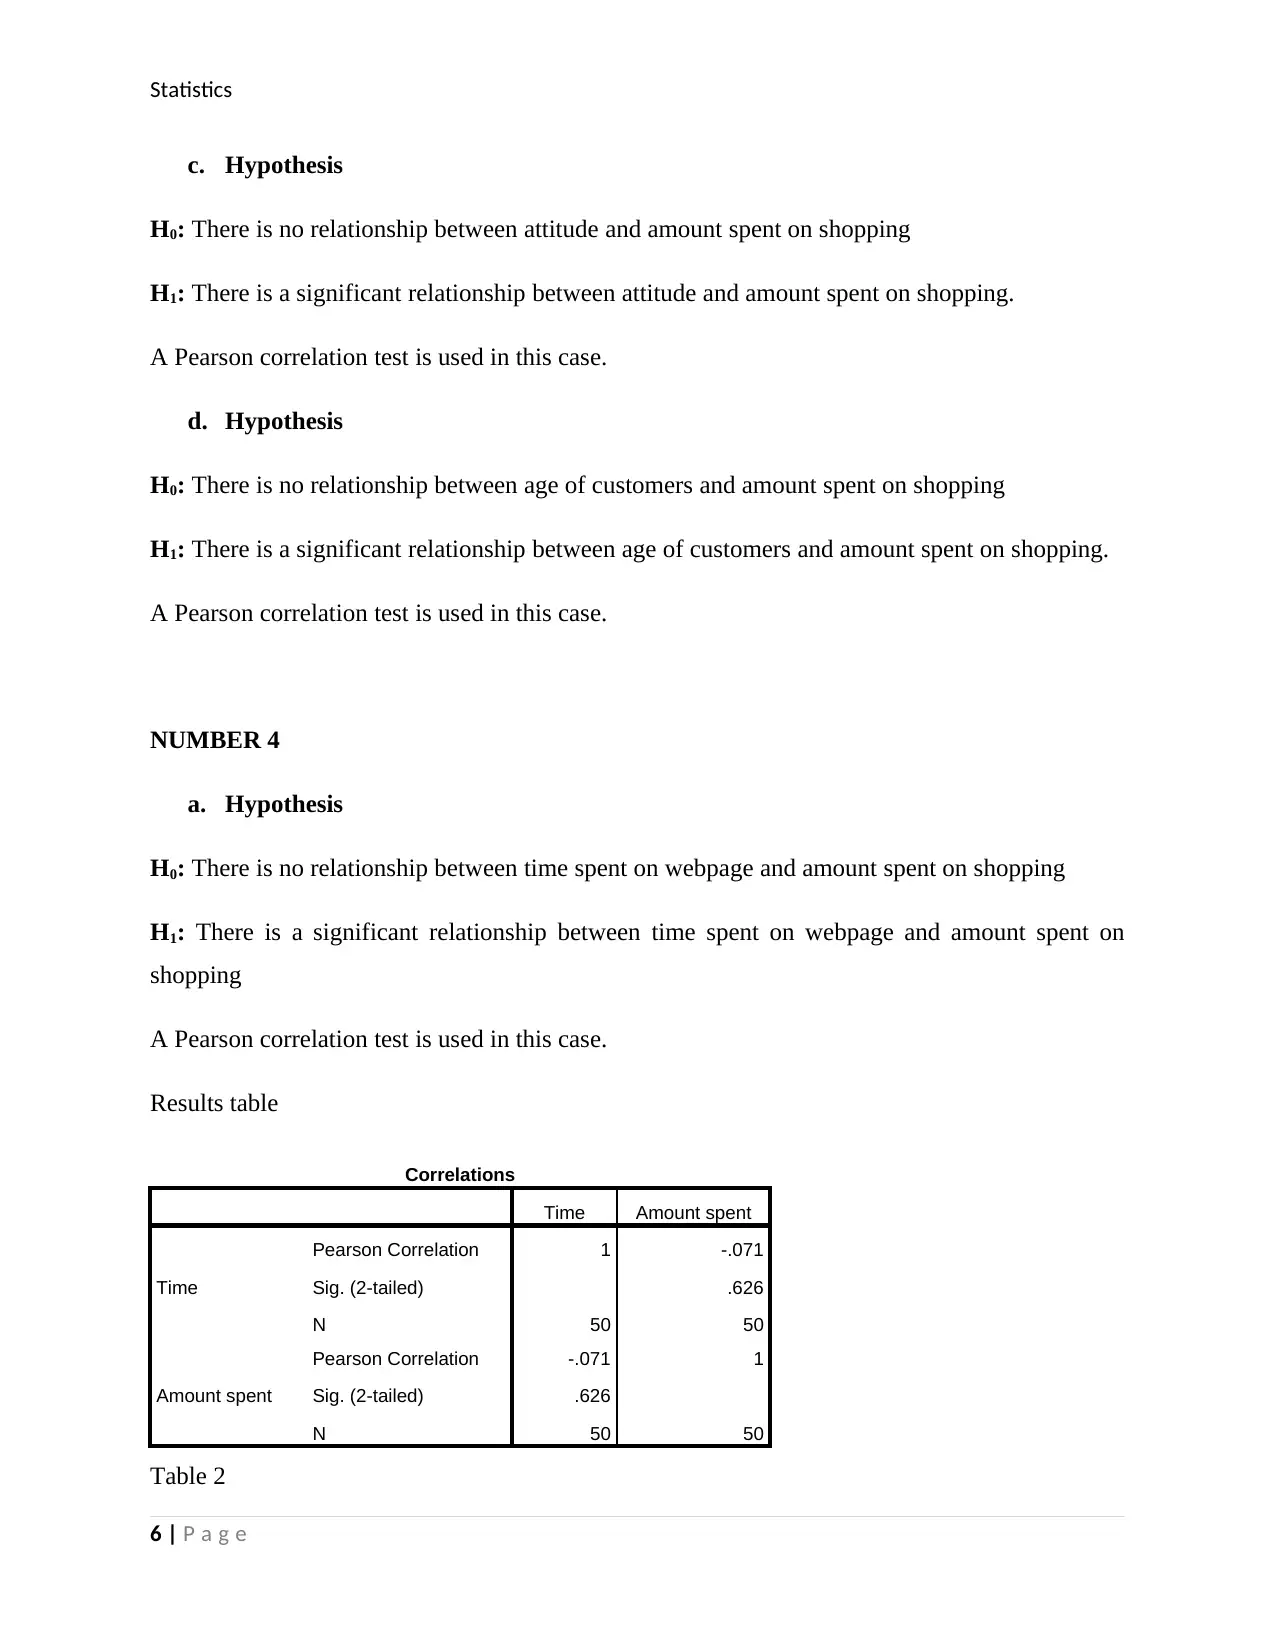
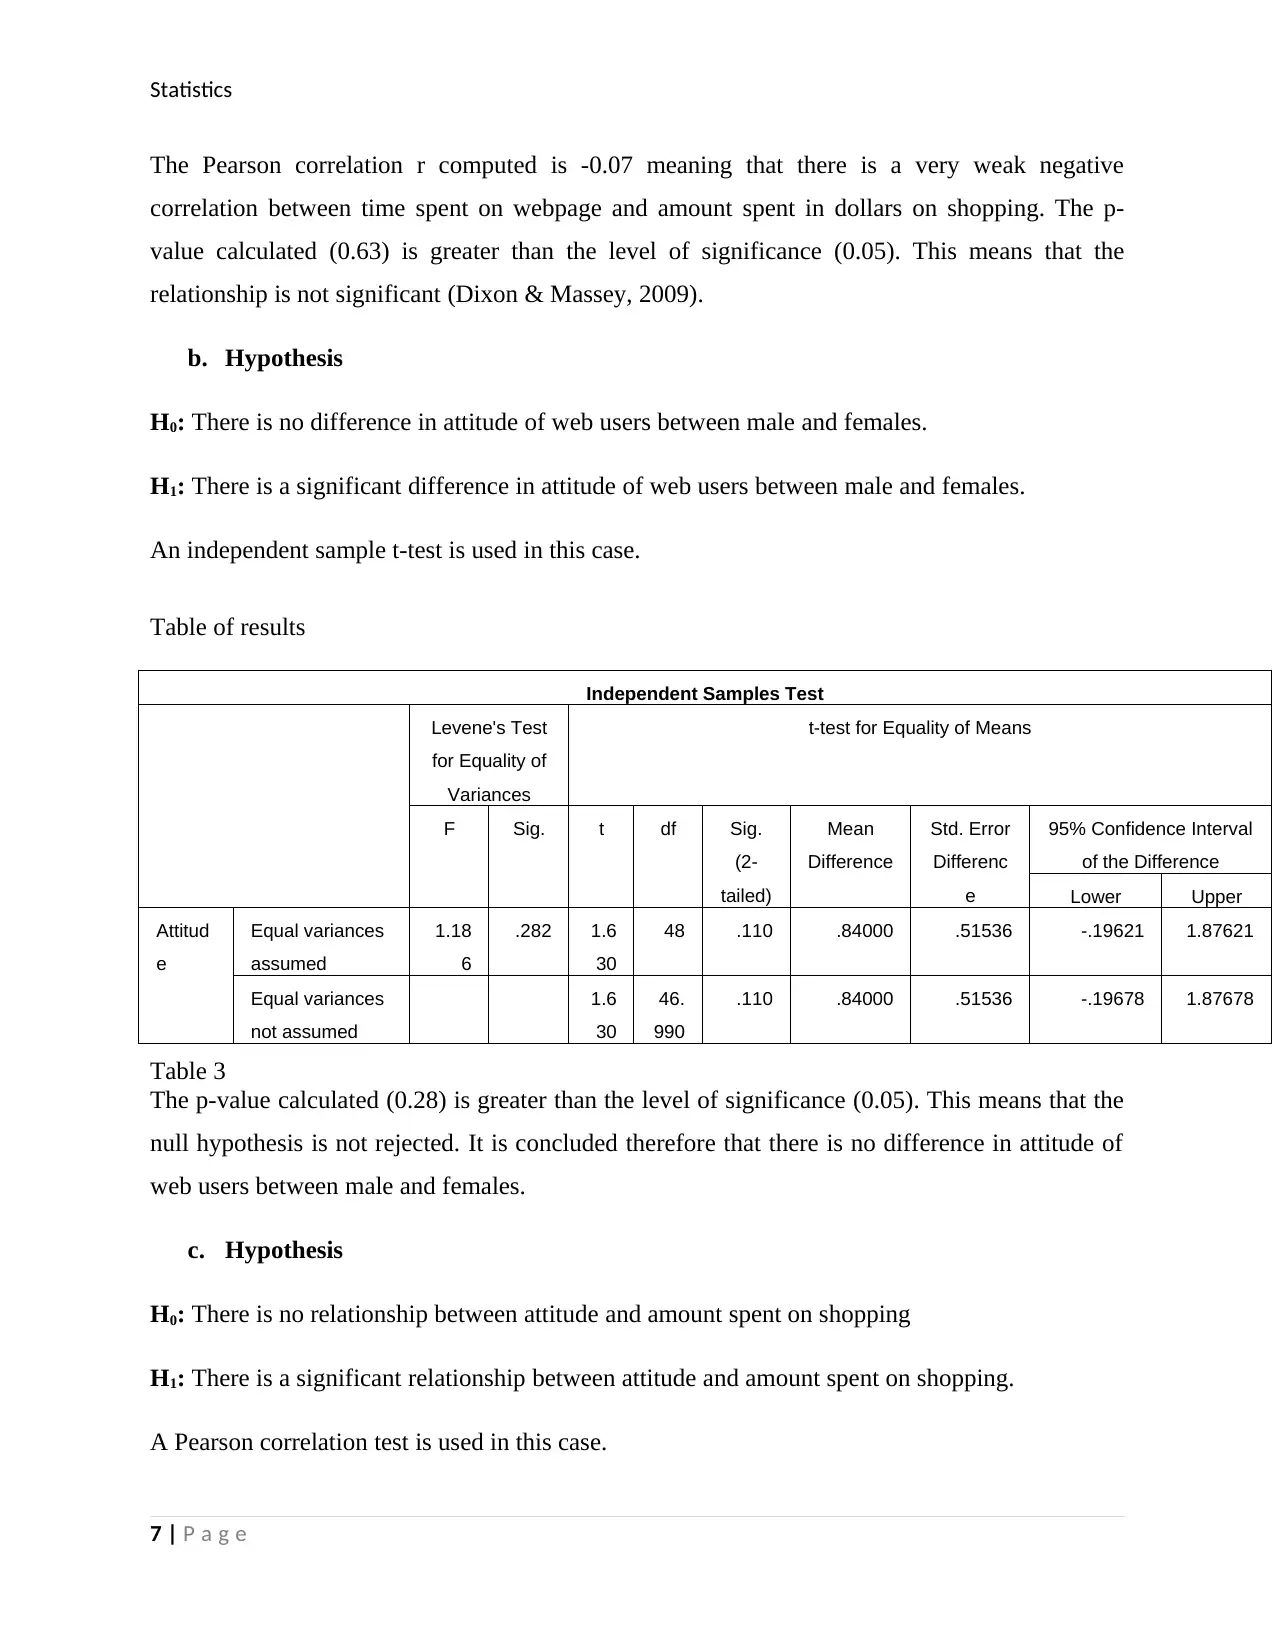
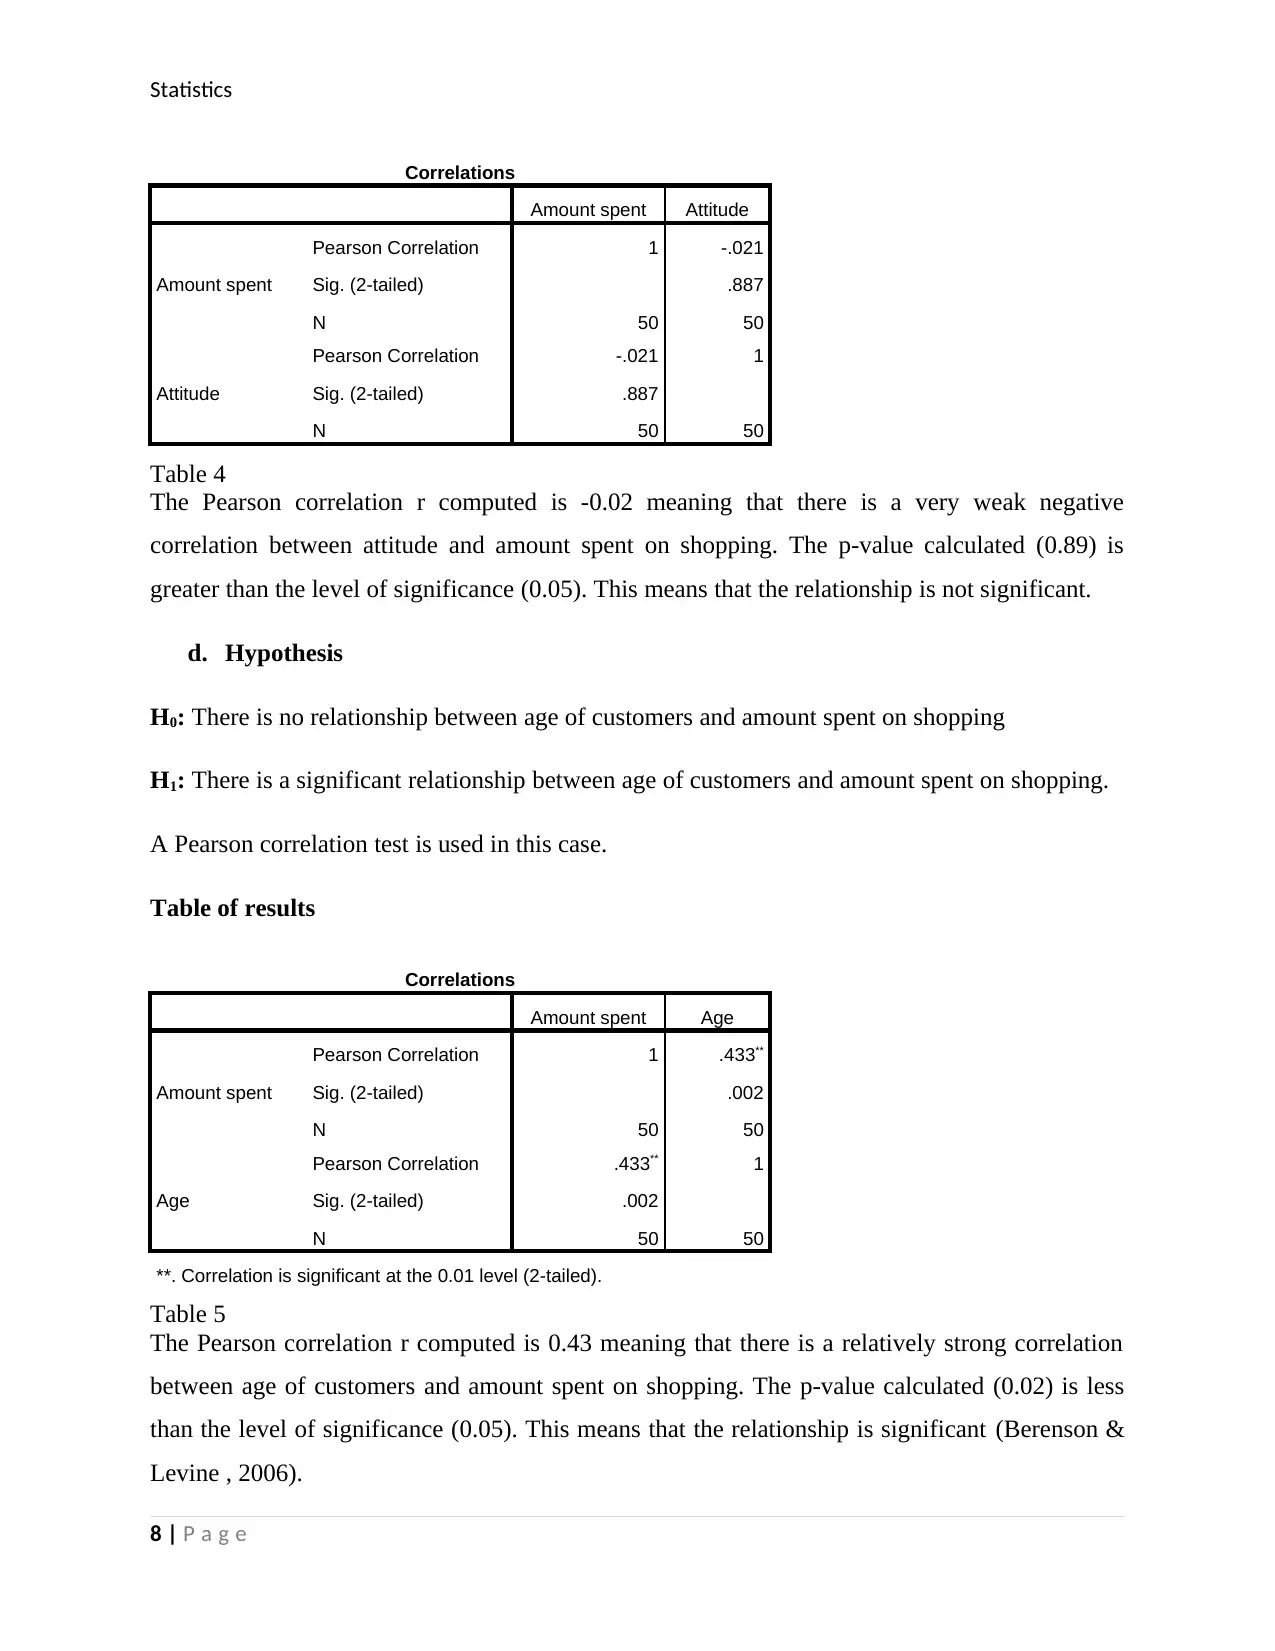
This report presents a statistical analysis of online shopping customer behavior, focusing on the relationships between time spent on a webpage, the amount spent, age, and attitude of the customers. The study employed simple random sampling to select a sample of 50 respondents and utilized SPSS software for data analysis. Descriptive statistics like mean, median, standard deviation, and variance were used, along with inferential statistics such as Pearson correlation and independent sample t-tests. The findings revealed no significant relationship between time spent on the webpage and the amount spent, nor between attitude and spending. However, a significant positive correlation was found between age and the amount spent. Furthermore, the study concluded that there was no significant difference in attitude between male and female web users. The report includes tables presenting the statistical results and references to relevant literature.
Document Page
Statistics
Online shopping
Student name:
Tutor name:
1 | P a g e
tabler-icon-diamond-filled.svg

Paraphrase This Document

Need a fresh take? Get an instant paraphrase of this document with our AI Paraphraser
Document Page
Statistics
Abstract
The main objective of this pilot study was to find out how customers were using online shopping
webpage. The specific objectives were to find out whether there was a direct relationship
between time spent on the webpage and the amount spent in dollars to do shopping. The study
also sought to find out whether age was correlated to the amount spent shopping. In selecting of
the sample to the sample, the study employed simple random sampling to select the sample. This
was arrived at as it eliminates cases of bias and also gives members of the population equal
chance of being selected into the sample. The study employed the software SPSS for the purpose
of data analysis. Descriptive statistics such as mean, median, standard deviation and variance
were used to describe the data. Inferential statistics such as Pearson correlation was used to
establish relationship between variables. The research findings were presented in tables. It was
found that there was no relationship between time spent on webpage and amount spent in dollars
on shopping. No significant relationship was also found between attitude and amount spent on
shopping. However, there was a significant relationship between age and amount of money spent
shopping. Lastly, it was also found out that there was no significant difference in attitude
between the males and the females.
2 | P a g e
Document Page
Statistics
Introduction
The main objective of this pilot study was to find out how customers were using online shopping
webpage. The specific objectives were to find out whether there was a direct relationship
between time spent on the webpage and the amount spent in dollars to do shopping. The study
also sought to find out whether age was correlated to the amount spent shopping.
Sampling
In order to come up with a sample that was not biased, the study employed two sampling
methods. The first method was purposive sampling then the second method was equal
probability sampling or simple random sampling. Purposive sampling was used to select a pool
of respondents who have always visited the webpage for online shopping. This was done to
ensure that the people who had not visited the webpage get into the sample. This was also to
avoid cases of invalidity of the data. After a pool of respondents had been selected, the study
employed a simple random sampling to select a sample of 50 respondents. This method was
adopted as it allowed every member in the pool to have an equal chance of being selected in the
sample (Hicks, 2013). It also eliminated biasness that might have arisen due to human error. It
was also easier on the study side since it took less time and resources to conduct the process
(Fleiss & Paik, 2003). This came in handy as there was also the constraint of time.
Methodology
The study employed the software SPSS for the purpose of data analysis. Descriptive statistics
such as measures of center (mean, median and mode) and measures of dispersion such as
standard deviation and variance were used to describe the data. Inferential statistics such as
Pearson correlation and independent sample t-test were used to establish relationship between
variables (Bhattacharyya & Johnson , 2013). The research findings were presented in tables.
3 | P a g e
Document Page
Statistics
NUMBER 1
HYPOTHESES
a. Hypothesis
H0: There is no relationship between time spent on webpage and amount spent on shopping
H1: There is a significant relationship between time spent on webpage and amount spent on
shopping
b. Hypothesis
H0: There is no difference in attitude of web users between male and females.
H1: There is a significant difference in attitude of web users between male and females.
This is a two tailed test.
c. Hypothesis
H0: There is no relationship between attitude and amount spent on shopping
H1: There is a significant relationship between attitude and amount spent on shopping.
d. Hypothesis
H0: There is no relationship between age of customers and amount spent on shopping
H1: There is a significant relationship between age of customers and amount spent on shopping.
4 | P a g e
tabler-icon-diamond-filled.svg

Paraphrase This Document

Need a fresh take? Get an instant paraphrase of this document with our AI Paraphraser
Document Page
Statistics
NUMBER 2
DESCRIPTIVE STATISTICS
Statistics
Age Attitude Time Amount spent
N Valid 50 50 50 50
Missing 0 0 0 0
Mean 34.5200 5.5800 10.3980 7.2406
Median 35.0000 6.0000 8.1000 7.1200
Std. Deviation 13.3817 1.85263 11.2562 3.28252
Variance 179.071 3.432 126.704 10.775
Minimum 16.00 2.00 .70 .00
Maximum 63.00 9.00 62.00 21.32
Table 1
NUMBER 3
TEST STATISTICS TO BE USED
a. Hypothesis
H0: There is no relationship between time spent on webpage and amount spent on shopping
H1: There is a significant relationship between time spent on webpage and amount spent on
shopping
A Pearson correlation test is used in this case.
b. Hypothesis
H0: There is no difference in attitude of web users between male and females.
H1: There is a significant difference in attitude of web users between male and females.
An independent sample t-test is used in this case.
5 | P a g e
Document Page
Statistics
c. Hypothesis
H0: There is no relationship between attitude and amount spent on shopping
H1: There is a significant relationship between attitude and amount spent on shopping.
A Pearson correlation test is used in this case.
d. Hypothesis
H0: There is no relationship between age of customers and amount spent on shopping
H1: There is a significant relationship between age of customers and amount spent on shopping.
A Pearson correlation test is used in this case.
NUMBER 4
a. Hypothesis
H0: There is no relationship between time spent on webpage and amount spent on shopping
H1: There is a significant relationship between time spent on webpage and amount spent on
shopping
A Pearson correlation test is used in this case.
Results table
Correlations
Time Amount spent
Time
Pearson Correlation 1 -.071
Sig. (2-tailed) .626
N 50 50
Amount spent
Pearson Correlation -.071 1
Sig. (2-tailed) .626
N 50 50
Table 2
6 | P a g e
Document Page
Statistics
The Pearson correlation r computed is -0.07 meaning that there is a very weak negative
correlation between time spent on webpage and amount spent in dollars on shopping. The p-
value calculated (0.63) is greater than the level of significance (0.05). This means that the
relationship is not significant (Dixon & Massey, 2009).
b. Hypothesis
H0: There is no difference in attitude of web users between male and females.
H1: There is a significant difference in attitude of web users between male and females.
An independent sample t-test is used in this case.
Table of results
Independent Samples Test
Levene's Test
for Equality of
Variances
t-test for Equality of Means
F Sig. t df Sig.
(2-
tailed)
Mean
Difference
Std. Error
Differenc
e
95% Confidence Interval
of the Difference
Lower Upper
Attitud
e
Equal variances
assumed
1.18
6
.282 1.6
30
48 .110 .84000 .51536 -.19621 1.87621
Equal variances
not assumed
1.6
30
46.
990
.110 .84000 .51536 -.19678 1.87678
Table 3
The p-value calculated (0.28) is greater than the level of significance (0.05). This means that the
null hypothesis is not rejected. It is concluded therefore that there is no difference in attitude of
web users between male and females.
c. Hypothesis
H0: There is no relationship between attitude and amount spent on shopping
H1: There is a significant relationship between attitude and amount spent on shopping.
A Pearson correlation test is used in this case.
7 | P a g e
tabler-icon-diamond-filled.svg

Paraphrase This Document

Need a fresh take? Get an instant paraphrase of this document with our AI Paraphraser
Document Page
Statistics
Correlations
Amount spent Attitude
Amount spent
Pearson Correlation 1 -.021
Sig. (2-tailed) .887
N 50 50
Attitude
Pearson Correlation -.021 1
Sig. (2-tailed) .887
N 50 50
Table 4
The Pearson correlation r computed is -0.02 meaning that there is a very weak negative
correlation between attitude and amount spent on shopping. The p-value calculated (0.89) is
greater than the level of significance (0.05). This means that the relationship is not significant.
d. Hypothesis
H0: There is no relationship between age of customers and amount spent on shopping
H1: There is a significant relationship between age of customers and amount spent on shopping.
A Pearson correlation test is used in this case.
Table of results
Correlations
Amount spent Age
Amount spent
Pearson Correlation 1 .433**
Sig. (2-tailed) .002
N 50 50
Age
Pearson Correlation .433** 1
Sig. (2-tailed) .002
N 50 50
**. Correlation is significant at the 0.01 level (2-tailed).
Table 5
The Pearson correlation r computed is 0.43 meaning that there is a relatively strong correlation
between age of customers and amount spent on shopping. The p-value calculated (0.02) is less
than the level of significance (0.05). This means that the relationship is significant (Berenson &
Levine , 2006).
8 | P a g e
Document Page
Statistics
References
Statistics for Management and Economics, Duxbury Press, Belmont, CA. (n.d.).
Berenson, M. L., & Levine , D. M. (2006). Basic Business Statistics. New Jersey: Prentice-Hall,
Englewood Cliffs.
Bhattacharyya, G. K., & Johnson , R. A. (2013). Statistical Concepts and Methods. New York:
John Wiley and Sons.
Dixon , W. J., & Massey, F. J. (2009). Introduction to Statistical Analysis. New York: McGraw-
Hill.
Fleiss, J. L., & Paik, M. C. (2003). Statistical Methods for Rates and Proportions, Third Edition,.
New York: John Wiley & Sons.
Hicks, C. R. (2013). Fundamental Concepts in the Design of Experiments. New-York: Rhinehart
and Winston.
9 | P a g e
chevron_up_icon
1 out of 9
circle_padding
hide_on_mobile
zoom_out_icon
[object Object]