Statistical Analysis of Experimental Design using SPSS V25

Verified

Added on Ā 2020/12/30

|53
|8056
|92
Homework Assignment
AI Summary
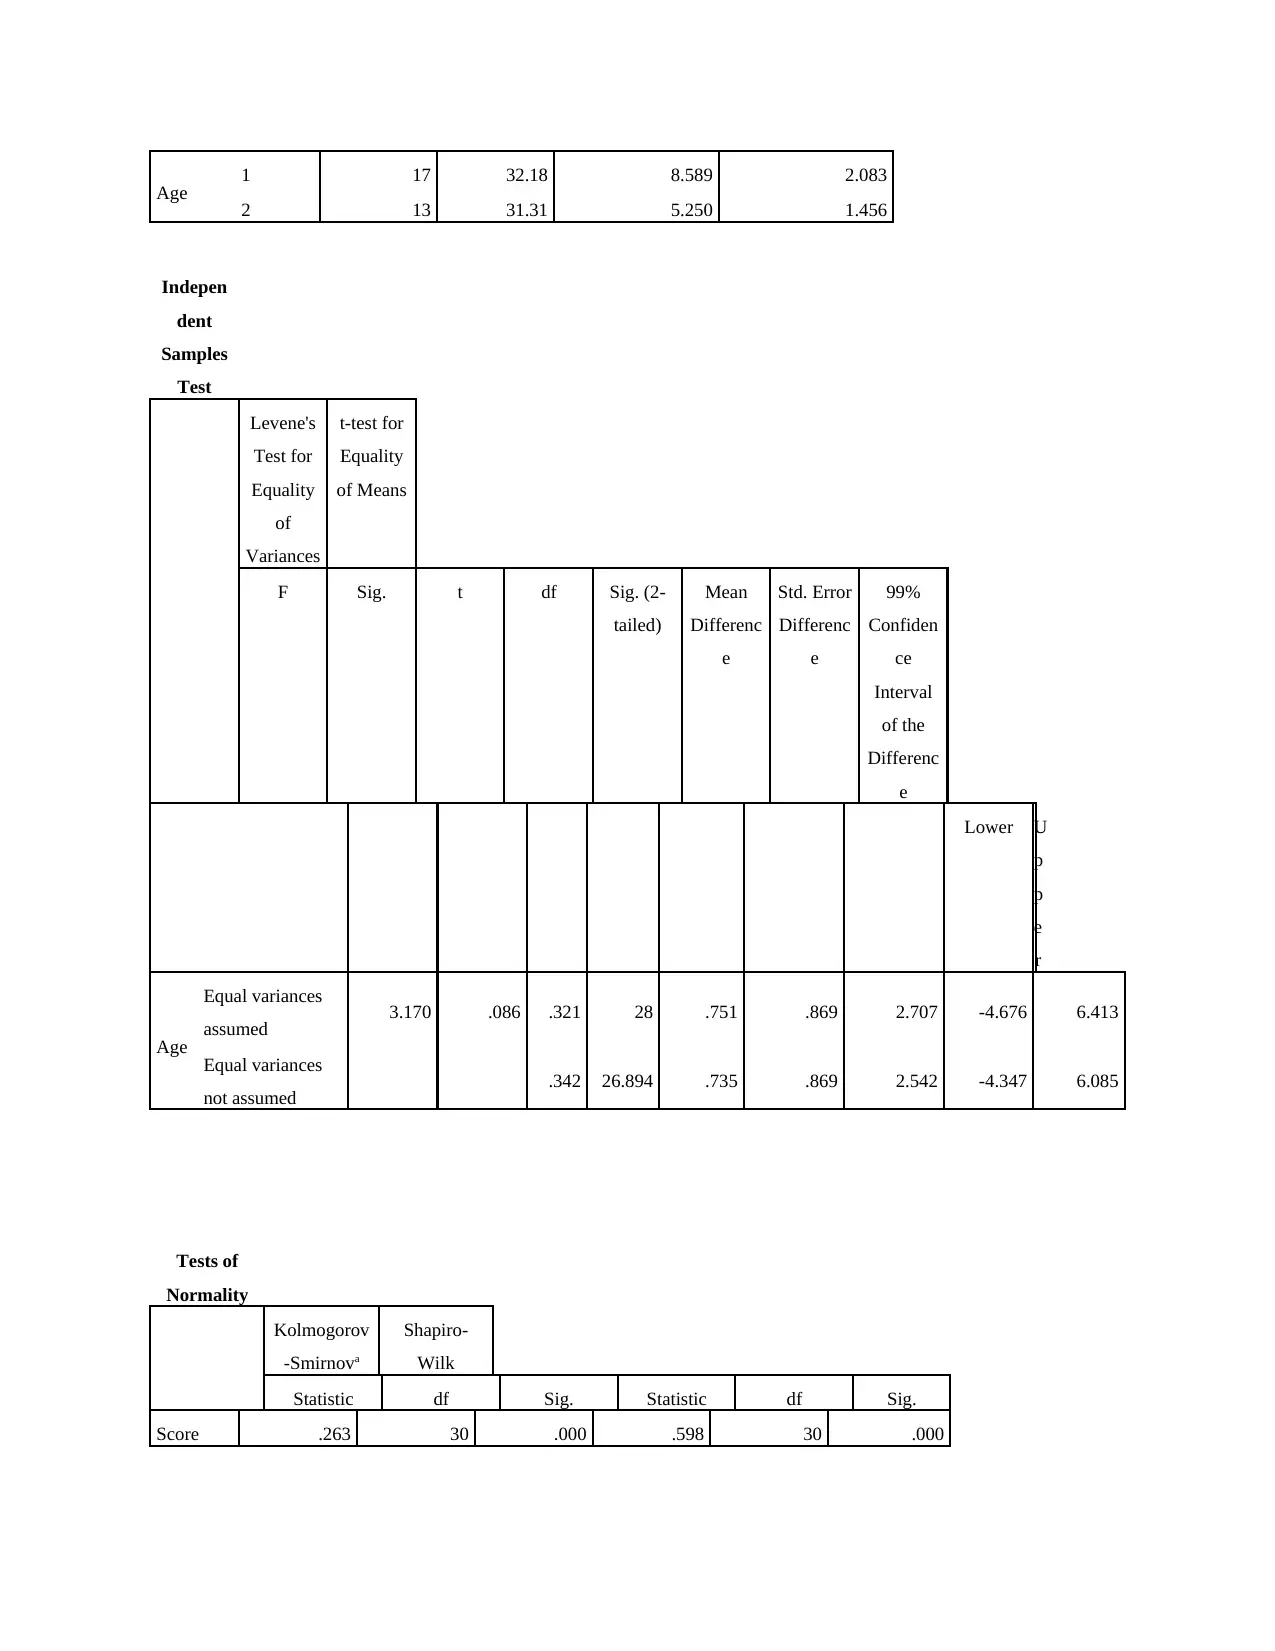
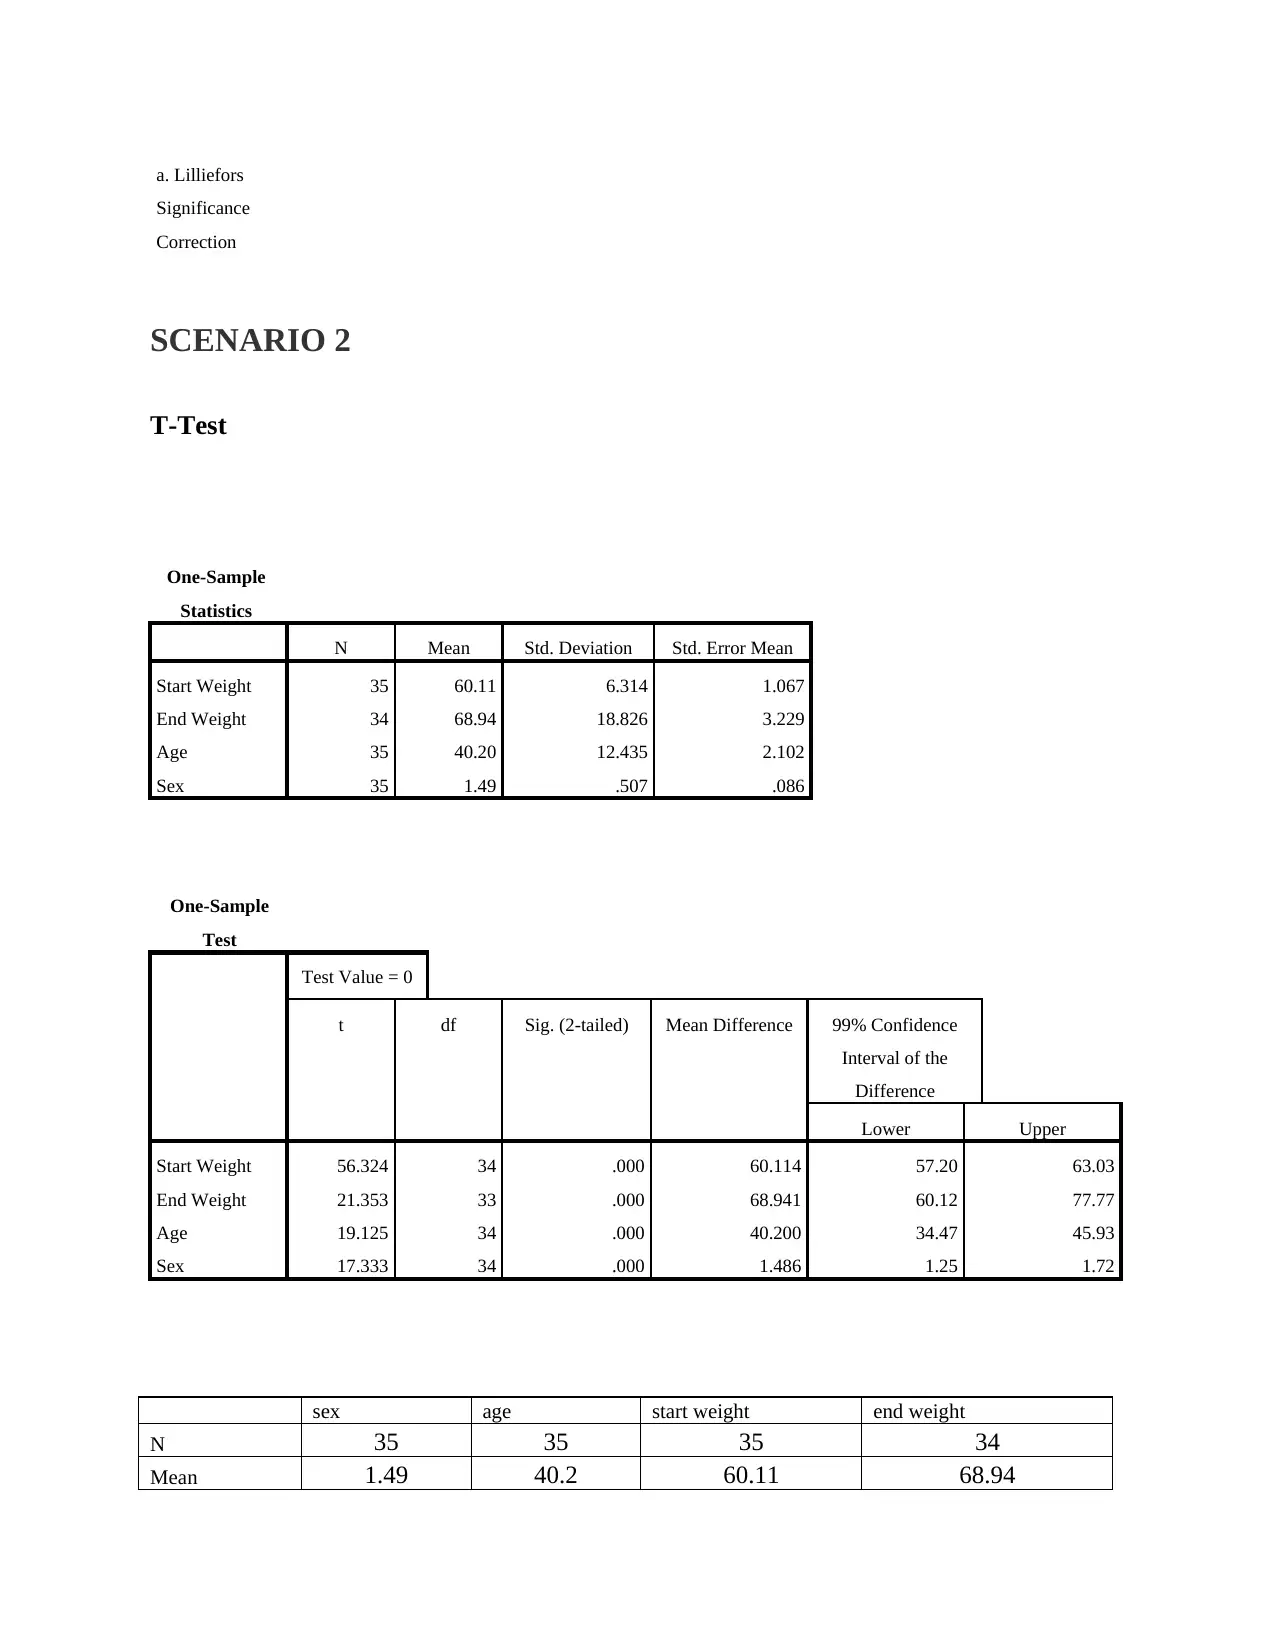
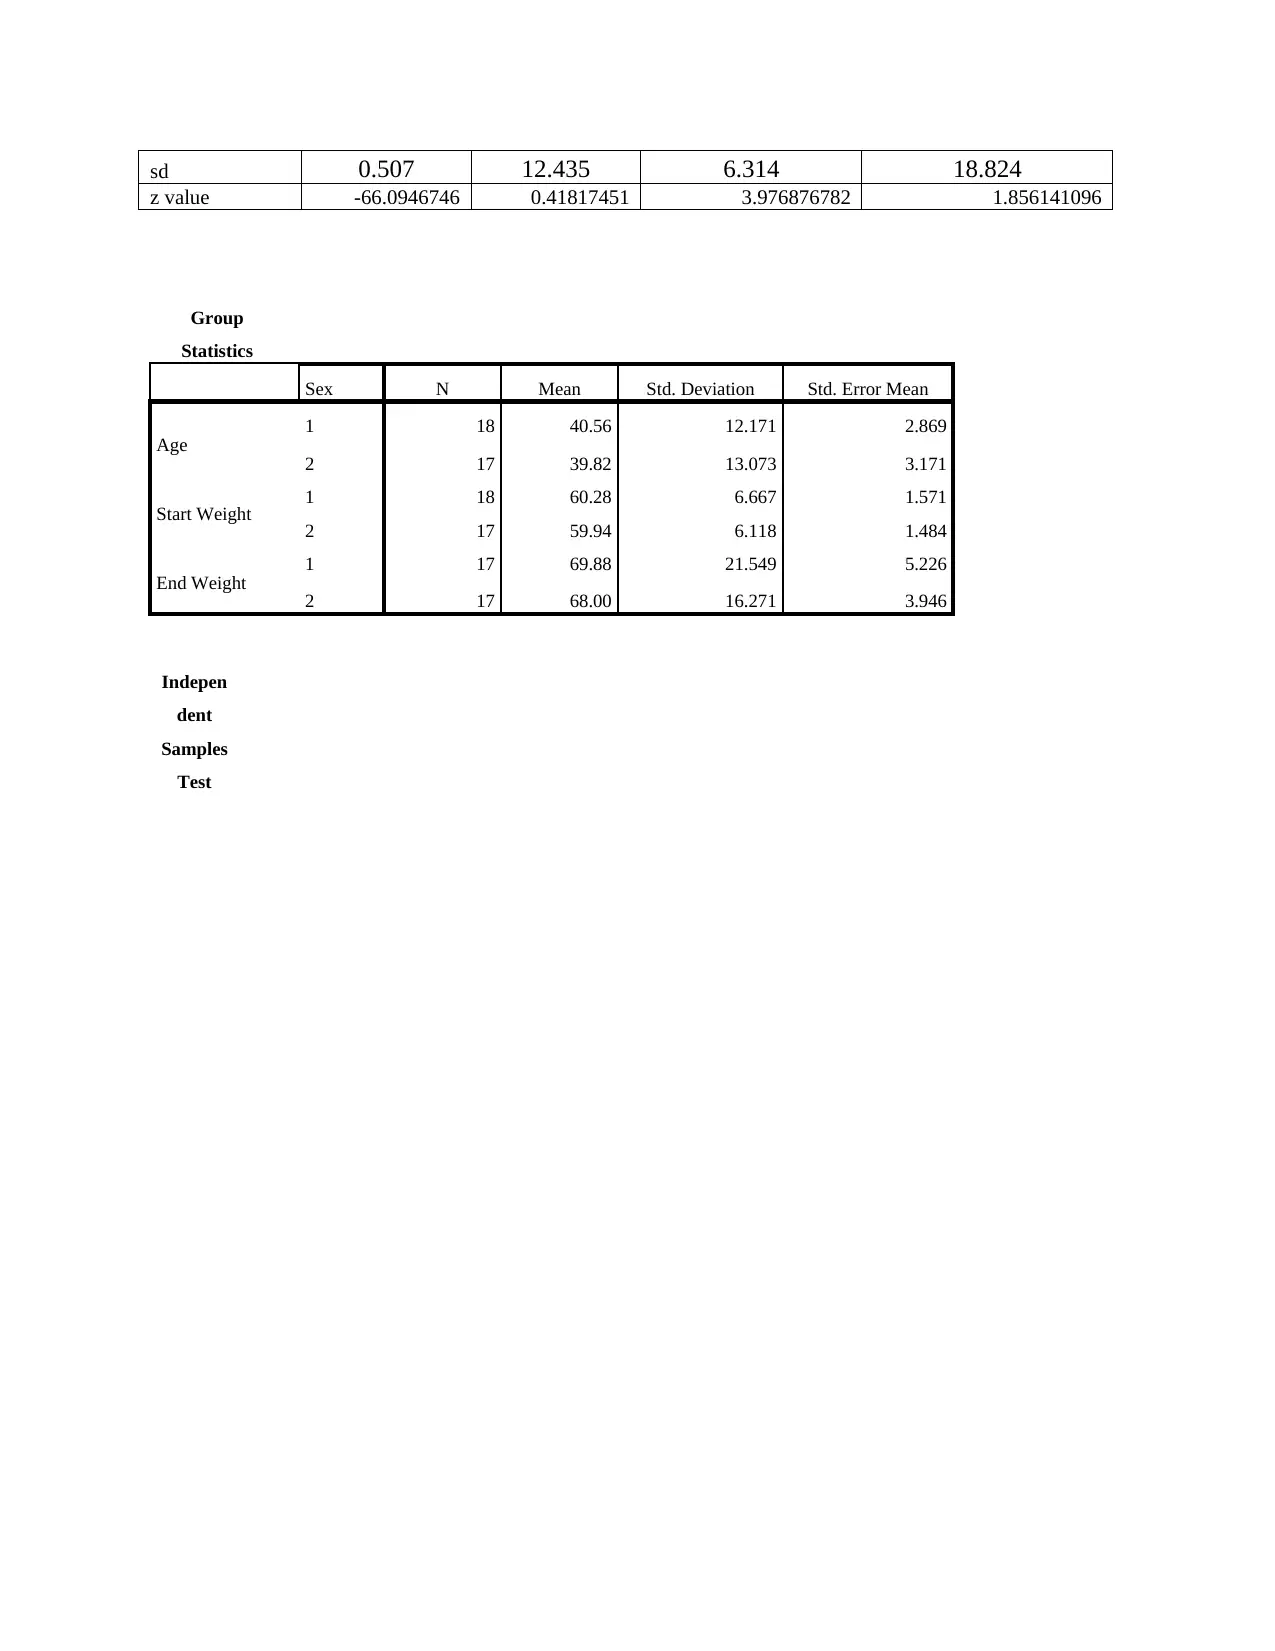
This homework assignment presents a comprehensive analysis of experimental data using SPSS V25. The student's work encompasses six scenarios, each involving various statistical tests such as t-tests (one-sample and independent samples), ANOVA, and regression analysis. The assignment includes calculations of means, standard deviations, significance levels, p-values, and effect sizes. The student also addresses outlier identification and management, and discusses the experimenter effect. The analysis covers topics such as the impact of weight gain programs, condition outputs, and other experimental variables. The assignment thoroughly documents the statistical outputs, interpretations, and conclusions derived from the SPSS analysis, providing a detailed understanding of the data and its implications.
Document Page
experimental design and
analysis and using SPSS V25
tabler-icon-diamond-filled.svg

Paraphrase This Document

Need a fresh take? Get an instant paraphrase of this document with our AI Paraphraser
Document Page
Table of Contents
SCENARIO 1...................................................................................................................................3
Task 1 ..............................................................................................................................................3
Task 2 ..............................................................................................................................................3
TASK 3............................................................................................................................................3
SCENARIO 2...................................................................................................................................5
Task 1 ..............................................................................................................................................8
Task 2 ..............................................................................................................................................9
TASK 3............................................................................................................................................9
SCENARIO 3 ..................................................................................................................................9
Task 1 ..............................................................................................................................................9
Task 2 ............................................................................................................................................10
TASK 3..........................................................................................................................................10
SCENARIO 3 PART 2..................................................................................................................12
SCENARIO 4.................................................................................................................................16
Task 1 ............................................................................................................................................16
Task 2 ............................................................................................................................................16
TASK 3..........................................................................................................................................16
SCENARIO 5 ................................................................................................................................21
Task 1 ............................................................................................................................................21
Task 2 ............................................................................................................................................22
TASK 3..........................................................................................................................................22
SCENARIO 6.................................................................................................................................25
Task 1 ............................................................................................................................................25
Task 2 ............................................................................................................................................26
TASK 3..........................................................................................................................................26
REFERENCES..............................................................................................................................29
REFERENCES..............................................................................................................................36
Document Page
SCENARIO 1
Task 1
1. On the basis of the t- test it is identified that the significance level is 0.000 which is 0.001
that shows the hypothesis is null hypothesis as there is no significant difference between
the two variables (Mandavgade and Deshmukh, 2019).
2. The statistical analysis which is being used in Sample T- test, Independent sample T-
test , test of normality, homogeneity of variance through ANOVA.
3. Mean age of male and female participants is
Male - 31.33
Female – 32.18
4. No outlier
5. No applicable
6. on the basis of the test of normality it is identified that the significance level is 0.00
which means there is significant difference between the variables and thus it is alternative
hypothesis and the distribution is normally met (Owan, Arop and Agunwa, 2019).
7. The degree of freedom were 30
8. The value of T was 0
9. P value was 0.000 which means there is significant difference between the varaibles.
10. Not applicable
11. Not applicable
Task 2
1. The mean happiness rating was higher than the population mean .
TASK 3
Experimenter effect
sex age
N 30 30
Document Page
Mean 1.43 31.8
sd 0.504 7.232
z value -56.6865079 0.24889381
T-Test
One-Sample
Statistics
N Mean Std. Deviation Std. Error Mean
Score 30 40.87 8.157 1.489
Sex 30 1.43 .504 .092
Age 30 31.80 7.232 1.320
One-Sample
Test
Test Value = 0
t df Sig. (2-tailed) Mean Difference 99% Confidence
Interval of the
Difference
Lower Upper
Score 27.442 29 .000 40.867 36.76 44.97
Sex 15.577 29 .000 1.433 1.18 1.69
Age 24.084 29 .000 31.800 28.16 35.44
T-Test
Group
Statistics
Sex N Mean Std. Deviation Std. Error Mean
tabler-icon-diamond-filled.svg

Paraphrase This Document

Need a fresh take? Get an instant paraphrase of this document with our AI Paraphraser
Document Page
Age 1 17 32.18 8.589 2.083
2 13 31.31 5.250 1.456
Indepen
dent
Samples
Test
Levene's
Test for
Equality
of
Variances
t-test for
Equality
of Means
F Sig. t df Sig. (2-
tailed)
Mean
Differenc
e
Std. Error
Differenc
e
99%
Confiden
ce
Interval
of the
Differenc
e
Lower U
p
p
e
r
Age
Equal variances
assumed 3.170 .086 .321 28 .751 .869 2.707 -4.676 6.413
Equal variances
not assumed .342 26.894 .735 .869 2.542 -4.347 6.085
Tests of
Normality
Kolmogorov
-Smirnova
Shapiro-
Wilk
Statistic df Sig. Statistic df Sig.
Score .263 30 .000 .598 30 .000
Document Page
a. Lilliefors
Significance
Correction
SCENARIO 2
T-Test
One-Sample
Statistics
N Mean Std. Deviation Std. Error Mean
Start Weight 35 60.11 6.314 1.067
End Weight 34 68.94 18.826 3.229
Age 35 40.20 12.435 2.102
Sex 35 1.49 .507 .086
One-Sample
Test
Test Value = 0
t df Sig. (2-tailed) Mean Difference 99% Confidence
Interval of the
Difference
Lower Upper
Start Weight 56.324 34 .000 60.114 57.20 63.03
End Weight 21.353 33 .000 68.941 60.12 77.77
Age 19.125 34 .000 40.200 34.47 45.93
Sex 17.333 34 .000 1.486 1.25 1.72
sex age start weight end weight
N 35 35 35 34
Mean 1.49 40.2 60.11 68.94
Document Page
sd 0.507 12.435 6.314 18.824
z value -66.0946746 0.41817451 3.976876782 1.856141096
Group
Statistics
Sex N Mean Std. Deviation Std. Error Mean
Age 1 18 40.56 12.171 2.869
2 17 39.82 13.073 3.171
Start Weight 1 18 60.28 6.667 1.571
2 17 59.94 6.118 1.484
End Weight
1 17 69.88 21.549 5.226
2 17 68.00 16.271 3.946
Indepen
dent
Samples
Test
tabler-icon-diamond-filled.svg

Paraphrase This Document

Need a fresh take? Get an instant paraphrase of this document with our AI Paraphraser
Document Page
Levene's Test for
Equality of
Variances
t
-
t
e
s
t
f
o
r
E
q
u
a
l
i
t
y
o
f
M
e
a
n
s
Document Page
F Sig. t df Sig. (2-
tailed)
Mean
Difference
Std. Error
Difference
9
5
%
C
o
n
f
i
d
e
n
c
e
I
n
t
e
r
v
a
l
o
f
t
h
e
D
i
f
f
e
r
e
n
c
e
Document Page
Lower U
p
p
e
r
Age
Equal variances
assumed .021 .886 .172 33 .865 .732 4.267 -7.949 9.413
Equal variances
not assumed .171 32.451 .865 .732 4.276 -7.973 9.437
Start
Weight
Equal variances
assumed .143 .708 .155 33 .877 .337 2.167 -4.072 4.745
Equal variances
not assumed .156 32.976 .877 .337 2.161 -4.061 4.734
End
Weight
Equal variances
assumed .367 .549 .287 32 .776 1.882 6.549 -11.457 15.222
Equal variances
not assumed .287 29.769 .776 1.882 6.549 -11.497 15.261
Regression
Variables
Entered/Remo
veda
Model Variables Entered Variables Removed Method
1 Sex, Age, Start
Weightb . Enter
a. Dependent
Variable: End
Weight
b. All requested
variables
entered.
Model
Summary
Model R R Square Adjusted R Square Std. Error of the
Estimate
tabler-icon-diamond-filled.svg

Paraphrase This Document

Need a fresh take? Get an instant paraphrase of this document with our AI Paraphraser
Document Page
1 .345a .119 .031 18.531
a. Predictors:
(Constant), Sex,
Age, Start
Weight
ANOVAa
Model Sum of Squares df Mean Square F Sig.
1
Regression 1394.327 3 464.776 1.354 .276b
Residual 10301.555 30 343.385
Total 11695.882 33
a. Dependent
Variable: End
Weight
b. Predictors:
(Constant), Sex,
Age, Start
Weight
Coefficientsa
Model Unstandardized Coefficients Standardized
Coefficients
t S
i
g
.
B Std. Error Beta
1
(Constant) .930 37.004 .025 .980
Start Weight 1.008 .519 .343 1.941 .062
Age .246 .270 .161 .912 .369
Sex -1.570 6.358 -.042 -.247 .807
a. Dependent
Variable: End
Weight
Tests of
Normalitya,b,
d,e,f,g,h,i,j,k,l,m,n,o
Document Page
Start Weight Kolmogorov-Smirnovc S
h
a
p
i
r
o
-
W
i
l
k
Statistic df Sig. Statistic df Sig.
End Weight
51 .260 2 .
55 .260 2 .
59 .260 2 .
61 .260 2 .
62 .302 4 . .870 4 .296
63 .204 3 . .993 3 .843
65 .260 2 .
68 .260 2 .
Task 1
1.On the basis of the t- test it is identified that the significance level is 0.000 which is 0.001
that shows the hypothesis is null hypothesis as there is no significant difference between the
two variables (King and et.al., 2018).
2.The statistical analysis which is being used in Sample T- test, Independent sample T- test ,
test of normality, homogeneity of variance through ANOVA.
3.standard deviation of age of male and female participants is
Male – 12.171
Female – 13.073
4 there were 5 outliers
5. they were changed to
ļ‚· 9 is changed to 55
chevron_up_icon
1 out of 53
circle_padding
hide_on_mobile
zoom_out_icon
[object Object]