Statistical Analysis of Stock Returns, Risk, and CAPM for Finance
VerifiedAdded on 2020/05/11
|13
|1681
|62
Homework Assignment
AI Summary
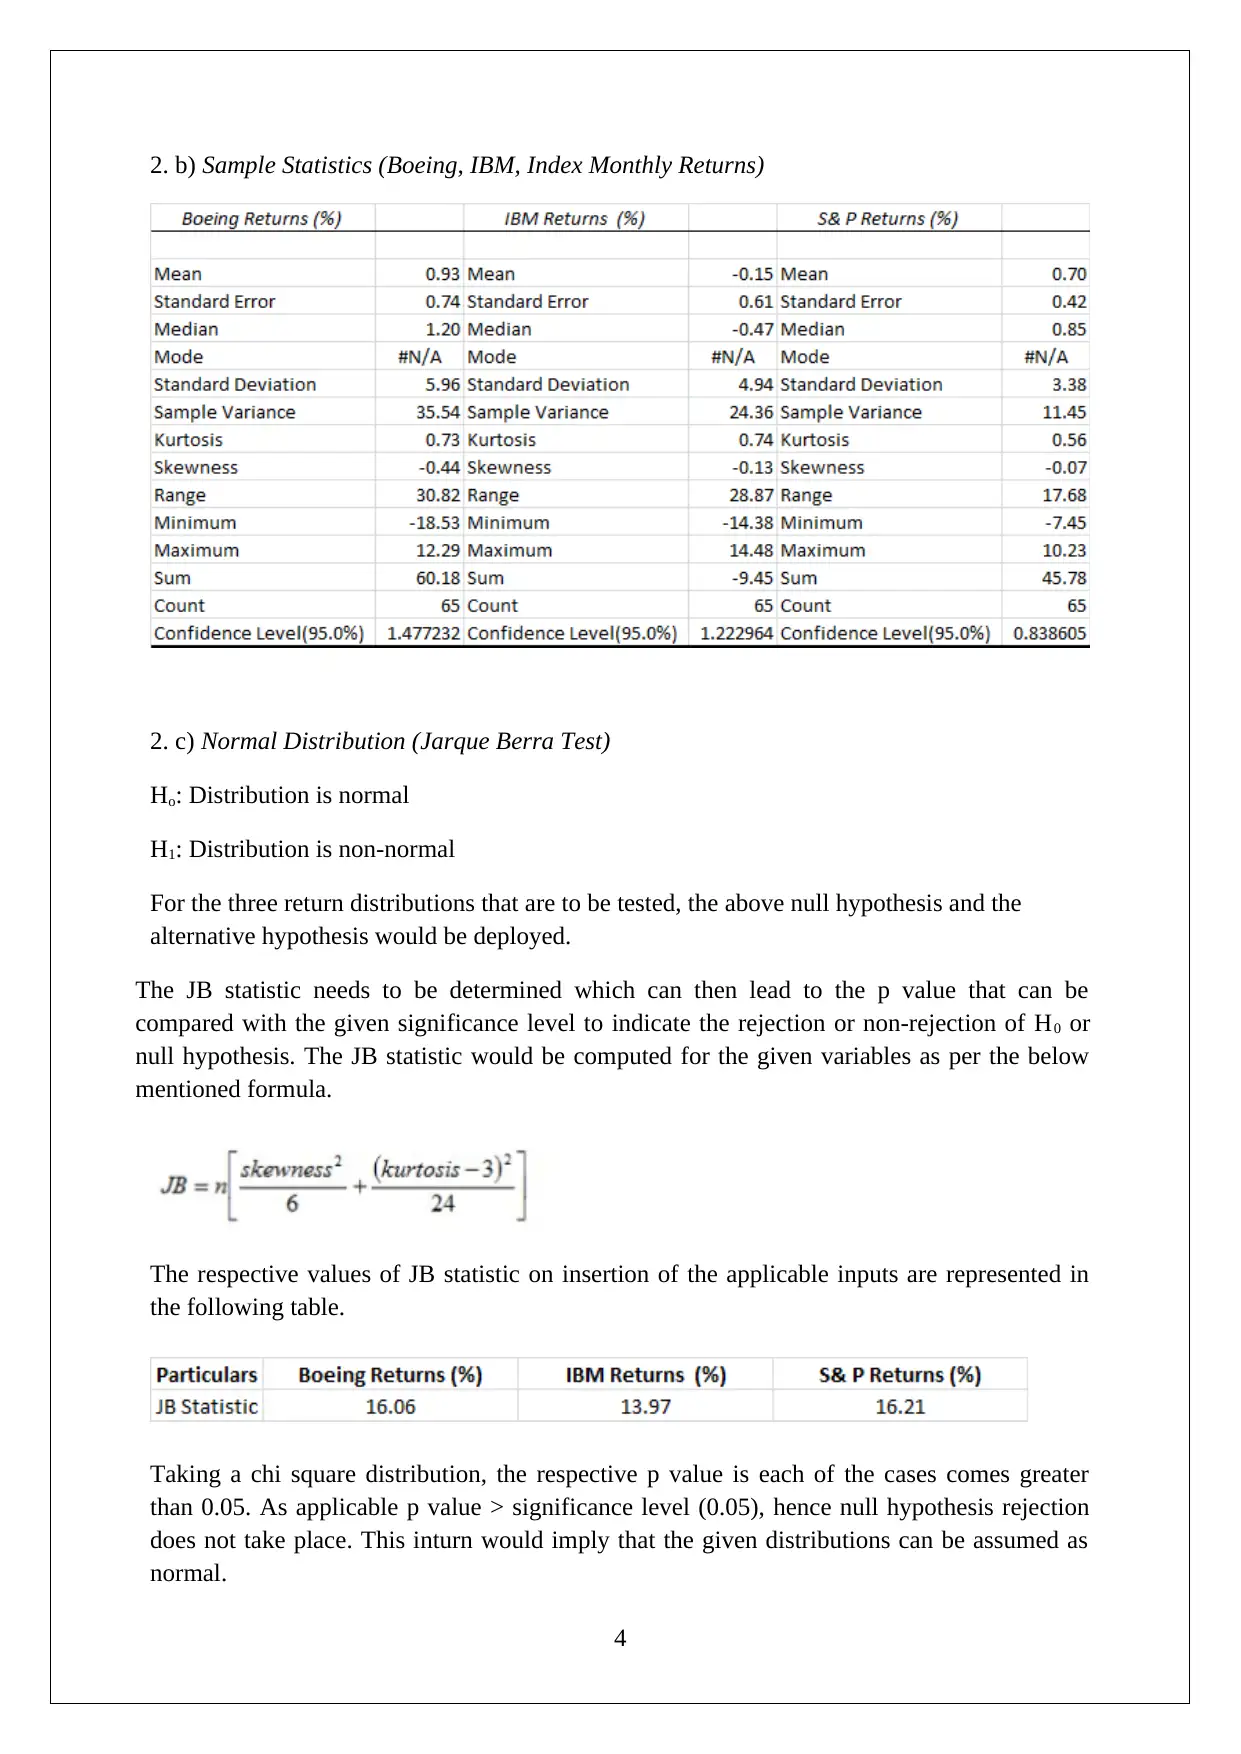
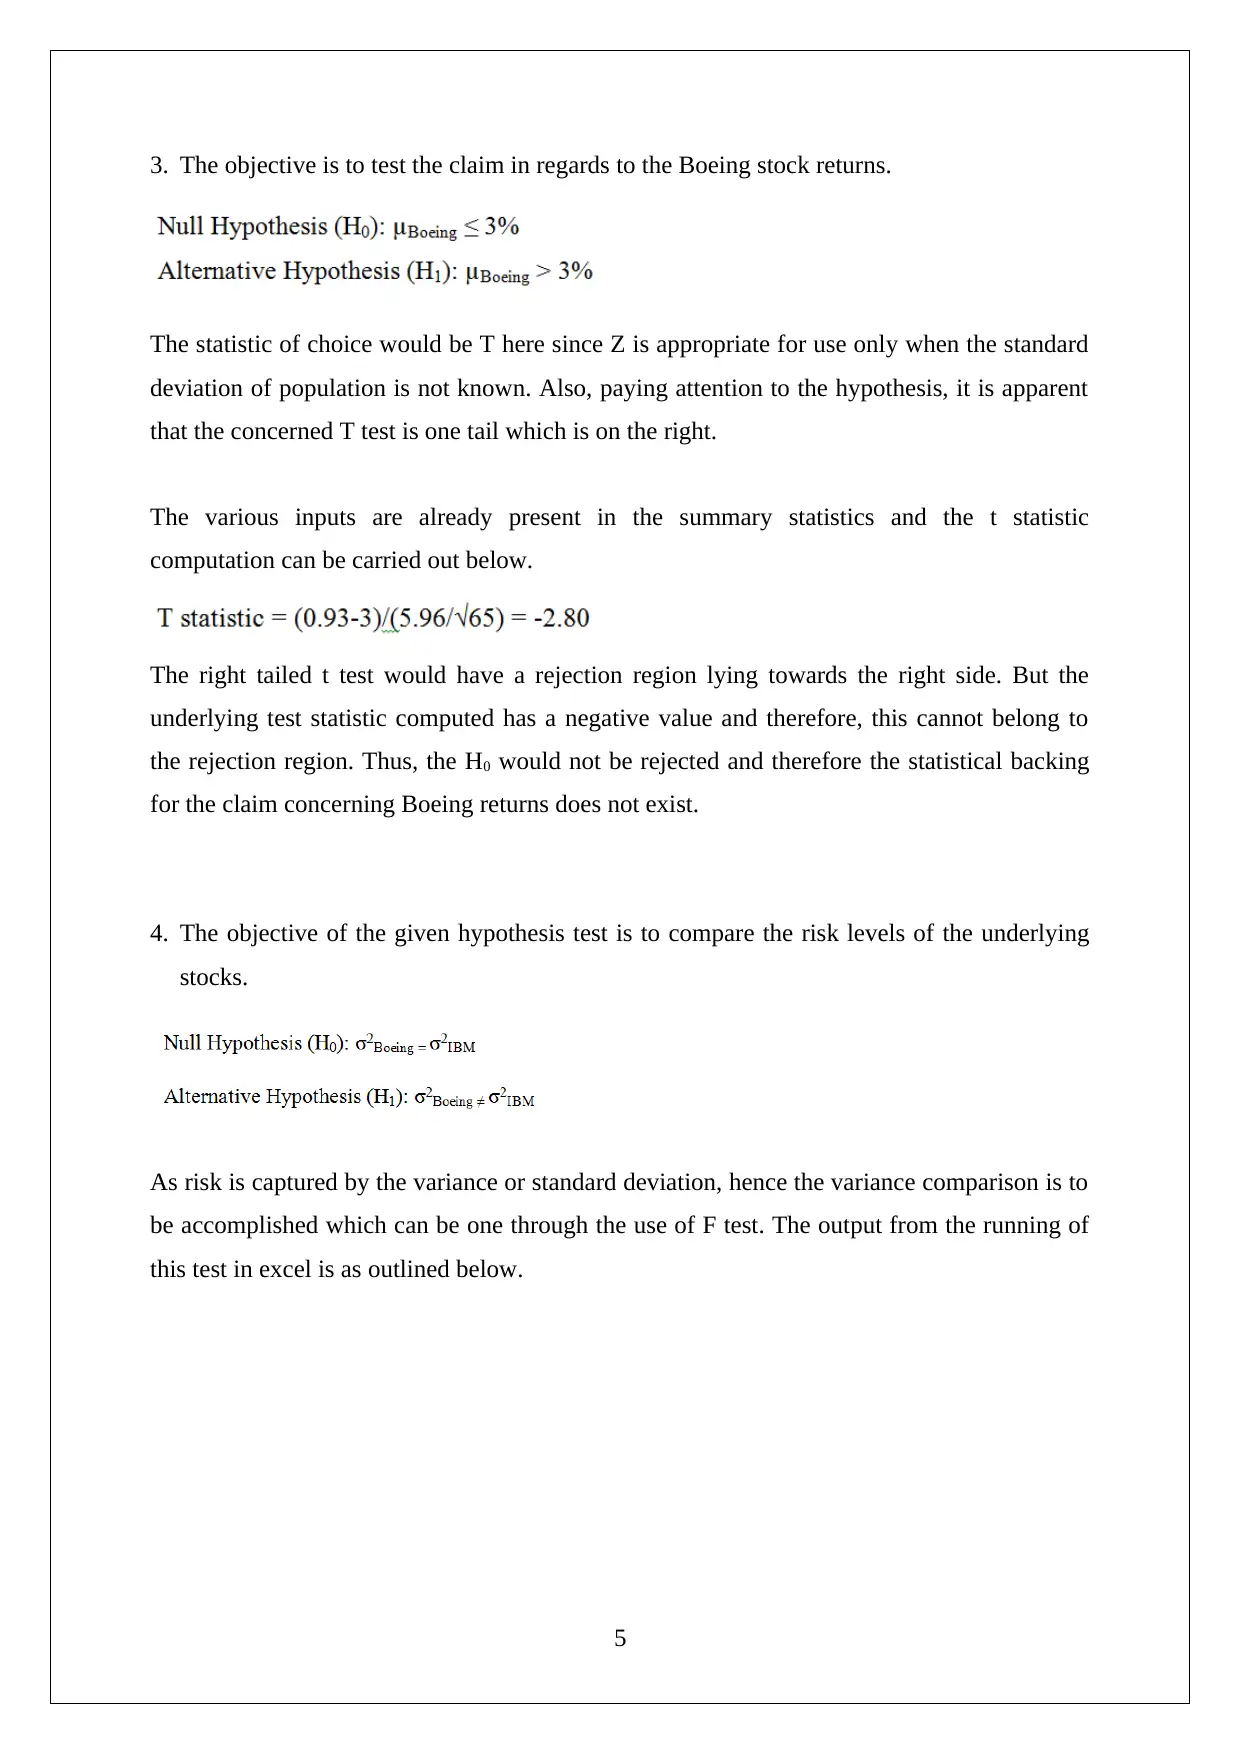
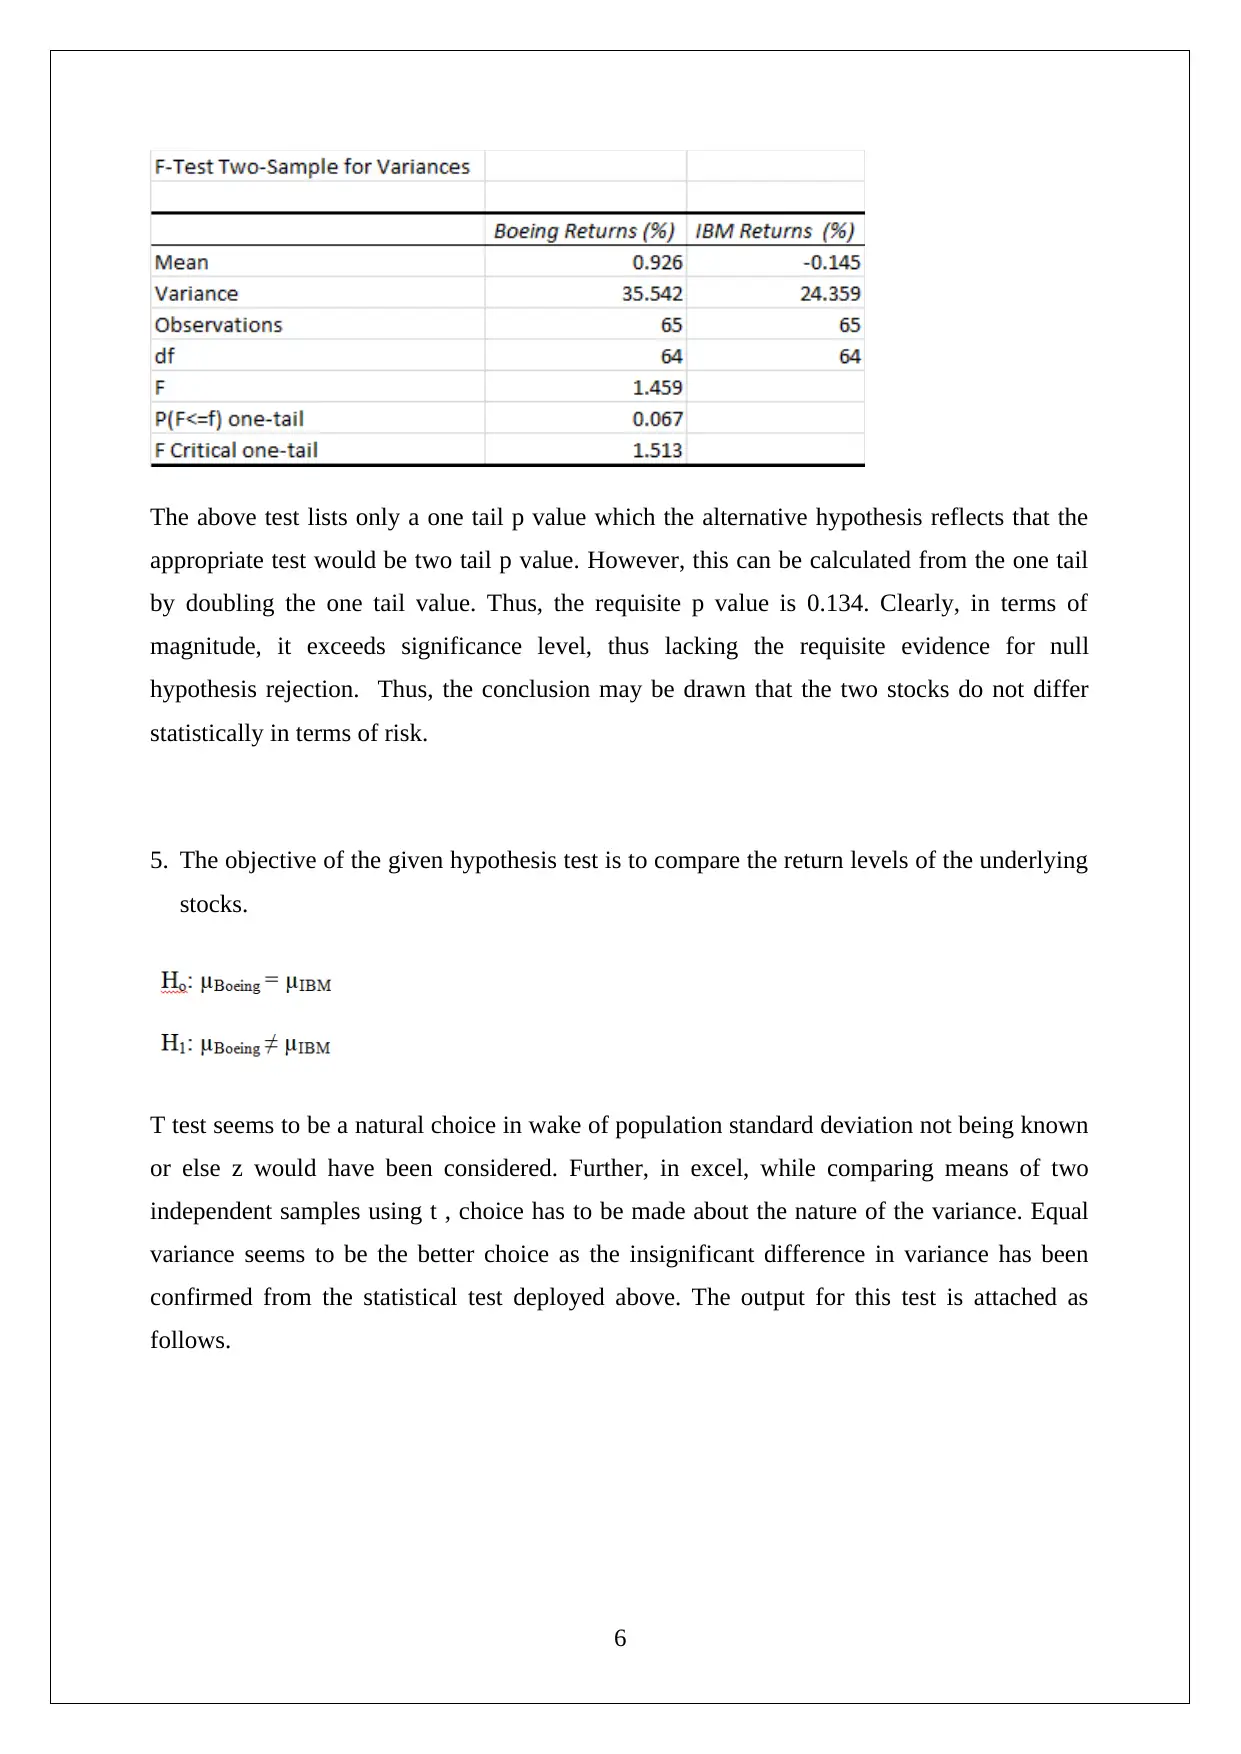
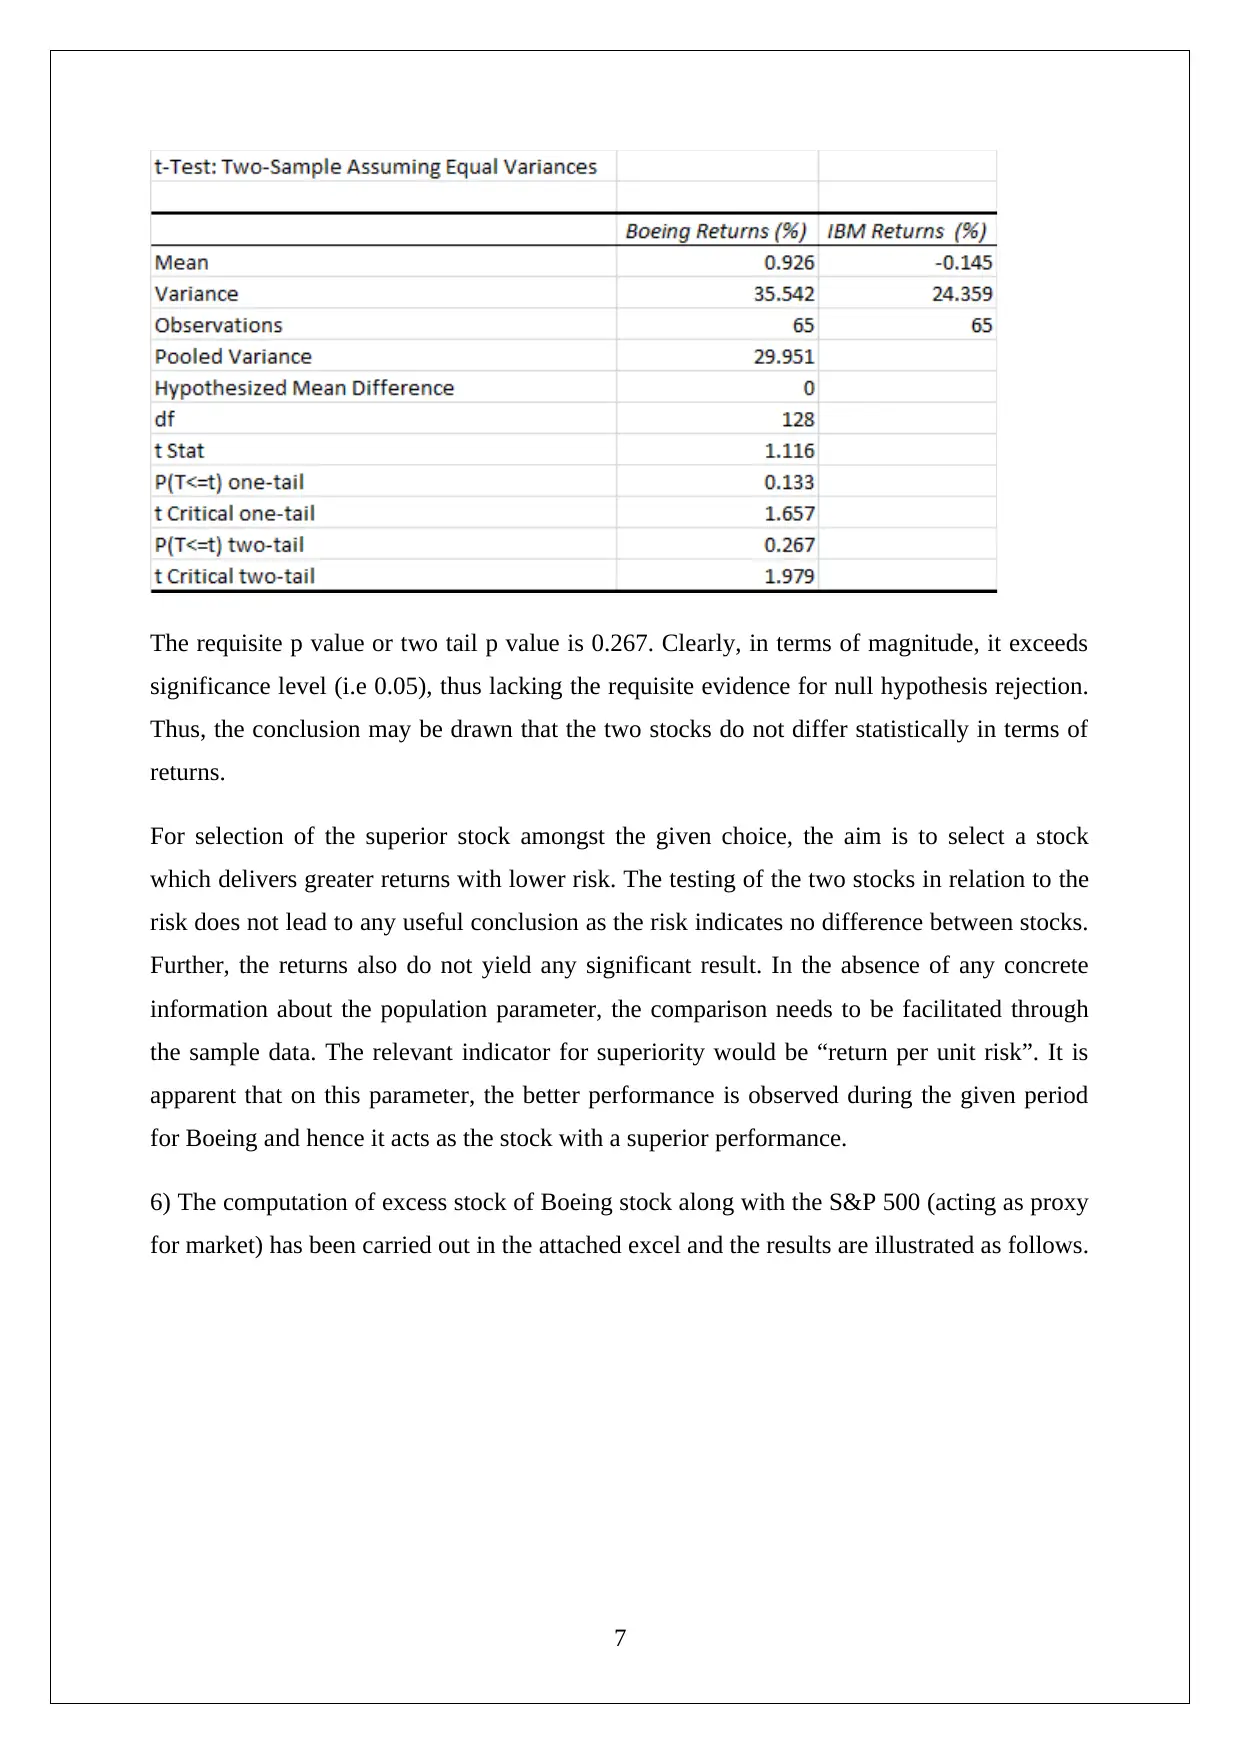
This assignment delves into the statistical analysis of stock data, focusing on the performance of Boeing and IBM. It begins with calculations of monthly returns and sample statistics, followed by an examination of normal distribution using the Jarque-Bera test. The assignment then applies hypothesis testing to evaluate Boeing's stock returns, compare risk levels using the F-test, and compare return levels using the t-test. The analysis extends to determining the superior stock based on return per unit of risk. Further, the Capital Asset Pricing Model (CAPM) is applied to Boeing, calculating the slope coefficient, R-squared value, and confidence interval for beta, followed by testing for stock neutrality. The assignment concludes with an interpretation of Boeing and IBM stock trends and a residual plot to test for error normality. The document provides a comprehensive statistical evaluation of the stocks, covering various financial metrics and testing methodologies.

STATISTICS FOR BUSINESS & FINANCE
[Type the document subtitle]
STUDENT ID
[Pick the date]
[Type the document subtitle]
STUDENT ID
[Pick the date]
Paraphrase This Document
Need a fresh take? Get an instant paraphrase of this document with our AI Paraphraser

PART A: Calculations
1. Graphical Output (Time Series of Closing Prices)
1
1. Graphical Output (Time Series of Closing Prices)
1

2. a) The above data has been used for monthly returns determination based on the provided
formula for this purpose. The findings of monthly returns have been represented in a table
attached as follows.
2
formula for this purpose. The findings of monthly returns have been represented in a table
attached as follows.
2
⊘ This is a preview!⊘
Do you want full access?
Subscribe today to unlock all pages.

Trusted by 1+ million students worldwide

3
Paraphrase This Document
Need a fresh take? Get an instant paraphrase of this document with our AI Paraphraser

2. b) Sample Statistics (Boeing, IBM, Index Monthly Returns)
2. c) Normal Distribution (Jarque Berra Test)
Ho: Distribution is normal
H1: Distribution is non-normal
For the three return distributions that are to be tested, the above null hypothesis and the
alternative hypothesis would be deployed.
The JB statistic needs to be determined which can then lead to the p value that can be
compared with the given significance level to indicate the rejection or non-rejection of H0 or
null hypothesis. The JB statistic would be computed for the given variables as per the below
mentioned formula.
The respective values of JB statistic on insertion of the applicable inputs are represented in
the following table.
Taking a chi square distribution, the respective p value is each of the cases comes greater
than 0.05. As applicable p value > significance level (0.05), hence null hypothesis rejection
does not take place. This inturn would imply that the given distributions can be assumed as
normal.
4

3. The objective is to test the claim in regards to the Boeing stock returns.
The statistic of choice would be T here since Z is appropriate for use only when the standard
deviation of population is not known. Also, paying attention to the hypothesis, it is apparent
that the concerned T test is one tail which is on the right.
The various inputs are already present in the summary statistics and the t statistic
computation can be carried out below.
The right tailed t test would have a rejection region lying towards the right side. But the
underlying test statistic computed has a negative value and therefore, this cannot belong to
the rejection region. Thus, the H0 would not be rejected and therefore the statistical backing
for the claim concerning Boeing returns does not exist.
4. The objective of the given hypothesis test is to compare the risk levels of the underlying
stocks.
As risk is captured by the variance or standard deviation, hence the variance comparison is to
be accomplished which can be one through the use of F test. The output from the running of
this test in excel is as outlined below.
5
⊘ This is a preview!⊘
Do you want full access?
Subscribe today to unlock all pages.

Trusted by 1+ million students worldwide

The above test lists only a one tail p value which the alternative hypothesis reflects that the
appropriate test would be two tail p value. However, this can be calculated from the one tail
by doubling the one tail value. Thus, the requisite p value is 0.134. Clearly, in terms of
magnitude, it exceeds significance level, thus lacking the requisite evidence for null
hypothesis rejection. Thus, the conclusion may be drawn that the two stocks do not differ
statistically in terms of risk.
5. The objective of the given hypothesis test is to compare the return levels of the underlying
stocks.
T test seems to be a natural choice in wake of population standard deviation not being known
or else z would have been considered. Further, in excel, while comparing means of two
independent samples using t , choice has to be made about the nature of the variance. Equal
variance seems to be the better choice as the insignificant difference in variance has been
confirmed from the statistical test deployed above. The output for this test is attached as
follows.
6
Paraphrase This Document
Need a fresh take? Get an instant paraphrase of this document with our AI Paraphraser

The requisite p value or two tail p value is 0.267. Clearly, in terms of magnitude, it exceeds
significance level (i.e 0.05), thus lacking the requisite evidence for null hypothesis rejection.
Thus, the conclusion may be drawn that the two stocks do not differ statistically in terms of
returns.
For selection of the superior stock amongst the given choice, the aim is to select a stock
which delivers greater returns with lower risk. The testing of the two stocks in relation to the
risk does not lead to any useful conclusion as the risk indicates no difference between stocks.
Further, the returns also do not yield any significant result. In the absence of any concrete
information about the population parameter, the comparison needs to be facilitated through
the sample data. The relevant indicator for superiority would be “return per unit risk”. It is
apparent that on this parameter, the better performance is observed during the given period
for Boeing and hence it acts as the stock with a superior performance.
6) The computation of excess stock of Boeing stock along with the S&P 500 (acting as proxy
for market) has been carried out in the attached excel and the results are illustrated as follows.
7

8
⊘ This is a preview!⊘
Do you want full access?
Subscribe today to unlock all pages.

Trusted by 1+ million students worldwide

7)a) CAPM For Boeing
c) R2 = 0.3835
d) Confidence interval for Beta of Boeing = (0.728, 1.411).
8) Testing for stock neutrality
The basic methodology of confidence interval based hypothesis testing is linked to determine
if there exists any intersection of overlapping of the interval and the hypothesized value.
Existence of intersection implies shortfall of evidence for null hypothesis rejection. For the
given data, there is overlapping of concerned value (1) with the confidence interval (0.728,
1.411). Hence, null hypothesis rejection would not happen thus implying Boeing stock being
neutral.
9) Residual Plots (Error Normality Test)
9
Paraphrase This Document
Need a fresh take? Get an instant paraphrase of this document with our AI Paraphraser

.
10
10

Part B: Interpretation
1) Boeing Stock – From the period beginning till February 2013, the stock did not post any
stellar gains or losses and remained within a defined range. But, during the next one year,
the stock experienced a significant upmove leading to the value becoming $ 140.
Afterwards, there has been consolidating taking place in the stock.
IBM Stock – The stock till March 2012 posted some gains when level $ 200 was attained.
However, this was followed by a period of consolidation which lasted about 12 months.
After that,, the stock started coming down and finally reached the bottom in January 2016
after which stock has reversed the trend so cover up some losses.
S&P 500 – From November 2011, the index has started an upward journey which lasted
for more than 3 years and resulted in 2000 level being attained by the index. Post May
2015, some consolidation in the index has been noticed.
2) b) The sample statistics on the basis of the price data reflect that Boeing is the superior
stock in terms of returns. However, when risk is considered, then Boeing tends to be the
riskier one owing to higher dispersion observed in returns as has been represented by the
standard deviation. But, the better stock in totality would be Boeing due to the empirical
evidence of providing higher returns for every unit of risk.
c) The normality testing assumes criticality on account of the underlying significance in
hypothesis testing. This is especially the case with inferential statistical methods whereby
the underlying assumptions are significant as it affects the appropriate technique that is
deployed. Hence, underlying knowledge of normality assumes high importance in this
context.
5) The testing of the two stocks in relation to the risk does not lead to any useful conclusion
as the risk indicates no difference between stocks. Further, the returns also do not yield any
significant result. In the absence of any concrete information about the population parameter,
the comparison needs to be facilitated through the sample data. The relevant indicator for
superiority would be “return per unit risk”. It is apparent that on this parameter, the better
performance is observed during the given period for Boeing and hence it acts as the stock
with a superior performance.
11
⊘ This is a preview!⊘
Do you want full access?
Subscribe today to unlock all pages.

Trusted by 1+ million students worldwide
1 out of 13
Related Documents

Your All-in-One AI-Powered Toolkit for Academic Success.
+13062052269
info@desklib.com
Available 24*7 on WhatsApp / Email
Unlock your academic potential
Copyright © 2020–2025 A2Z Services. All Rights Reserved. Developed and managed by ZUCOL.