Analysis of Height Data Using T-test: A Statistical Report

Verified

Added on  2022/09/21

|4
|401
|20
Report
AI Summary
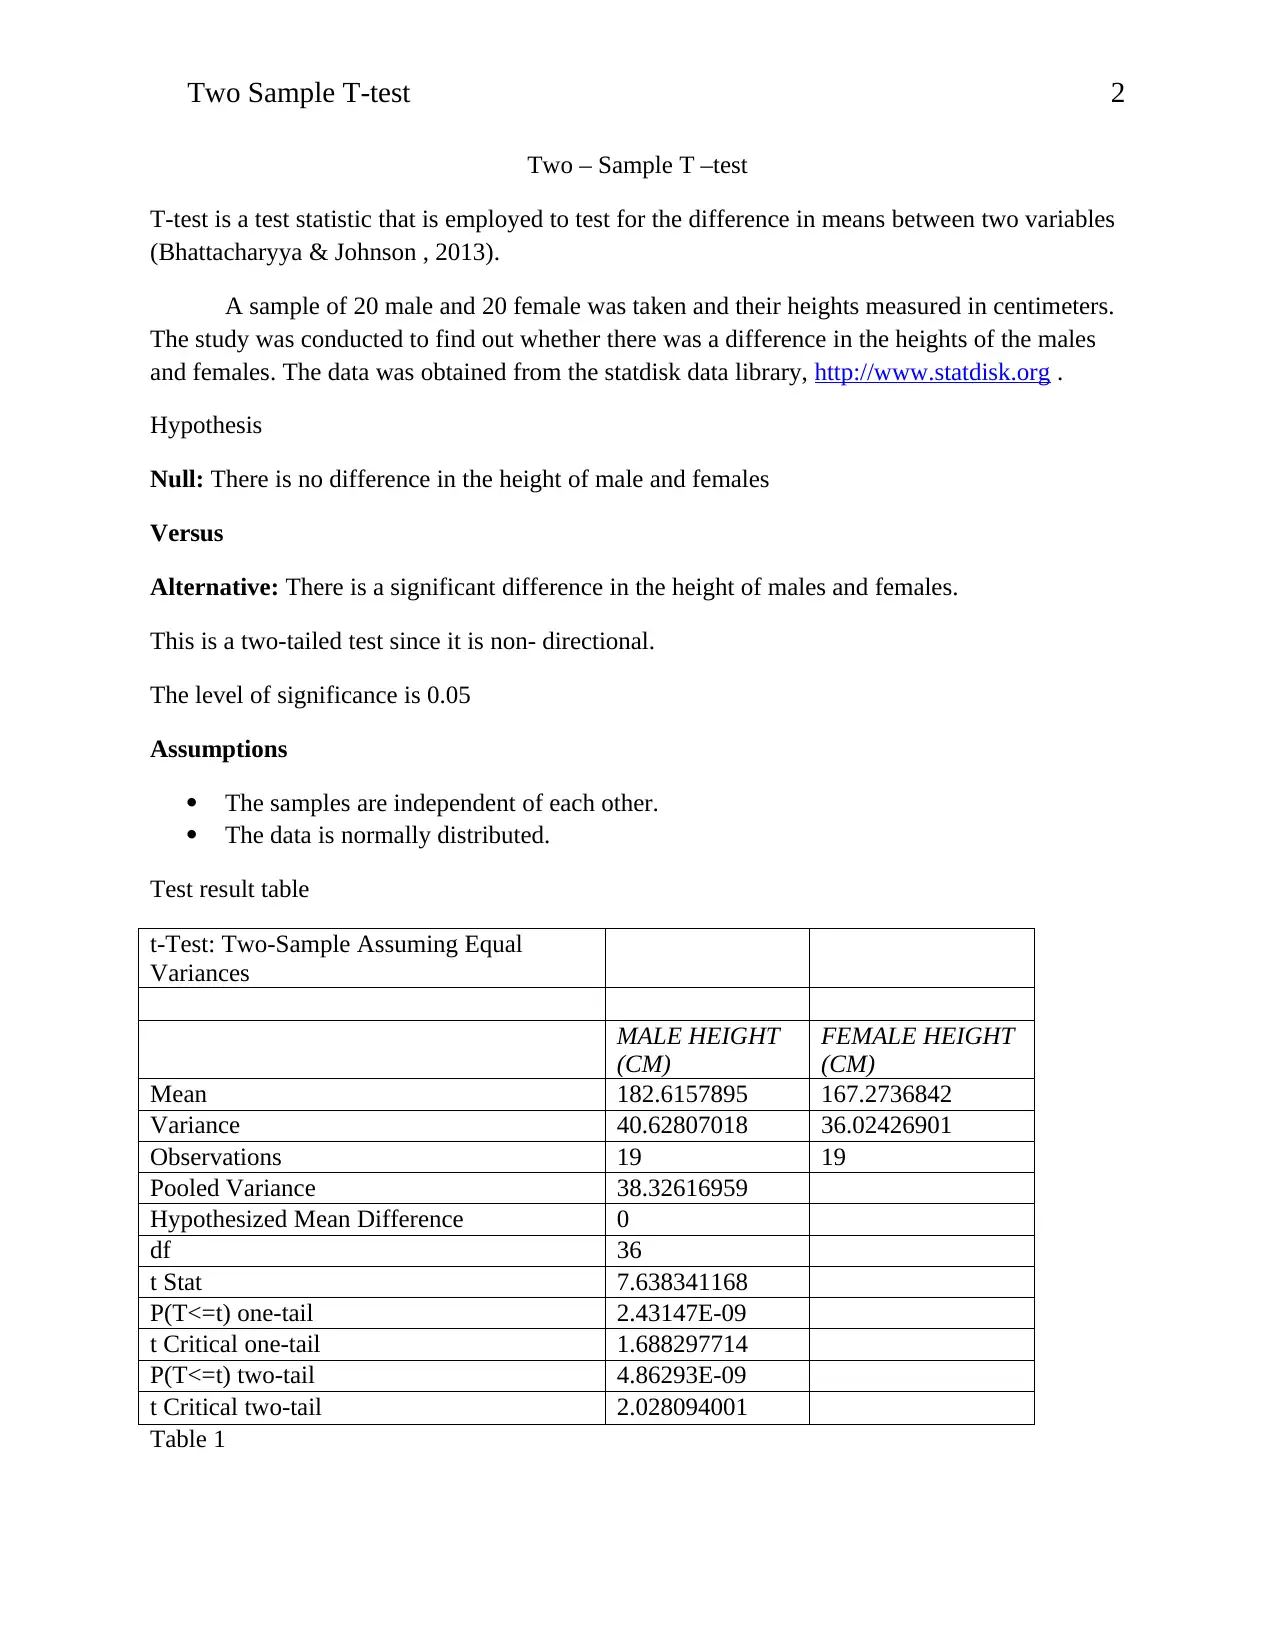
This report presents a t-test analysis comparing the heights of males and females. The study utilized a two-sample t-test to determine if there was a significant difference in the mean heights of the two groups. Data was obtained from a statistical data library, and the null hypothesis stated that there was no difference in height. The analysis included descriptive statistics, such as means and standard deviations, as well as the t-test results, including the t-statistic, p-value, and degrees of freedom. The results of the t-test indicated a significant difference in the heights of males and females, leading to the rejection of the null hypothesis. The report concludes with a discussion of the findings and their implications, highlighting the practical significance of the results for decision-making. The t-test results, including the p-value, were compared to the level of significance, allowing for a conclusion about the phenomenon being tested, and the report includes a reference section with the sources used for the analysis.
Document Page
Running head: Two-Sample T-test 1
Two – Sample T-test
Course code:
Student name:
Tutor:
tabler-icon-diamond-filled.svg

Paraphrase This Document

Need a fresh take? Get an instant paraphrase of this document with our AI Paraphraser
Document Page
Two Sample T-test 2
Two – Sample T –test
T-test is a test statistic that is employed to test for the difference in means between two variables
(Bhattacharyya & Johnson , 2013).
A sample of 20 male and 20 female was taken and their heights measured in centimeters.
The study was conducted to find out whether there was a difference in the heights of the males
and females. The data was obtained from the statdisk data library, http://www.statdisk.org .
Hypothesis
Null: There is no difference in the height of male and females
Versus
Alternative: There is a significant difference in the height of males and females.
This is a two-tailed test since it is non- directional.
The level of significance is 0.05
Assumptions
The samples are independent of each other.
The data is normally distributed.
Test result table
t-Test: Two-Sample Assuming Equal
Variances
MALE HEIGHT
(CM)
FEMALE HEIGHT
(CM)
Mean 182.6157895 167.2736842
Variance 40.62807018 36.02426901
Observations 19 19
Pooled Variance 38.32616959
Hypothesized Mean Difference 0
df 36
t Stat 7.638341168
P(T<=t) one-tail 2.43147E-09
t Critical one-tail 1.688297714
P(T<=t) two-tail 4.86293E-09
t Critical two-tail 2.028094001
Table 1
Document Page
Two Sample T-test 3
From the t-test table of results above, we are able to compare the p-value calculated and the level
of significance.
Since p-value <0.00 is less than the level of significance, the null hypothesis is rejected.
There was a significant difference in the mean height of males (M = 182.62, SD= 40.63) and
females (M= 167.27, SD = 36.02); t(8 )= 7.63 , p = 0.00
This information is very important to a decision maker as it will make him have a conclusion
about a phenomenon that is being tested (Berenson & Levine , 2006).
Document Page
Two Sample T-test 4
References
Berenson, M. L., & Levine , D. M. (2006). Basic Business Statistics. New Jersey: Prentice-Hall,
Englewood Cliffs.
Bhattacharyya, G. K., & Johnson , R. A. (2013). Statistical Concepts and Methods. New York:
John Wiley and Sons.
.
chevron_up_icon
1 out of 4
circle_padding
hide_on_mobile
zoom_out_icon
[object Object]