Statistical Analysis of Tax Lodgement Methods: A Comprehensive Report
VerifiedAdded on 2020/05/28
|35
|10020
|44
Report
AI Summary
This report presents a statistical analysis of tax lodgement methods using two datasets. Dataset 1, sourced from the Australian Taxation Office, explores the relationship between lodgement method (agent vs. self), age range, total income, and deduction amounts. The analysis includes frequency distributions, one-sample proportional Z-tests, Pearson correlation coefficients, and linear regression to examine relationships between variables. Dataset 2, gathered via survey, focuses on international students' preferences for lodgement methods. The report compares the two datasets using two-sample Z-tests to determine if there is any significant difference between them. Key findings include the proportions of agent vs. self-lodgement, the correlation between age range and lodgement method, and the relationship between total income and lodgement method. The report concludes with a discussion of the findings and suggestions for further research.

Problem Analysis and Statistics
Name of the Student:
Name of the University:
Author’s note:
Name of the Student:
Name of the University:
Author’s note:
Paraphrase This Document
Need a fresh take? Get an instant paraphrase of this document with our AI Paraphraser
PROBLEM ANALYSIS AND STATISTICS
Table of Contents
1. Section 1: Introduction............................................................................................................................................................................3
a) Brief introduction about the assignment:.............................................................................................................................................3
b) Dataset 1:............................................................................................................................................................................................3
c) Dataset 2:.............................................................................................................................................................................................3
2. Section 2: Lodgement Method-Dataset 1...............................................................................................................................................3
A) Part a...................................................................................................................................................................................................3
B) Part b...................................................................................................................................................................................................4
C) Part c...................................................................................................................................................................................................4
3. Section 3: Lodgement Method-Dataset2.................................................................................................................................................4
A) Part a...................................................................................................................................................................................................4
B) Part b...................................................................................................................................................................................................5
C) Part c...................................................................................................................................................................................................5
4. Section 4: Lodgement Method and Age group-Dataset1:.......................................................................................................................6
A) Part a...................................................................................................................................................................................................6
B) Part b.................................................................................................................................................................................................10
C) Part c.................................................................................................................................................................................................11
5. Section 5: Lodgement Method and Total Income Amount-Dataset1:...................................................................................................11
A) Part a.................................................................................................................................................................................................11
B) Part b.................................................................................................................................................................................................13
6. Section 6: Total Income Amount and Deduction Amount-Data set 1:..................................................................................................16
A) Part a.................................................................................................................................................................................................16
B) Part b.................................................................................................................................................................................................19
Correlation:........................................................................................................................................................................................19
Regression:........................................................................................................................................................................................19
7. Section7: Conclusion.............................................................................................................................................................................20
A) Part a.................................................................................................................................................................................................20
B) Part b: Further Research...................................................................................................................................................................20
References:................................................................................................................................................................................................21
Appendices:...............................................................................................................................................................................................22
Dataset 1:...............................................................................................................................................................................................22
Dataset 2:...............................................................................................................................................................................................36
PROBLEM ANALYSIS AND STATISTICS
1. Section 1: Introduction
a) Brief introduction about the assignment:
Many people need to lodge a tax return after the end of the financial year in Australia. Australians could arrange and lodge an
own tax return or pay a registered tax agent for doing it for themselves. By using a subset of the sample-file from the Australian
Taxation Office (ATO), we are briefly discussing and analysing various hidden facts of lodgement method.
The report is structured elaborating two datasets. The first dataset is consists of five variables that are Gender, age_range,
Lodgement_method, Tot_inc_amt and Tot_ded_amt. We are interested to know the proportion of people who prefer to lodge a tax
return using a tax agent. We are also keen to observe the difference among the age groups with accordance to respective lodging
group. We are examining whether there exists an inherent relationship between total income and lodgement method or not. Finally, we
are investigating whether there is an association between total income and deduction amount or not.
A tax agent to lodge a tax return in the future constructs the second dataset with primary survey. The dataset 2 is a collection
of preference of international students of tax return lodgement method.
b) Dataset 1:
The dataset1 is a secondary data. The data is gathered from internet sources. In dataset1, Gender is a qualitative variable,
age_range is the ordinal variable, Lodgement_method is the nominal variable, Tot_inc_amt and Tot_inc_amt are the numeric
variables. Here, gender and lodgement method is factorised where “Male”=1, “Female” = 0 and “A”=1, “S”=2.
c) Dataset 2:
The dataset2 is primary. The samples of data are collected by survey method. In dataset2, we took into account only
quantitative dataset that is actually lodgement method. The data is gathered by survey method. The target population was 50 students,
among which 15 students refused to respond. The remaining 35 students responded about the questions of questionnaire of survey
method. Therefore, the sample size of the data is 35. The data sampling method is simple random sampling without replacement,
which is unbiased in nature. However, we nullified the missing data for getting good results. Hence, bias could arise. The dataset
involves two variables that are “Country_name” and “Lodgment_method”. Lodgement method has similar levels in dataset2 as was in
dataset1 that are “A”=lodgement by agent and “S”=lodgement by self-preparation.
2. Section 2: Lodgement Method-Dataset 1
A) Part a
Lodgment Frequency Proportion
Agent 741 0.741
Self 259 0.259
Total 1000 1
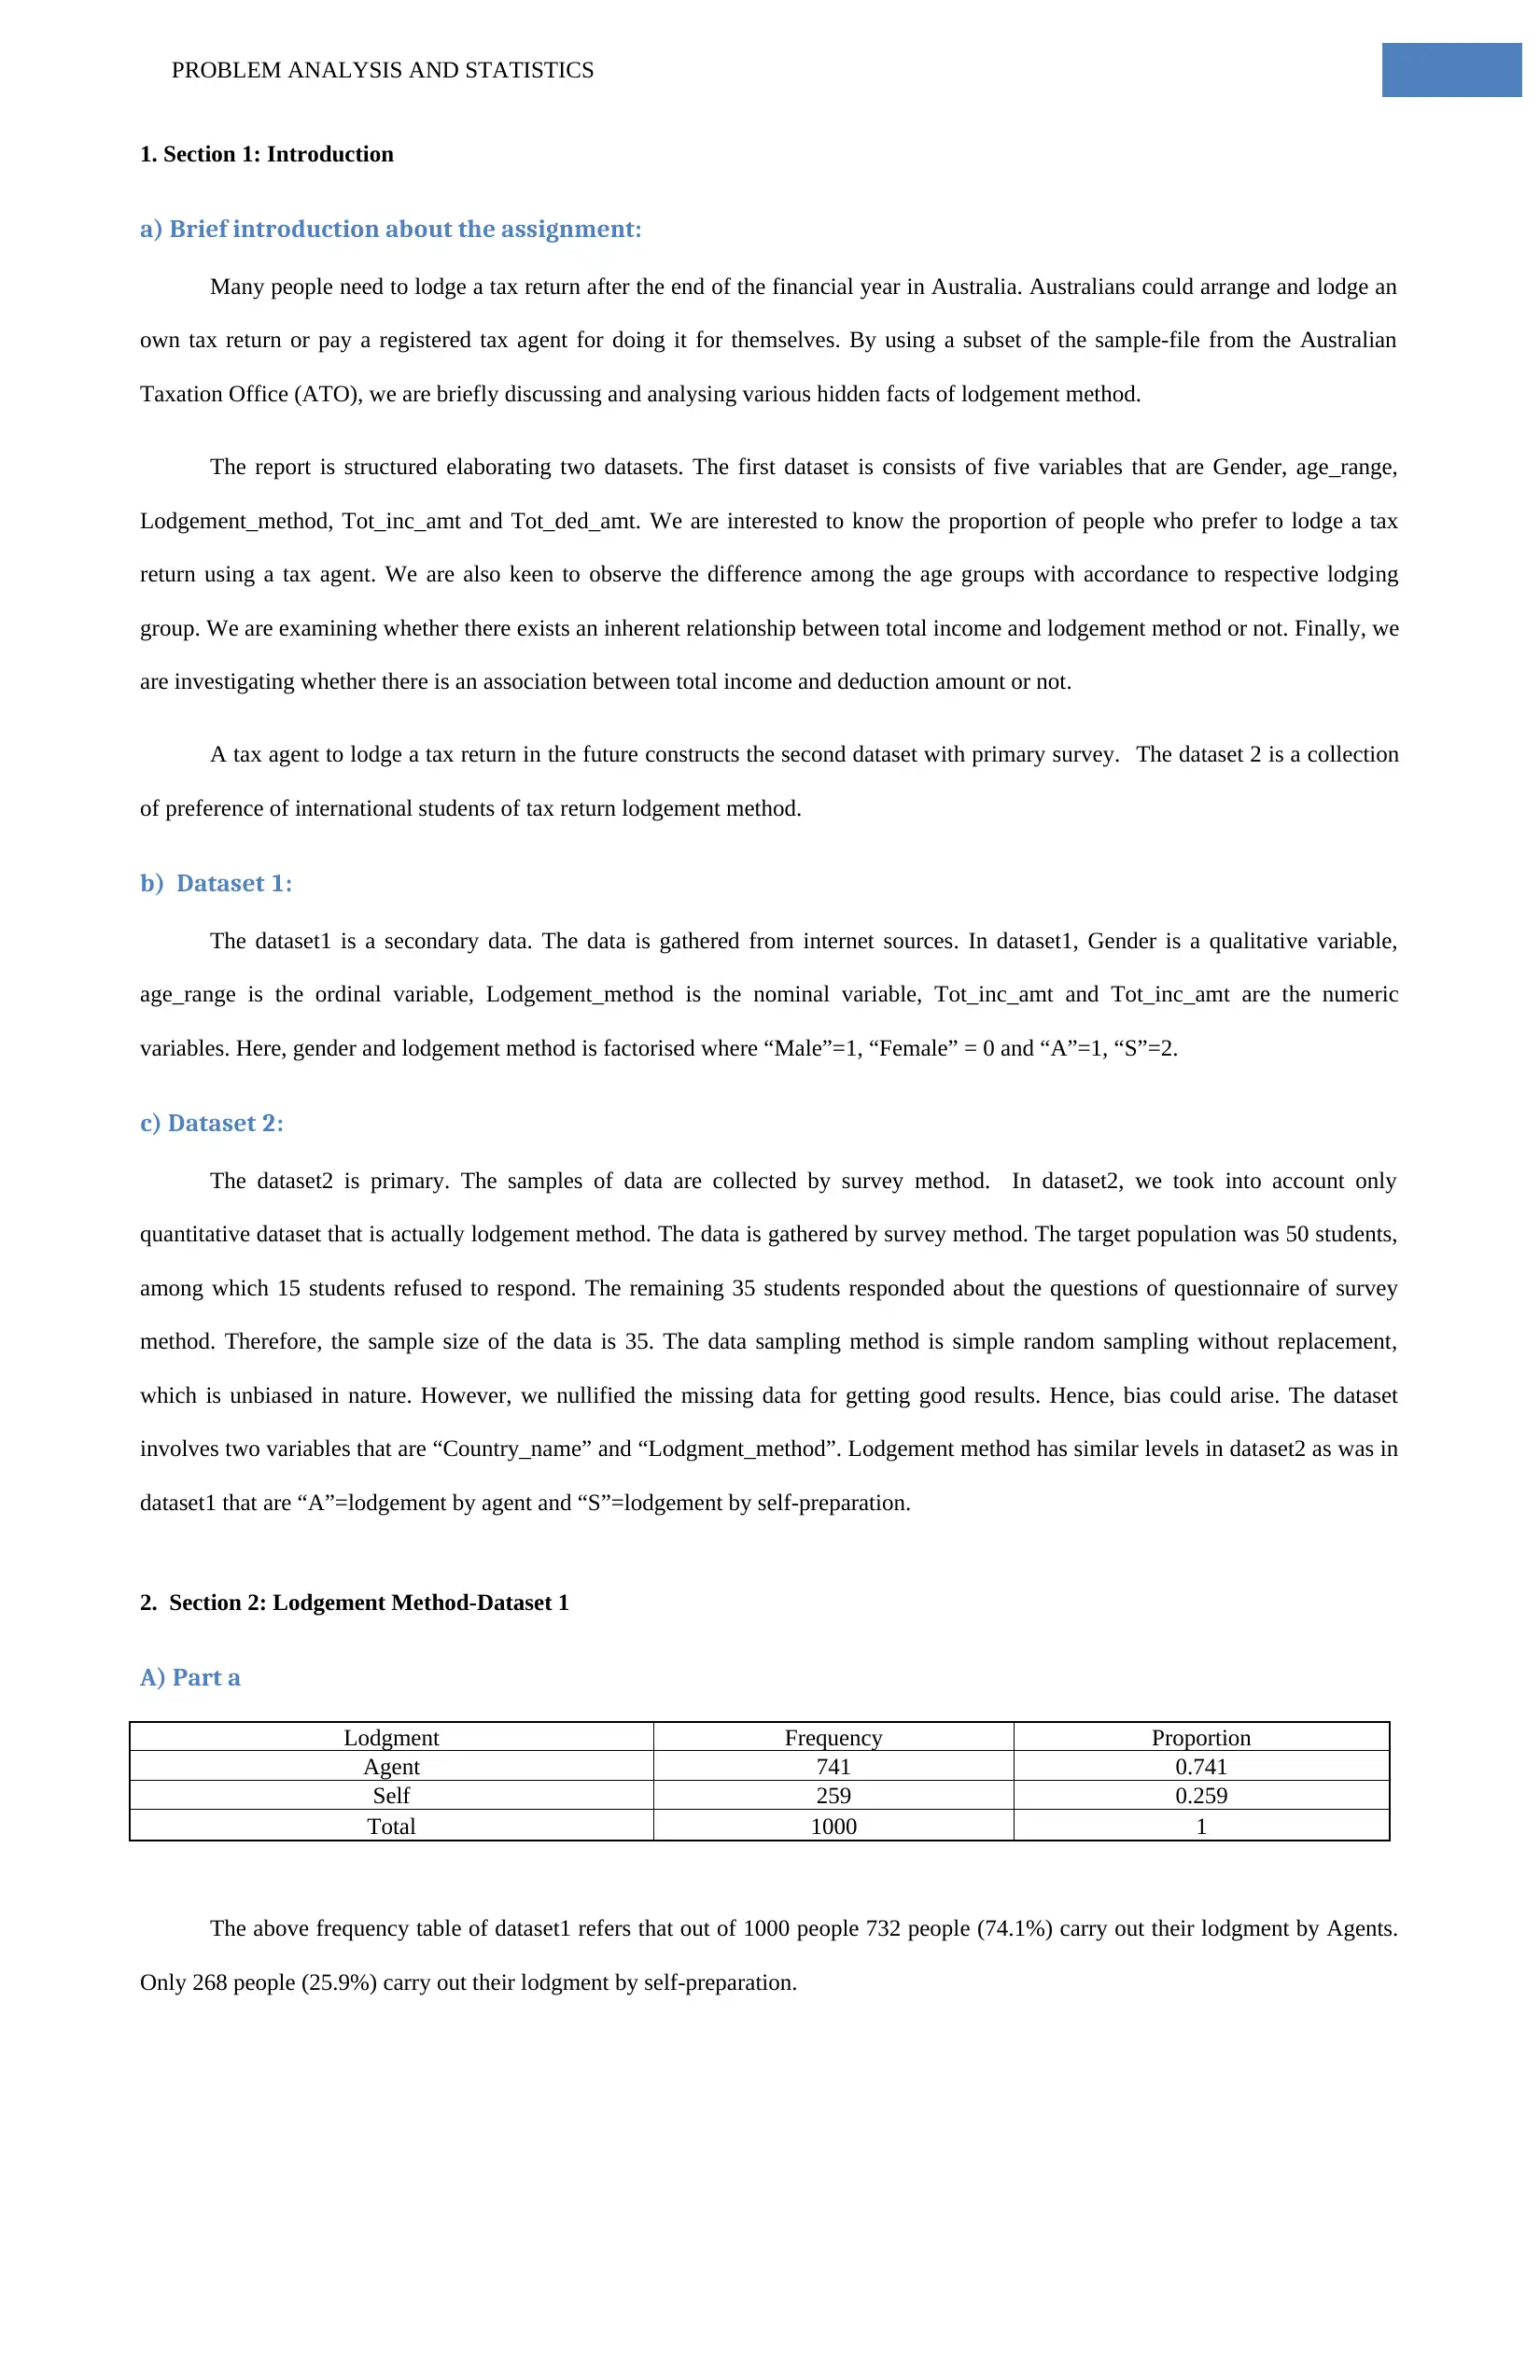
The above frequency table of dataset1 refers that out of 1000 people 732 people (74.1%) carry out their lodgment by Agents.
Only 268 people (25.9%) carry out their lodgment by self-preparation.
1. Section 1: Introduction
a) Brief introduction about the assignment:
Many people need to lodge a tax return after the end of the financial year in Australia. Australians could arrange and lodge an
own tax return or pay a registered tax agent for doing it for themselves. By using a subset of the sample-file from the Australian
Taxation Office (ATO), we are briefly discussing and analysing various hidden facts of lodgement method.
The report is structured elaborating two datasets. The first dataset is consists of five variables that are Gender, age_range,
Lodgement_method, Tot_inc_amt and Tot_ded_amt. We are interested to know the proportion of people who prefer to lodge a tax
return using a tax agent. We are also keen to observe the difference among the age groups with accordance to respective lodging
group. We are examining whether there exists an inherent relationship between total income and lodgement method or not. Finally, we
are investigating whether there is an association between total income and deduction amount or not.
A tax agent to lodge a tax return in the future constructs the second dataset with primary survey. The dataset 2 is a collection
of preference of international students of tax return lodgement method.
b) Dataset 1:
The dataset1 is a secondary data. The data is gathered from internet sources. In dataset1, Gender is a qualitative variable,
age_range is the ordinal variable, Lodgement_method is the nominal variable, Tot_inc_amt and Tot_inc_amt are the numeric
variables. Here, gender and lodgement method is factorised where “Male”=1, “Female” = 0 and “A”=1, “S”=2.
c) Dataset 2:
The dataset2 is primary. The samples of data are collected by survey method. In dataset2, we took into account only
quantitative dataset that is actually lodgement method. The data is gathered by survey method. The target population was 50 students,
among which 15 students refused to respond. The remaining 35 students responded about the questions of questionnaire of survey
method. Therefore, the sample size of the data is 35. The data sampling method is simple random sampling without replacement,
which is unbiased in nature. However, we nullified the missing data for getting good results. Hence, bias could arise. The dataset
involves two variables that are “Country_name” and “Lodgment_method”. Lodgement method has similar levels in dataset2 as was in
dataset1 that are “A”=lodgement by agent and “S”=lodgement by self-preparation.
2. Section 2: Lodgement Method-Dataset 1
A) Part a
Lodgment Frequency Proportion
Agent 741 0.741
Self 259 0.259
Total 1000 1
The above frequency table of dataset1 refers that out of 1000 people 732 people (74.1%) carry out their lodgment by Agents.
Only 268 people (25.9%) carry out their lodgment by self-preparation.
⊘ This is a preview!⊘
Do you want full access?
Subscribe today to unlock all pages.
Trusted by 1+ million students worldwide
PROBLEM ANALYSIS AND STATISTICS
741; 74%
259; 26%
Pie Chart of Lodgement Method
agent
self
The pie chart refers the distribution of two types of lodgment methods that are agent (A) and self-preparation (S) in dataset1.
B) Part b
One Sample Proportional Z-test
proportion (p) = 0.741
(1-p) = 0.259
total sample = 1000
standard error = 0.013853
Level of significance = 5%
confidence limit = 95%
z-value at 0.05 critical region = 1.96
Confidence Intervals
upper confidence interval = 0.768152
lower confidence interval = 0.713848
C) Part c
One sample proportional z-test is used for testing the proportion of lodging method as agent. The exact proportion of lodging
method as agent is 0.741. The lower and upper confidence intervals of proportion of lodging method by agents are 0.713848 and
0.768152 at 5% level of significance. It refers that there is 95% probability of being the proportion of lodging method via agent
between these two intervals.
3. Section 3: Lodgement Method-Dataset2
A) Part a
Lodgment Count Proportion
Agent 27 0.771428571
Self 8 0.228571429
Total 35 1
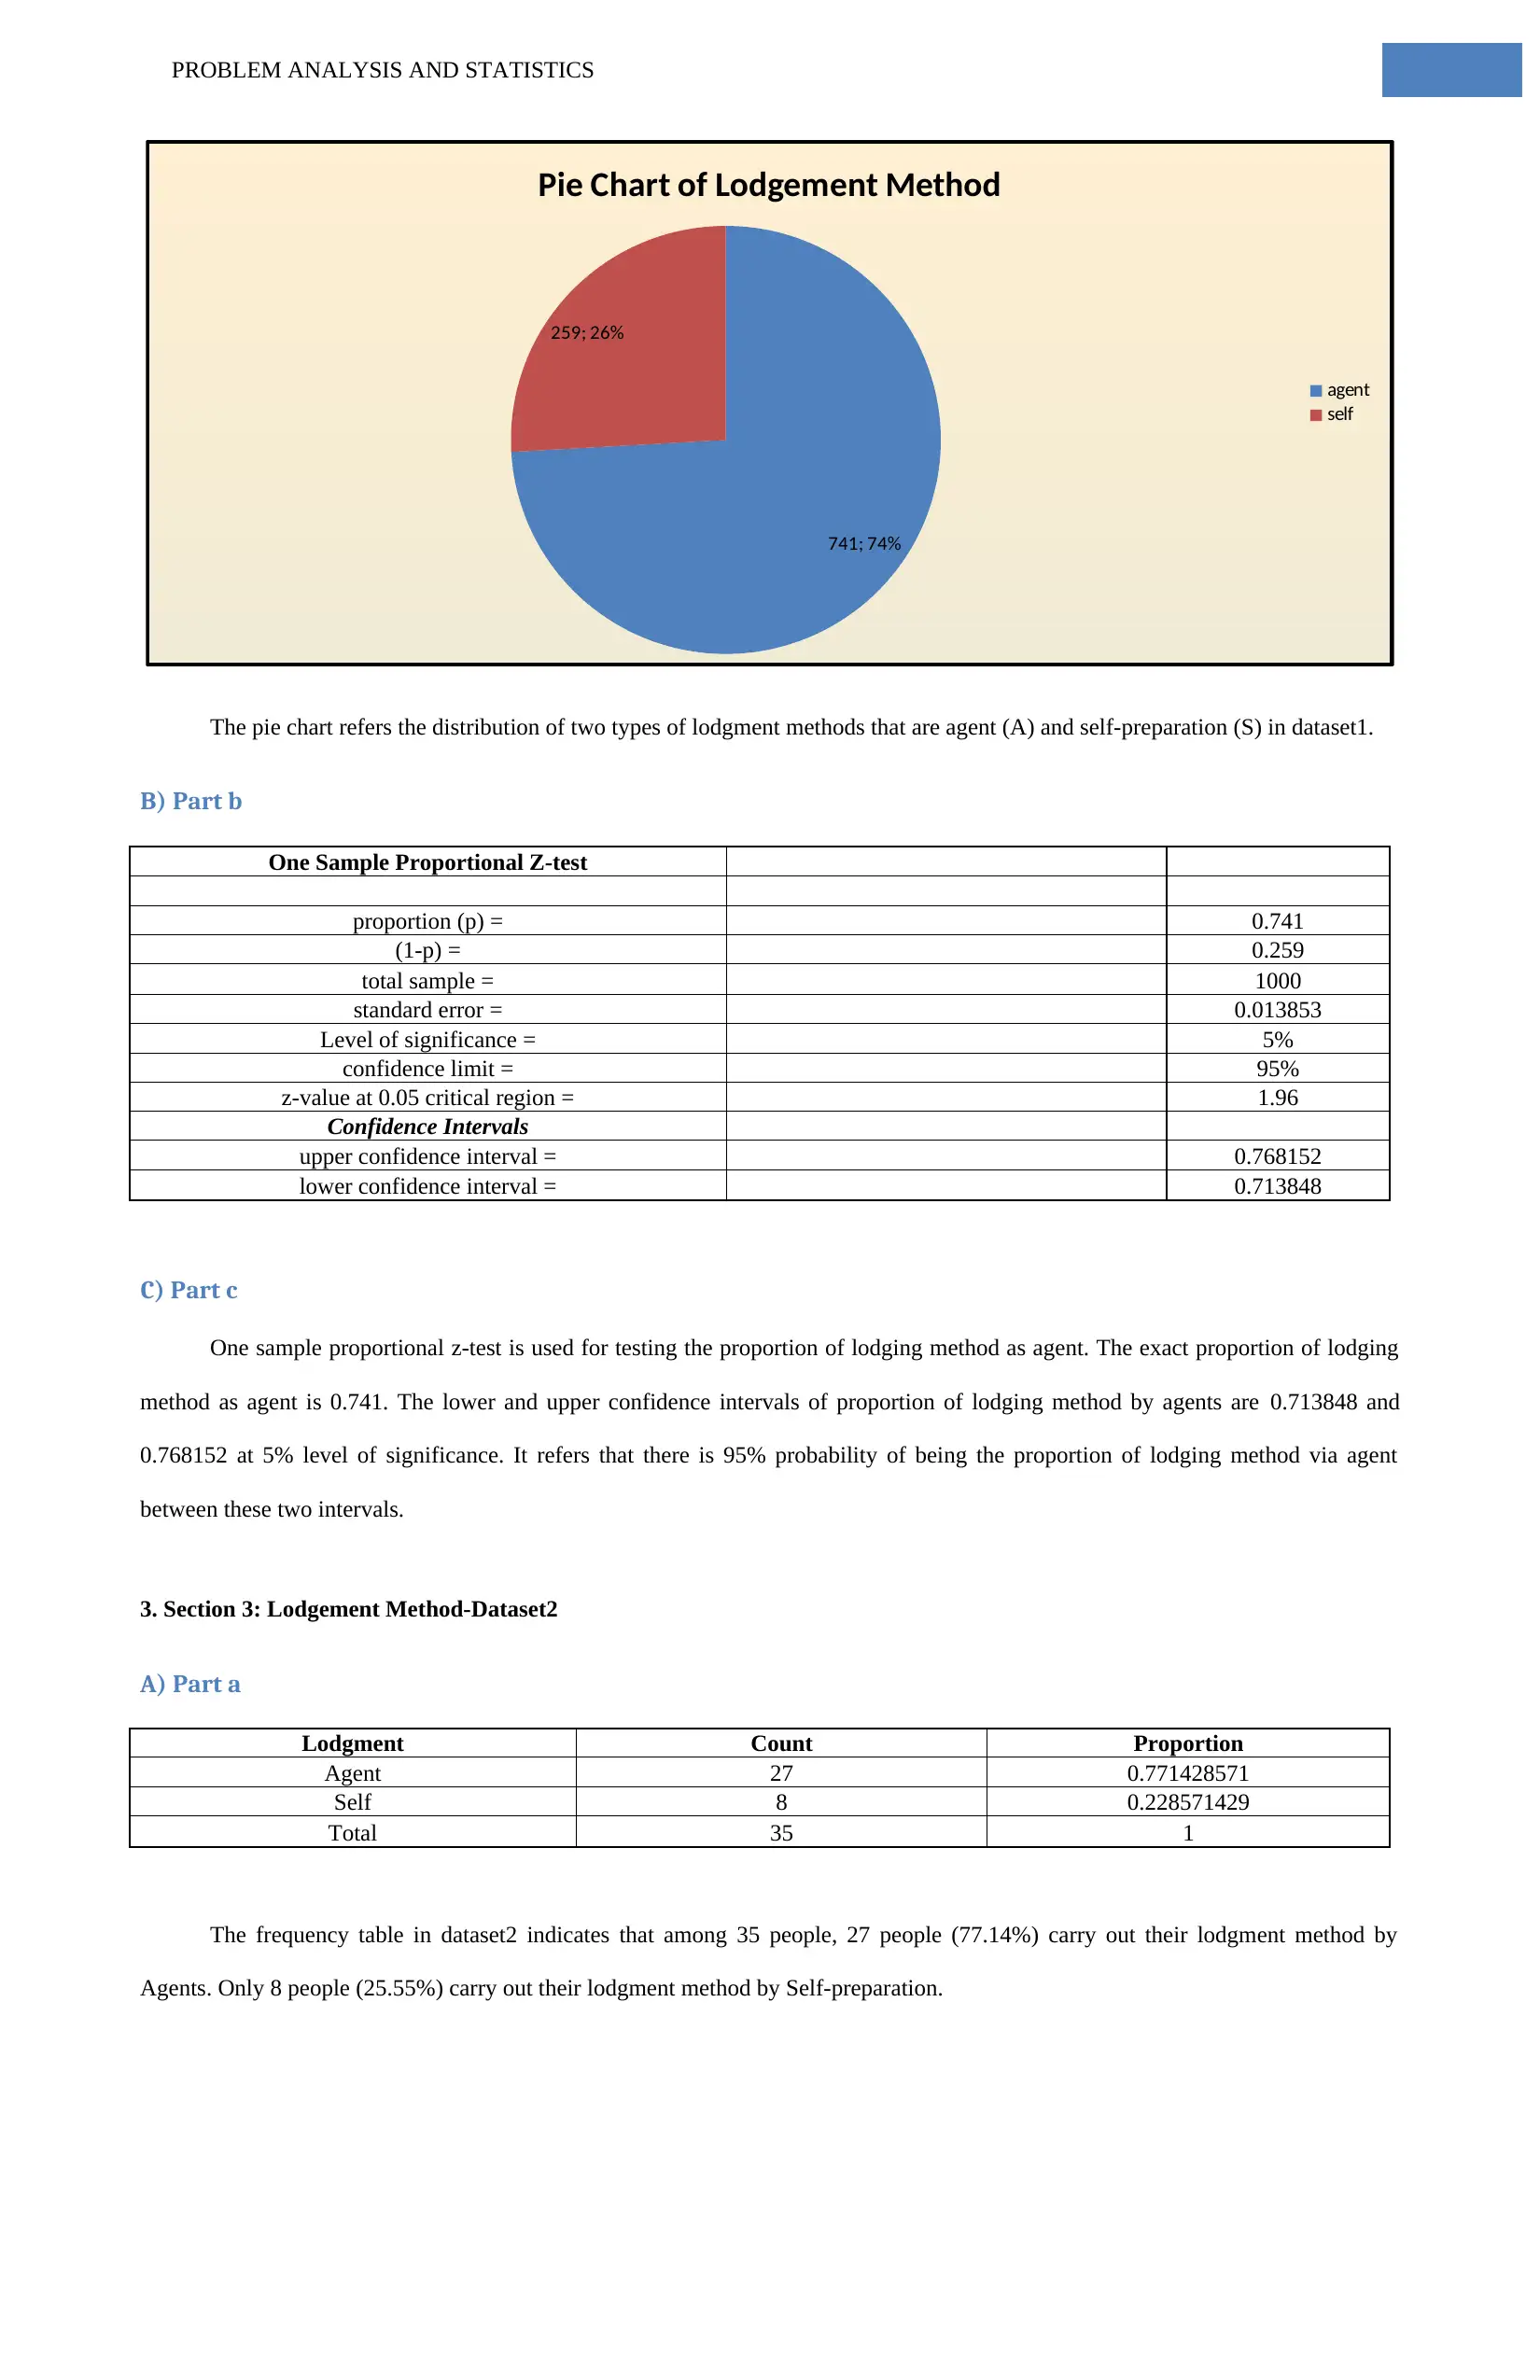
The frequency table in dataset2 indicates that among 35 people, 27 people (77.14%) carry out their lodgment method by
Agents. Only 8 people (25.55%) carry out their lodgment method by Self-preparation.
741; 74%
259; 26%
Pie Chart of Lodgement Method
agent
self
The pie chart refers the distribution of two types of lodgment methods that are agent (A) and self-preparation (S) in dataset1.
B) Part b
One Sample Proportional Z-test
proportion (p) = 0.741
(1-p) = 0.259
total sample = 1000
standard error = 0.013853
Level of significance = 5%
confidence limit = 95%
z-value at 0.05 critical region = 1.96
Confidence Intervals
upper confidence interval = 0.768152
lower confidence interval = 0.713848
C) Part c
One sample proportional z-test is used for testing the proportion of lodging method as agent. The exact proportion of lodging
method as agent is 0.741. The lower and upper confidence intervals of proportion of lodging method by agents are 0.713848 and
0.768152 at 5% level of significance. It refers that there is 95% probability of being the proportion of lodging method via agent
between these two intervals.
3. Section 3: Lodgement Method-Dataset2
A) Part a
Lodgment Count Proportion
Agent 27 0.771428571
Self 8 0.228571429
Total 35 1
The frequency table in dataset2 indicates that among 35 people, 27 people (77.14%) carry out their lodgment method by
Agents. Only 8 people (25.55%) carry out their lodgment method by Self-preparation.
Paraphrase This Document
Need a fresh take? Get an instant paraphrase of this document with our AI Paraphraser
PROBLEM ANALYSIS AND STATISTICS
27; 77%
8; 23%
Pie Chart of Lodgment Method
Agent
Self
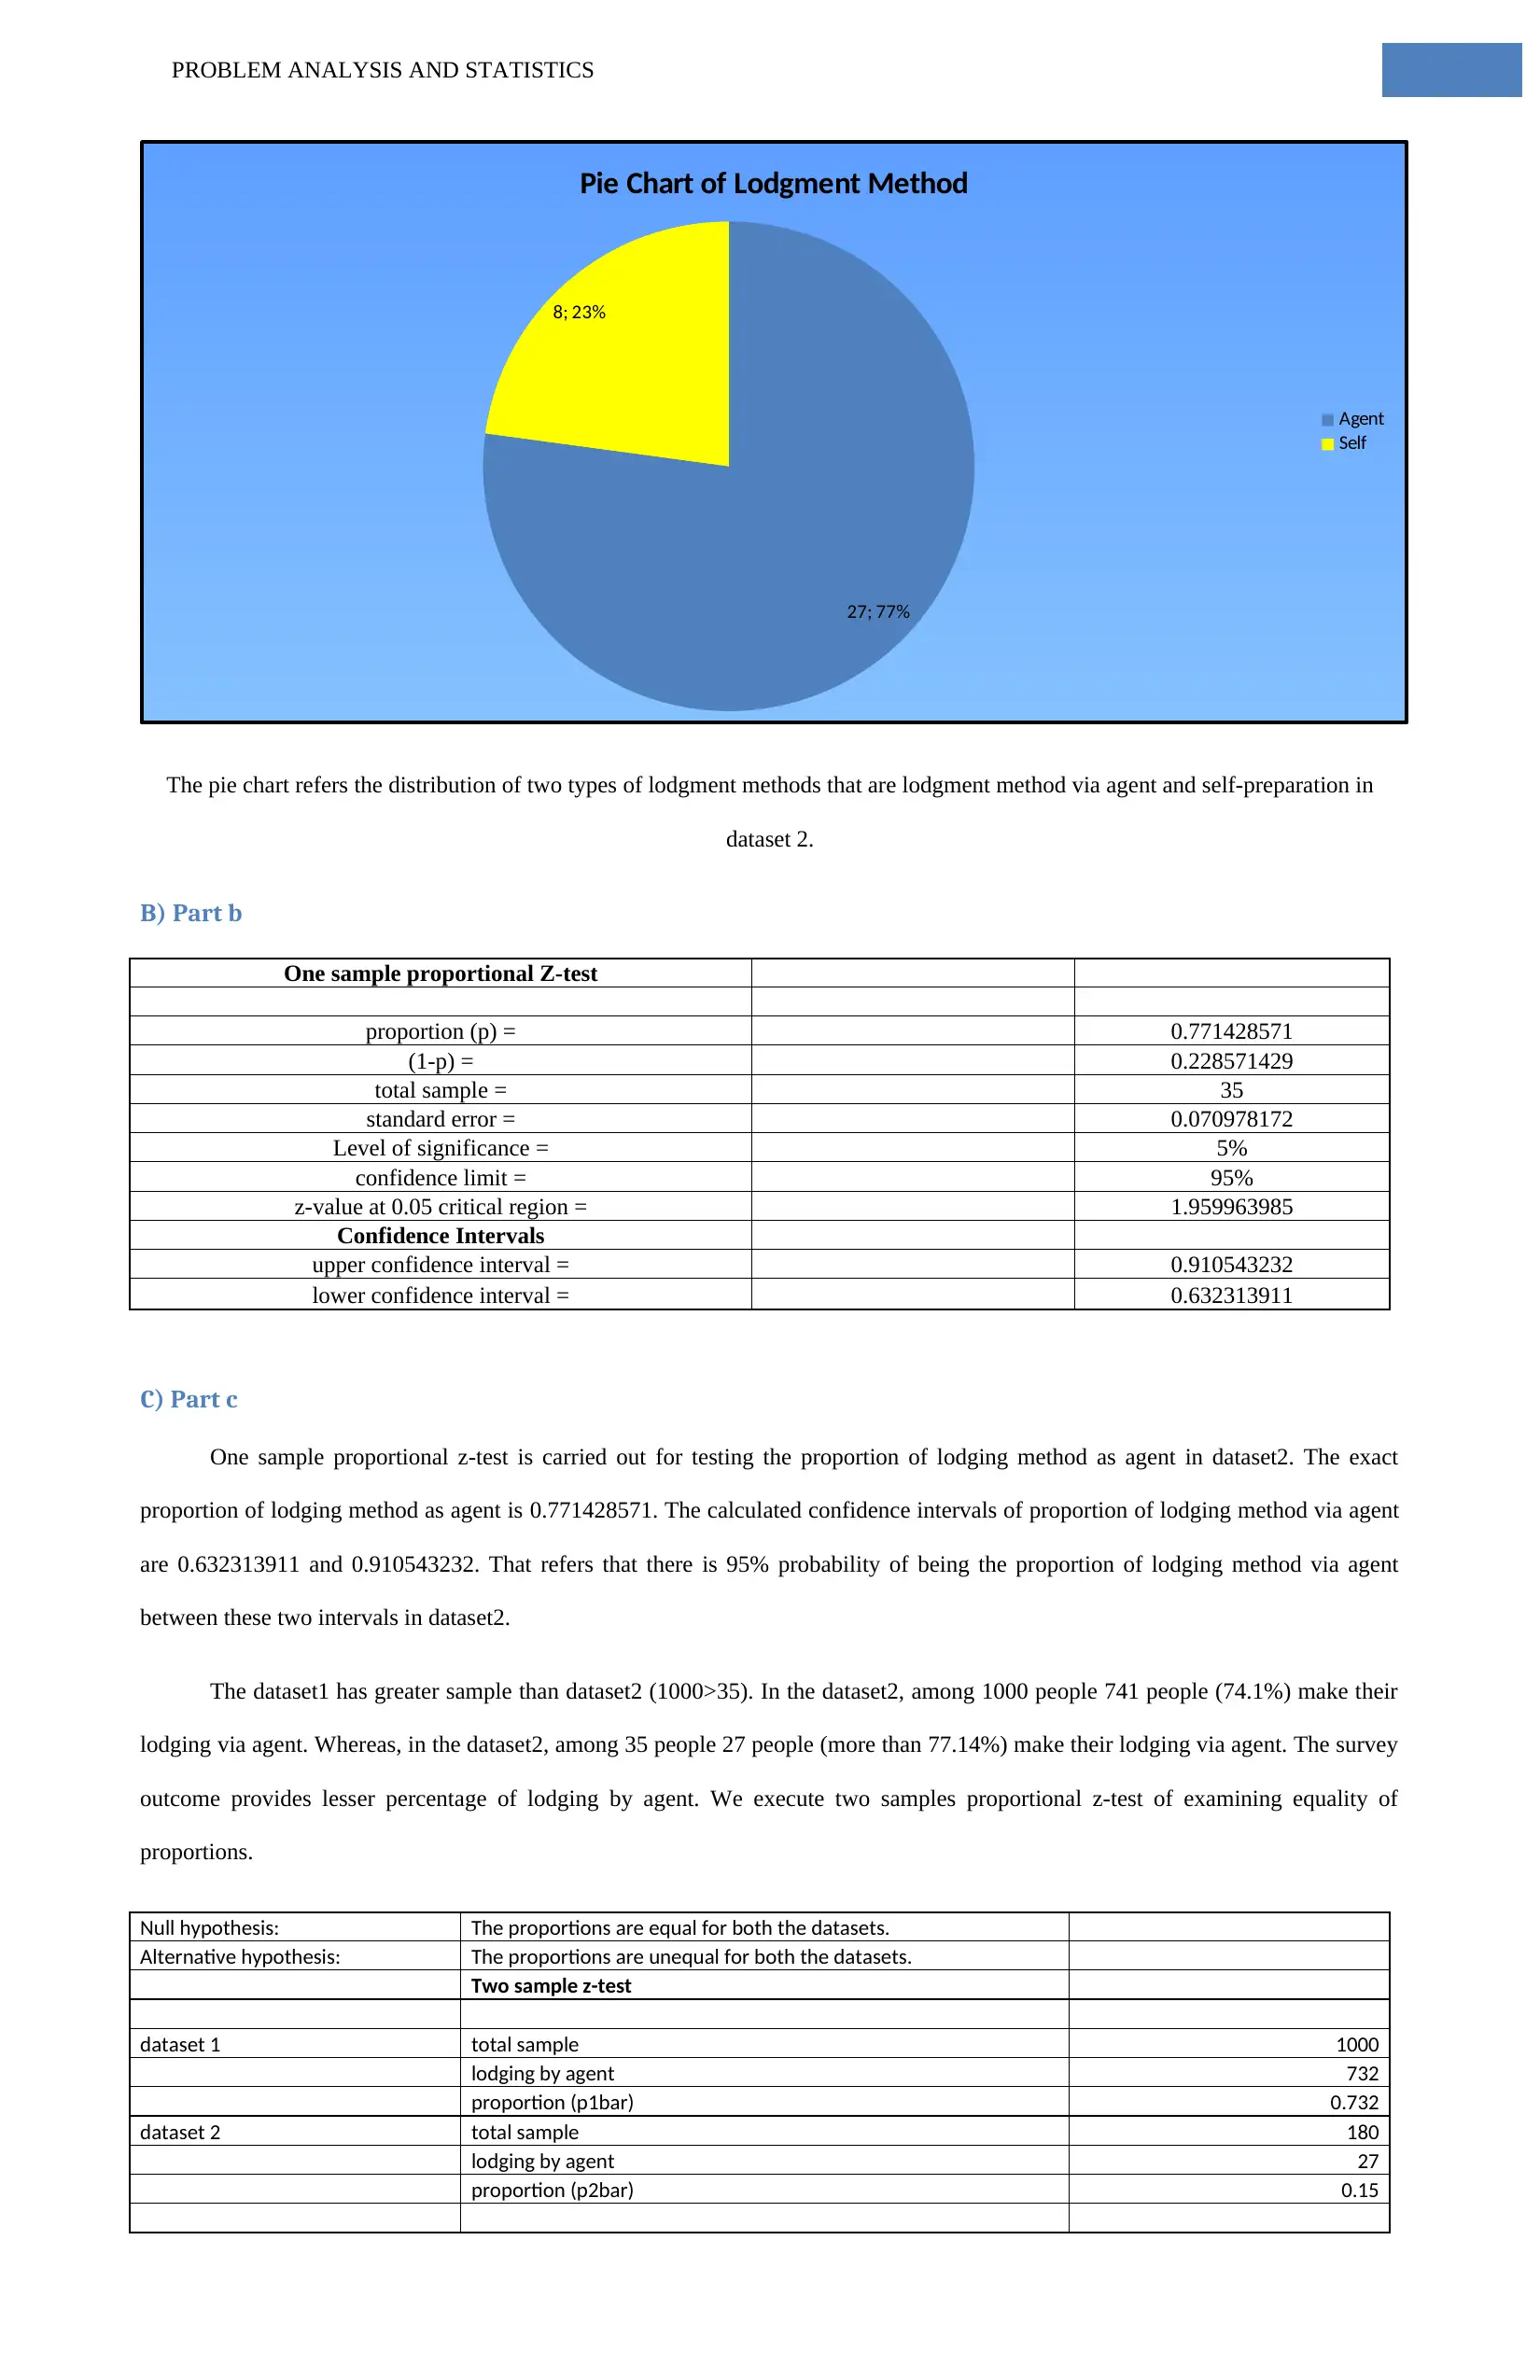
The pie chart refers the distribution of two types of lodgment methods that are lodgment method via agent and self-preparation in
dataset 2.
B) Part b
One sample proportional Z-test
proportion (p) = 0.771428571
(1-p) = 0.228571429
total sample = 35
standard error = 0.070978172
Level of significance = 5%
confidence limit = 95%
z-value at 0.05 critical region = 1.959963985
Confidence Intervals
upper confidence interval = 0.910543232
lower confidence interval = 0.632313911
C) Part c
One sample proportional z-test is carried out for testing the proportion of lodging method as agent in dataset2. The exact
proportion of lodging method as agent is 0.771428571. The calculated confidence intervals of proportion of lodging method via agent
are 0.632313911 and 0.910543232. That refers that there is 95% probability of being the proportion of lodging method via agent
between these two intervals in dataset2.
The dataset1 has greater sample than dataset2 (1000>35). In the dataset2, among 1000 people 741 people (74.1%) make their
lodging via agent. Whereas, in the dataset2, among 35 people 27 people (more than 77.14%) make their lodging via agent. The survey
outcome provides lesser percentage of lodging by agent. We execute two samples proportional z-test of examining equality of
proportions.
Null hypothesis: The proportions are equal for both the datasets.
Alternative hypothesis: The proportions are unequal for both the datasets.
Two sample z-test
dataset 1 total sample 1000
lodging by agent 732
proportion (p1bar) 0.732
dataset 2 total sample 180
lodging by agent 27
proportion (p2bar) 0.15
27; 77%
8; 23%
Pie Chart of Lodgment Method
Agent
Self
The pie chart refers the distribution of two types of lodgment methods that are lodgment method via agent and self-preparation in
dataset 2.
B) Part b
One sample proportional Z-test
proportion (p) = 0.771428571
(1-p) = 0.228571429
total sample = 35
standard error = 0.070978172
Level of significance = 5%
confidence limit = 95%
z-value at 0.05 critical region = 1.959963985
Confidence Intervals
upper confidence interval = 0.910543232
lower confidence interval = 0.632313911
C) Part c
One sample proportional z-test is carried out for testing the proportion of lodging method as agent in dataset2. The exact
proportion of lodging method as agent is 0.771428571. The calculated confidence intervals of proportion of lodging method via agent
are 0.632313911 and 0.910543232. That refers that there is 95% probability of being the proportion of lodging method via agent
between these two intervals in dataset2.
The dataset1 has greater sample than dataset2 (1000>35). In the dataset2, among 1000 people 741 people (74.1%) make their
lodging via agent. Whereas, in the dataset2, among 35 people 27 people (more than 77.14%) make their lodging via agent. The survey
outcome provides lesser percentage of lodging by agent. We execute two samples proportional z-test of examining equality of
proportions.
Null hypothesis: The proportions are equal for both the datasets.
Alternative hypothesis: The proportions are unequal for both the datasets.
Two sample z-test
dataset 1 total sample 1000
lodging by agent 732
proportion (p1bar) 0.732
dataset 2 total sample 180
lodging by agent 27
proportion (p2bar) 0.15
PROBLEM ANALYSIS AND STATISTICS
total sample 1180
total lodging by agent 759
total proportion (p-bar) 0.643220339
numerator of z-statistic (p1bar - p2bar) 0.582
pbar* (1-pbar) 0.229487935
propotion*sample 0.001504421
denominator of z-statistic SQRT(proprtion*sample) 0.038786865
z-statistic 15.00507965
p-value 0.15386
Decision-making Null hypothesis accepted
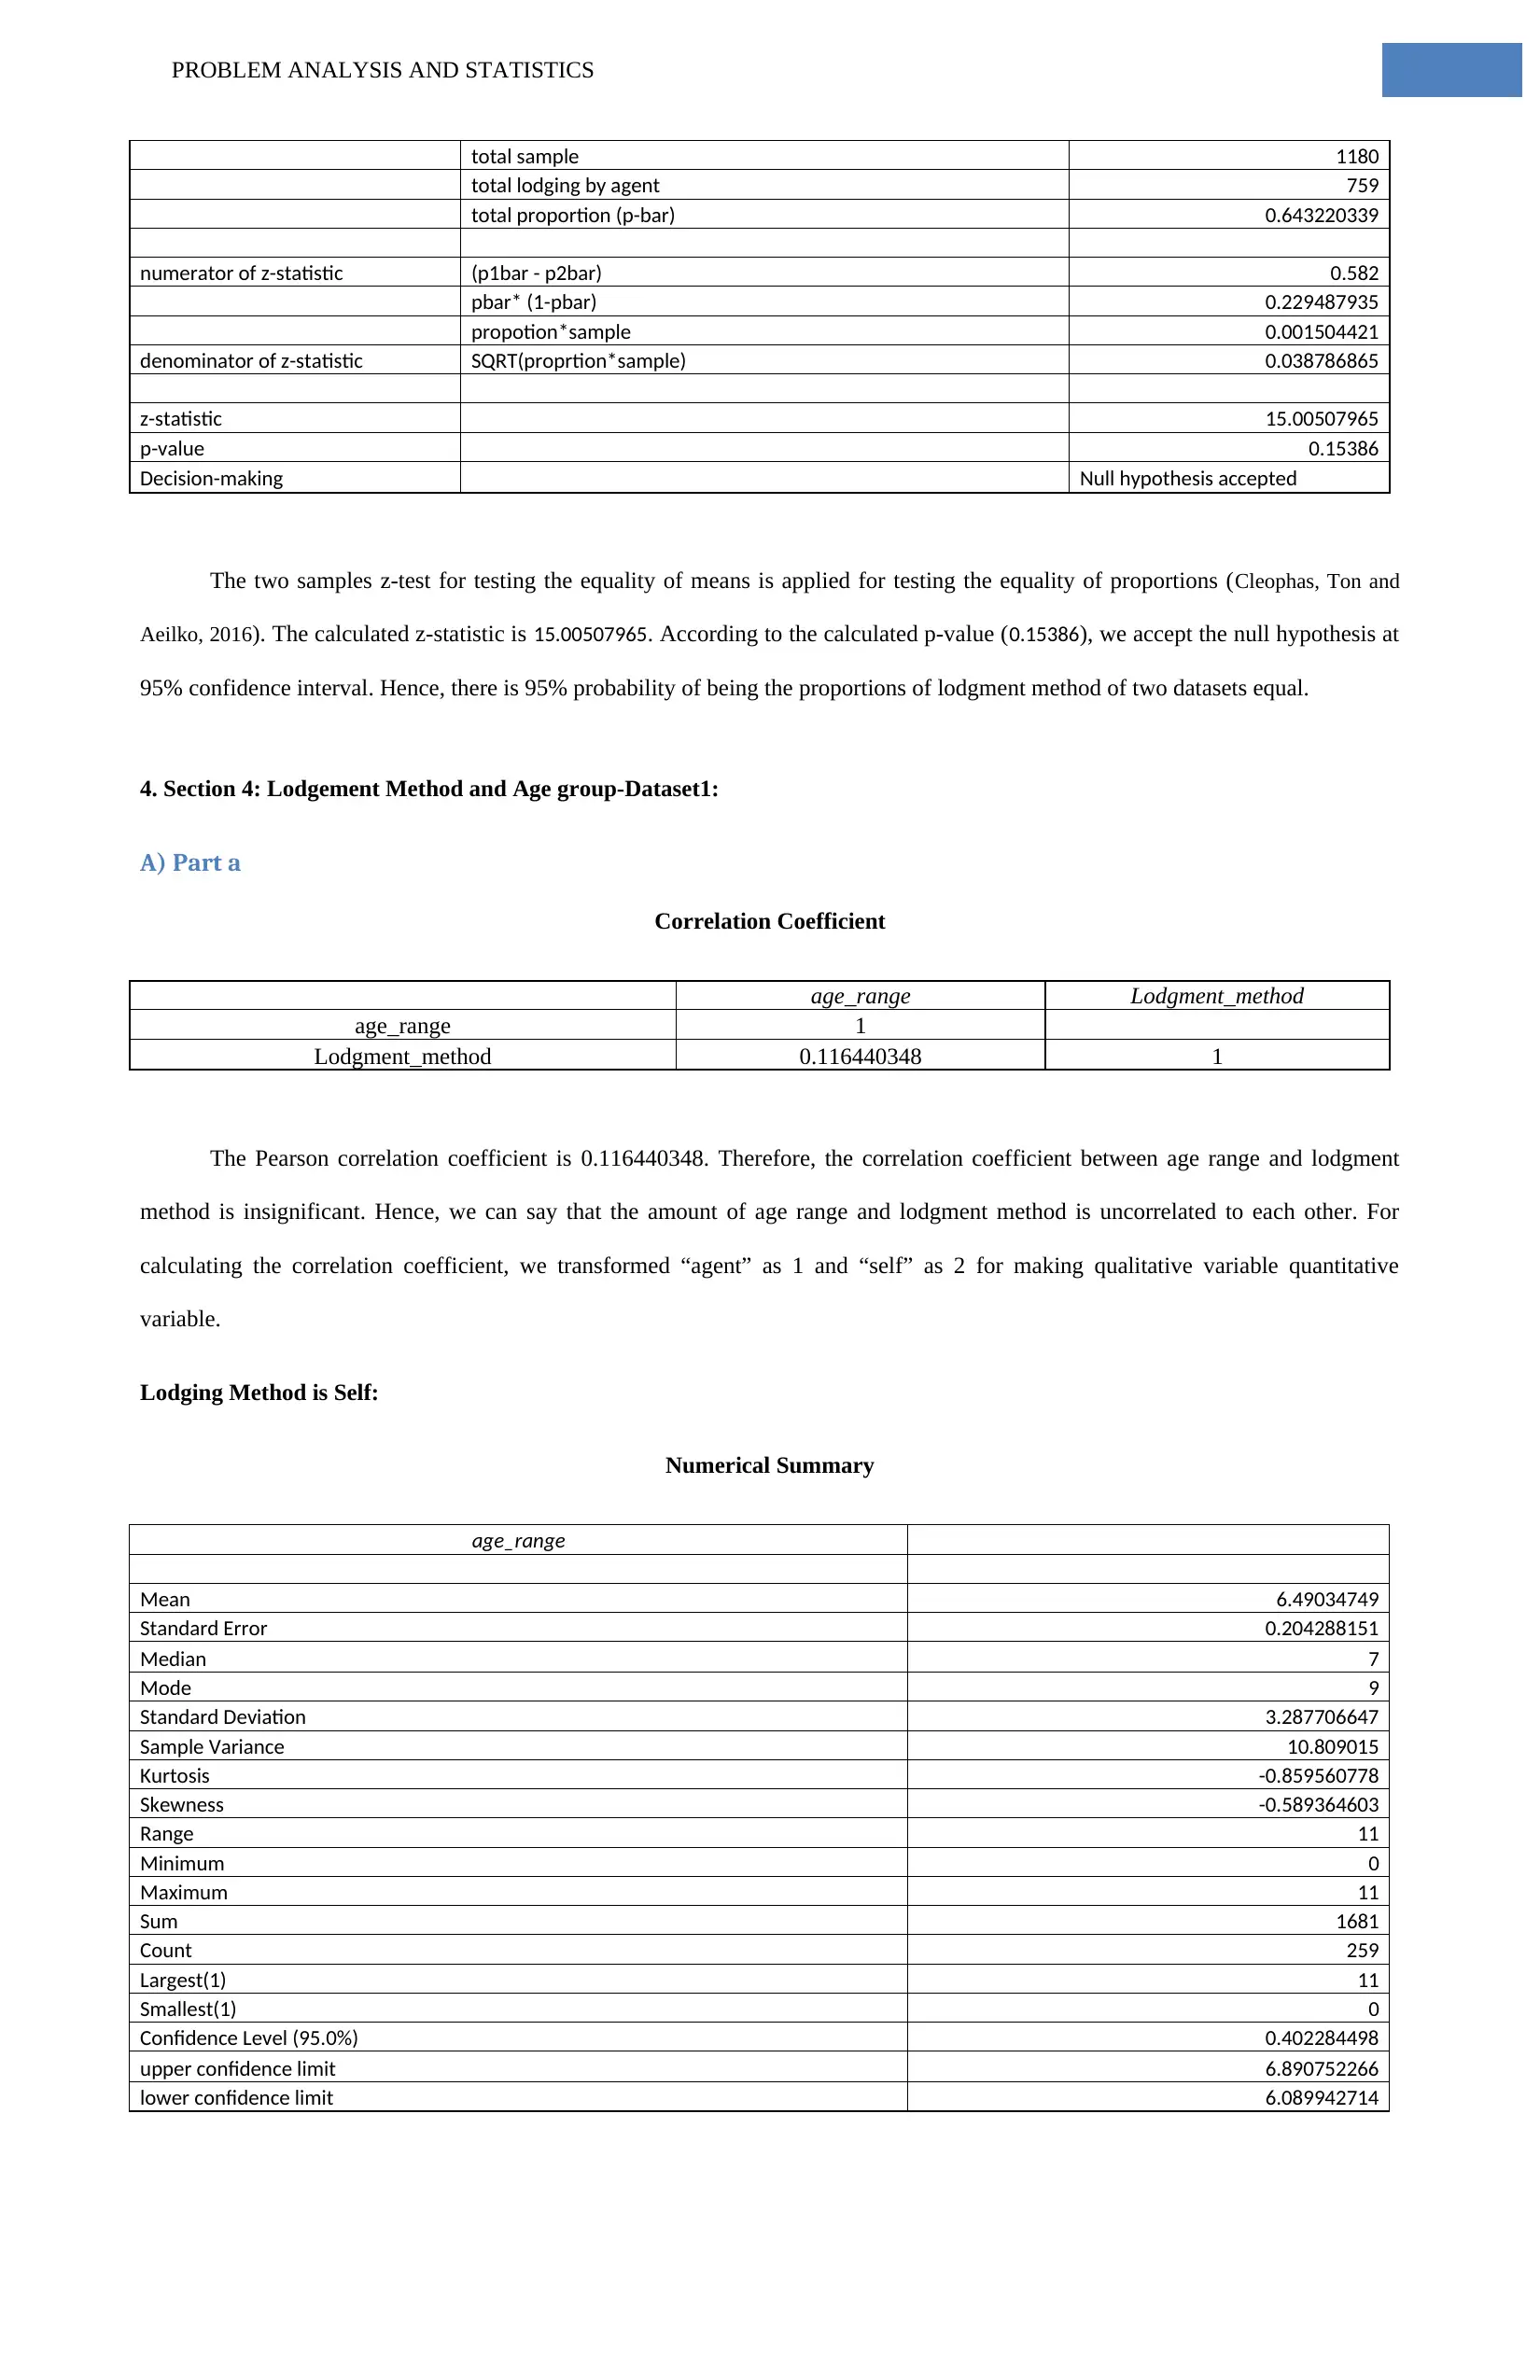
The two samples z-test for testing the equality of means is applied for testing the equality of proportions (Cleophas, Ton and
Aeilko, 2016). The calculated z-statistic is 15.00507965. According to the calculated p-value (0.15386), we accept the null hypothesis at
95% confidence interval. Hence, there is 95% probability of being the proportions of lodgment method of two datasets equal.
4. Section 4: Lodgement Method and Age group-Dataset1:
A) Part a
Correlation Coefficient
age_range Lodgment_method
age_range 1
Lodgment_method 0.116440348 1
The Pearson correlation coefficient is 0.116440348. Therefore, the correlation coefficient between age range and lodgment
method is insignificant. Hence, we can say that the amount of age range and lodgment method is uncorrelated to each other. For
calculating the correlation coefficient, we transformed “agent” as 1 and “self” as 2 for making qualitative variable quantitative
variable.
Lodging Method is Self:
Numerical Summary
age_range
Mean 6.49034749
Standard Error 0.204288151
Median 7
Mode 9
Standard Deviation 3.287706647
Sample Variance 10.809015
Kurtosis -0.859560778
Skewness -0.589364603
Range 11
Minimum 0
Maximum 11
Sum 1681
Count 259
Largest(1) 11
Smallest(1) 0
Confidence Level (95.0%) 0.402284498
upper confidence limit 6.890752266
lower confidence limit 6.089942714
total sample 1180
total lodging by agent 759
total proportion (p-bar) 0.643220339
numerator of z-statistic (p1bar - p2bar) 0.582
pbar* (1-pbar) 0.229487935
propotion*sample 0.001504421
denominator of z-statistic SQRT(proprtion*sample) 0.038786865
z-statistic 15.00507965
p-value 0.15386
Decision-making Null hypothesis accepted
The two samples z-test for testing the equality of means is applied for testing the equality of proportions (Cleophas, Ton and
Aeilko, 2016). The calculated z-statistic is 15.00507965. According to the calculated p-value (0.15386), we accept the null hypothesis at
95% confidence interval. Hence, there is 95% probability of being the proportions of lodgment method of two datasets equal.
4. Section 4: Lodgement Method and Age group-Dataset1:
A) Part a
Correlation Coefficient
age_range Lodgment_method
age_range 1
Lodgment_method 0.116440348 1
The Pearson correlation coefficient is 0.116440348. Therefore, the correlation coefficient between age range and lodgment
method is insignificant. Hence, we can say that the amount of age range and lodgment method is uncorrelated to each other. For
calculating the correlation coefficient, we transformed “agent” as 1 and “self” as 2 for making qualitative variable quantitative
variable.
Lodging Method is Self:
Numerical Summary
age_range
Mean 6.49034749
Standard Error 0.204288151
Median 7
Mode 9
Standard Deviation 3.287706647
Sample Variance 10.809015
Kurtosis -0.859560778
Skewness -0.589364603
Range 11
Minimum 0
Maximum 11
Sum 1681
Count 259
Largest(1) 11
Smallest(1) 0
Confidence Level (95.0%) 0.402284498
upper confidence limit 6.890752266
lower confidence limit 6.089942714
⊘ This is a preview!⊘
Do you want full access?
Subscribe today to unlock all pages.
Trusted by 1+ million students worldwide
PROBLEM ANALYSIS AND STATISTICS
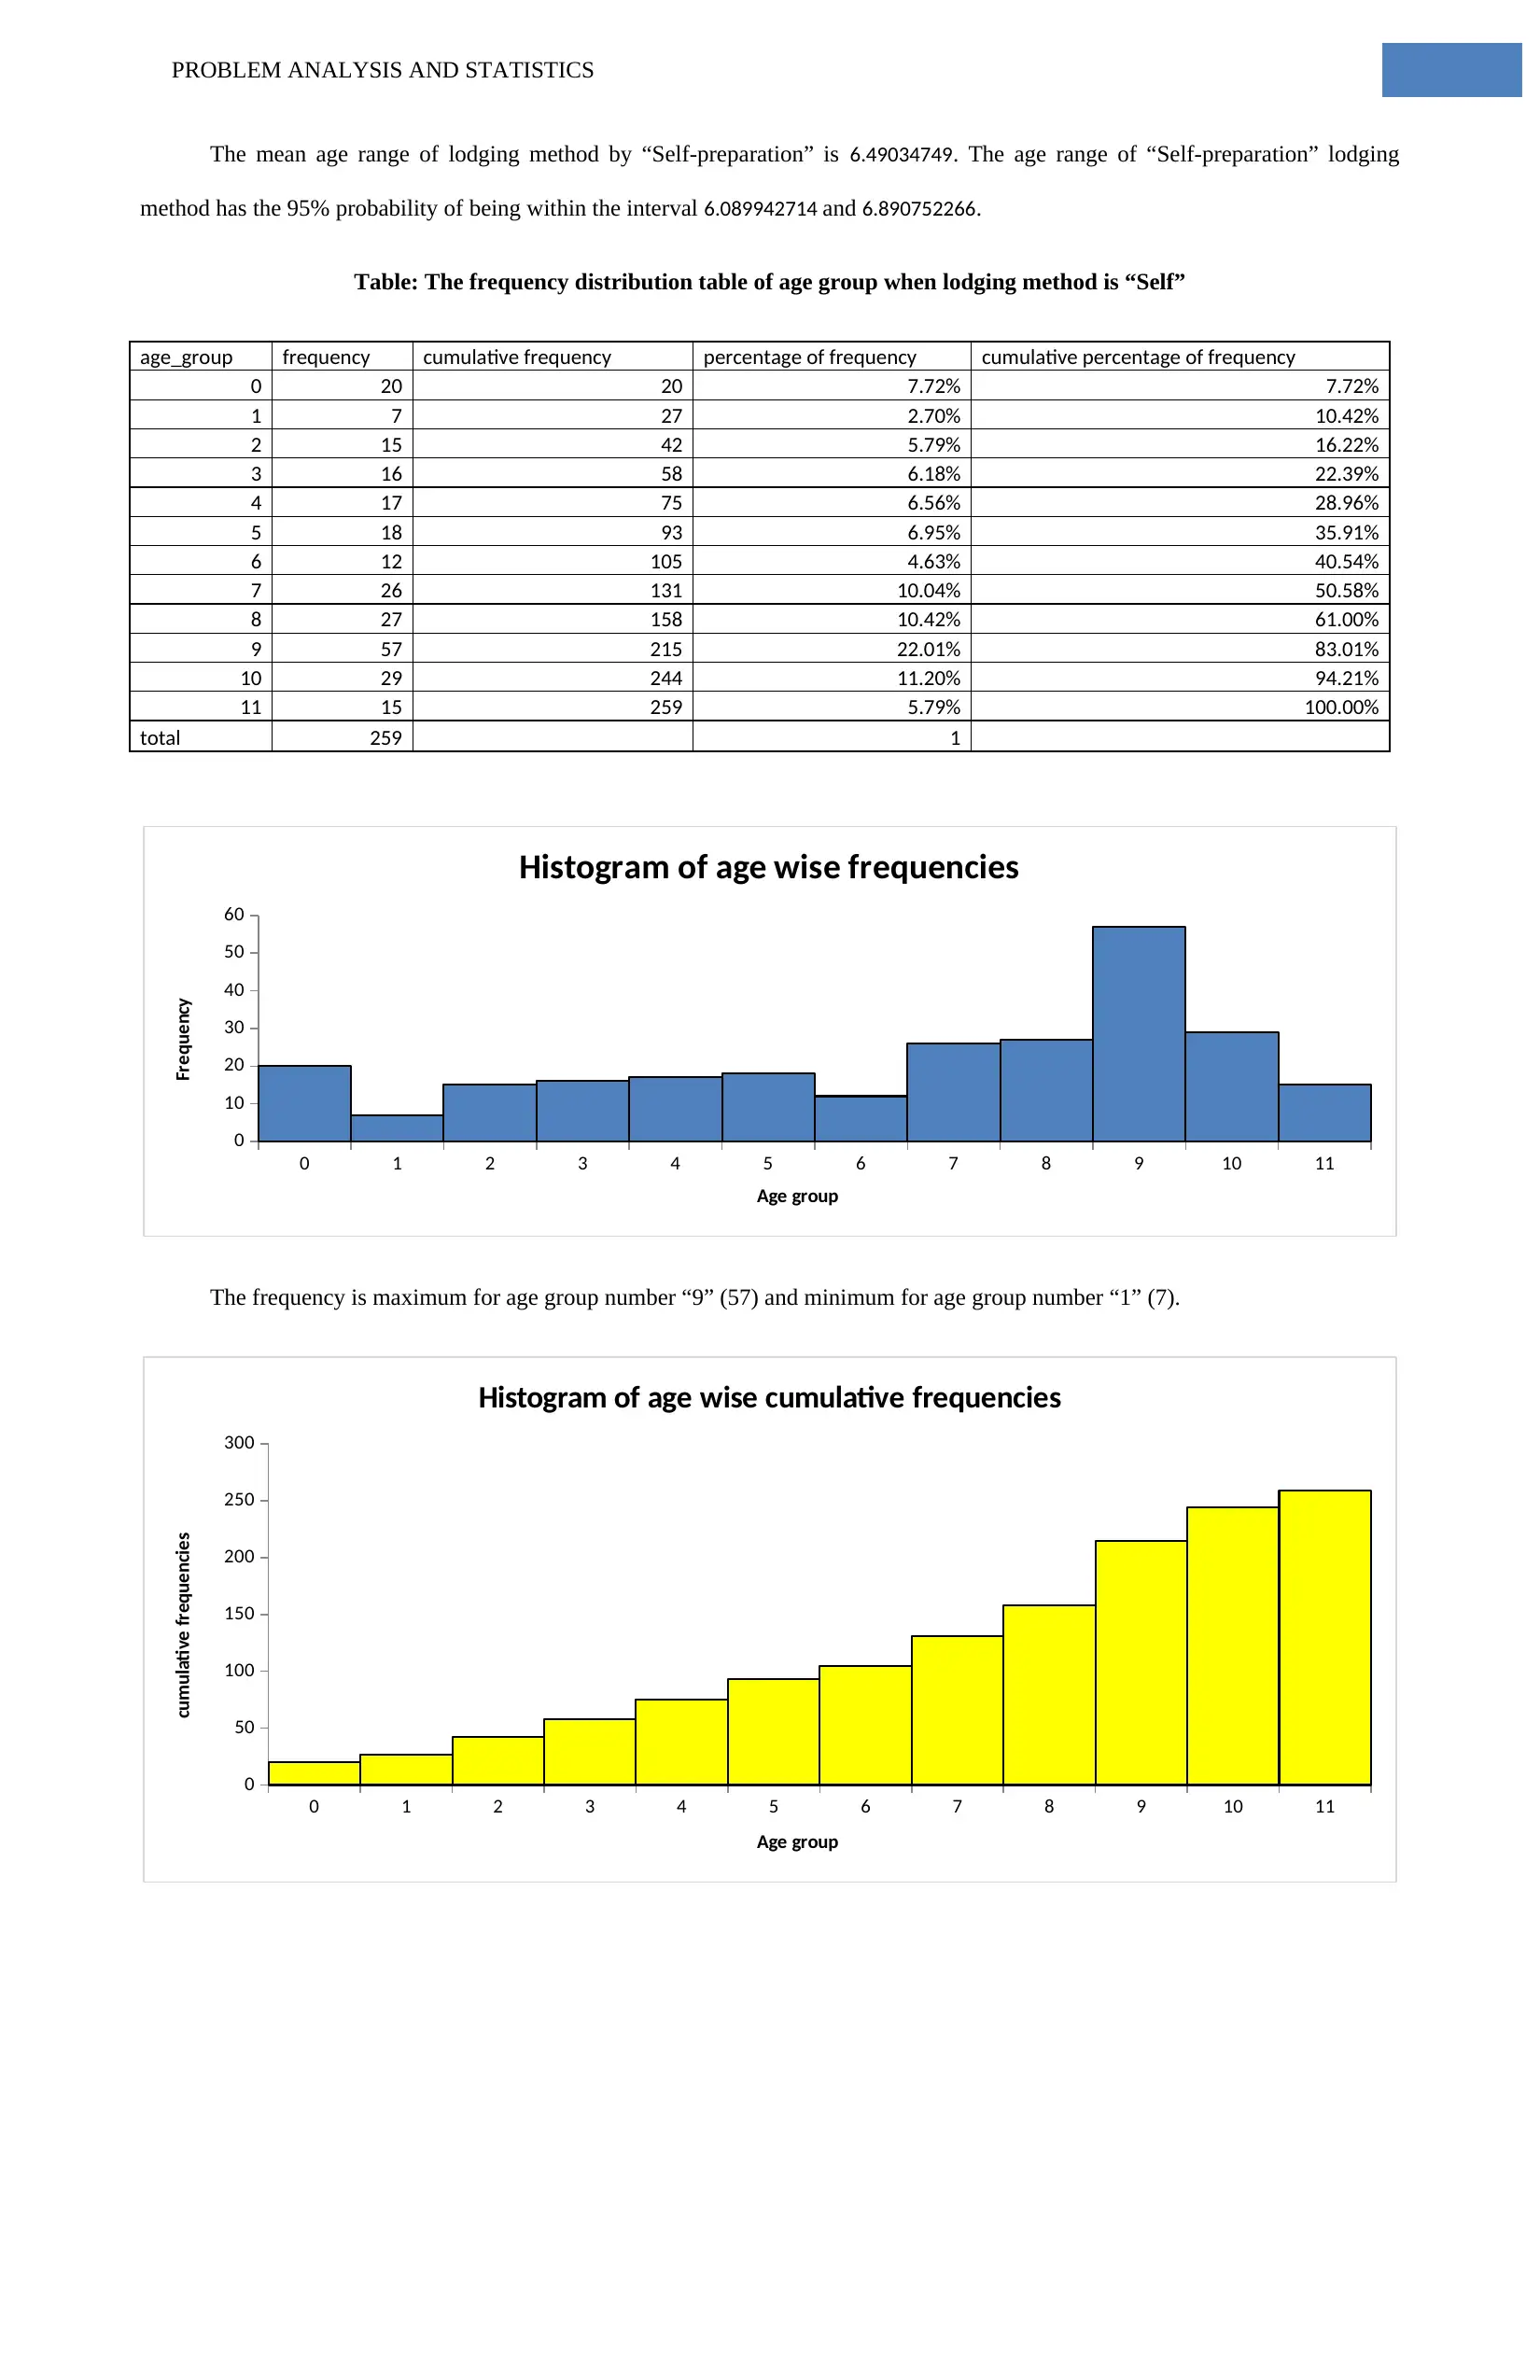
The mean age range of lodging method by “Self-preparation” is 6.49034749. The age range of “Self-preparation” lodging
method has the 95% probability of being within the interval 6.089942714 and 6.890752266.
Table: The frequency distribution table of age group when lodging method is “Self”
age_group frequency cumulative frequency percentage of frequency cumulative percentage of frequency
0 20 20 7.72% 7.72%
1 7 27 2.70% 10.42%
2 15 42 5.79% 16.22%
3 16 58 6.18% 22.39%
4 17 75 6.56% 28.96%
5 18 93 6.95% 35.91%
6 12 105 4.63% 40.54%
7 26 131 10.04% 50.58%
8 27 158 10.42% 61.00%
9 57 215 22.01% 83.01%
10 29 244 11.20% 94.21%
11 15 259 5.79% 100.00%
total 259 1
0 1 2 3 4 5 6 7 8 9 10 11
0
10
20
30
40
50
60
Histogram of age wise frequencies
Age group
Frequency
The frequency is maximum for age group number “9” (57) and minimum for age group number “1” (7).
0 1 2 3 4 5 6 7 8 9 10 11
0
50
100
150
200
250
300
Histogram of age wise cumulative frequencies
Age group
cumulative frequencies
Paraphrase This Document
Need a fresh take? Get an instant paraphrase of this document with our AI Paraphraser
PROBLEM ANALYSIS AND STATISTICS
0 1 2 3 4 5 6 7 8 9 10 11
0.00%
5.00%
10.00%
15.00%
20.00%
25.00%
Histogram of age-wise percentage of frequencies
Age group
Percentage frequency
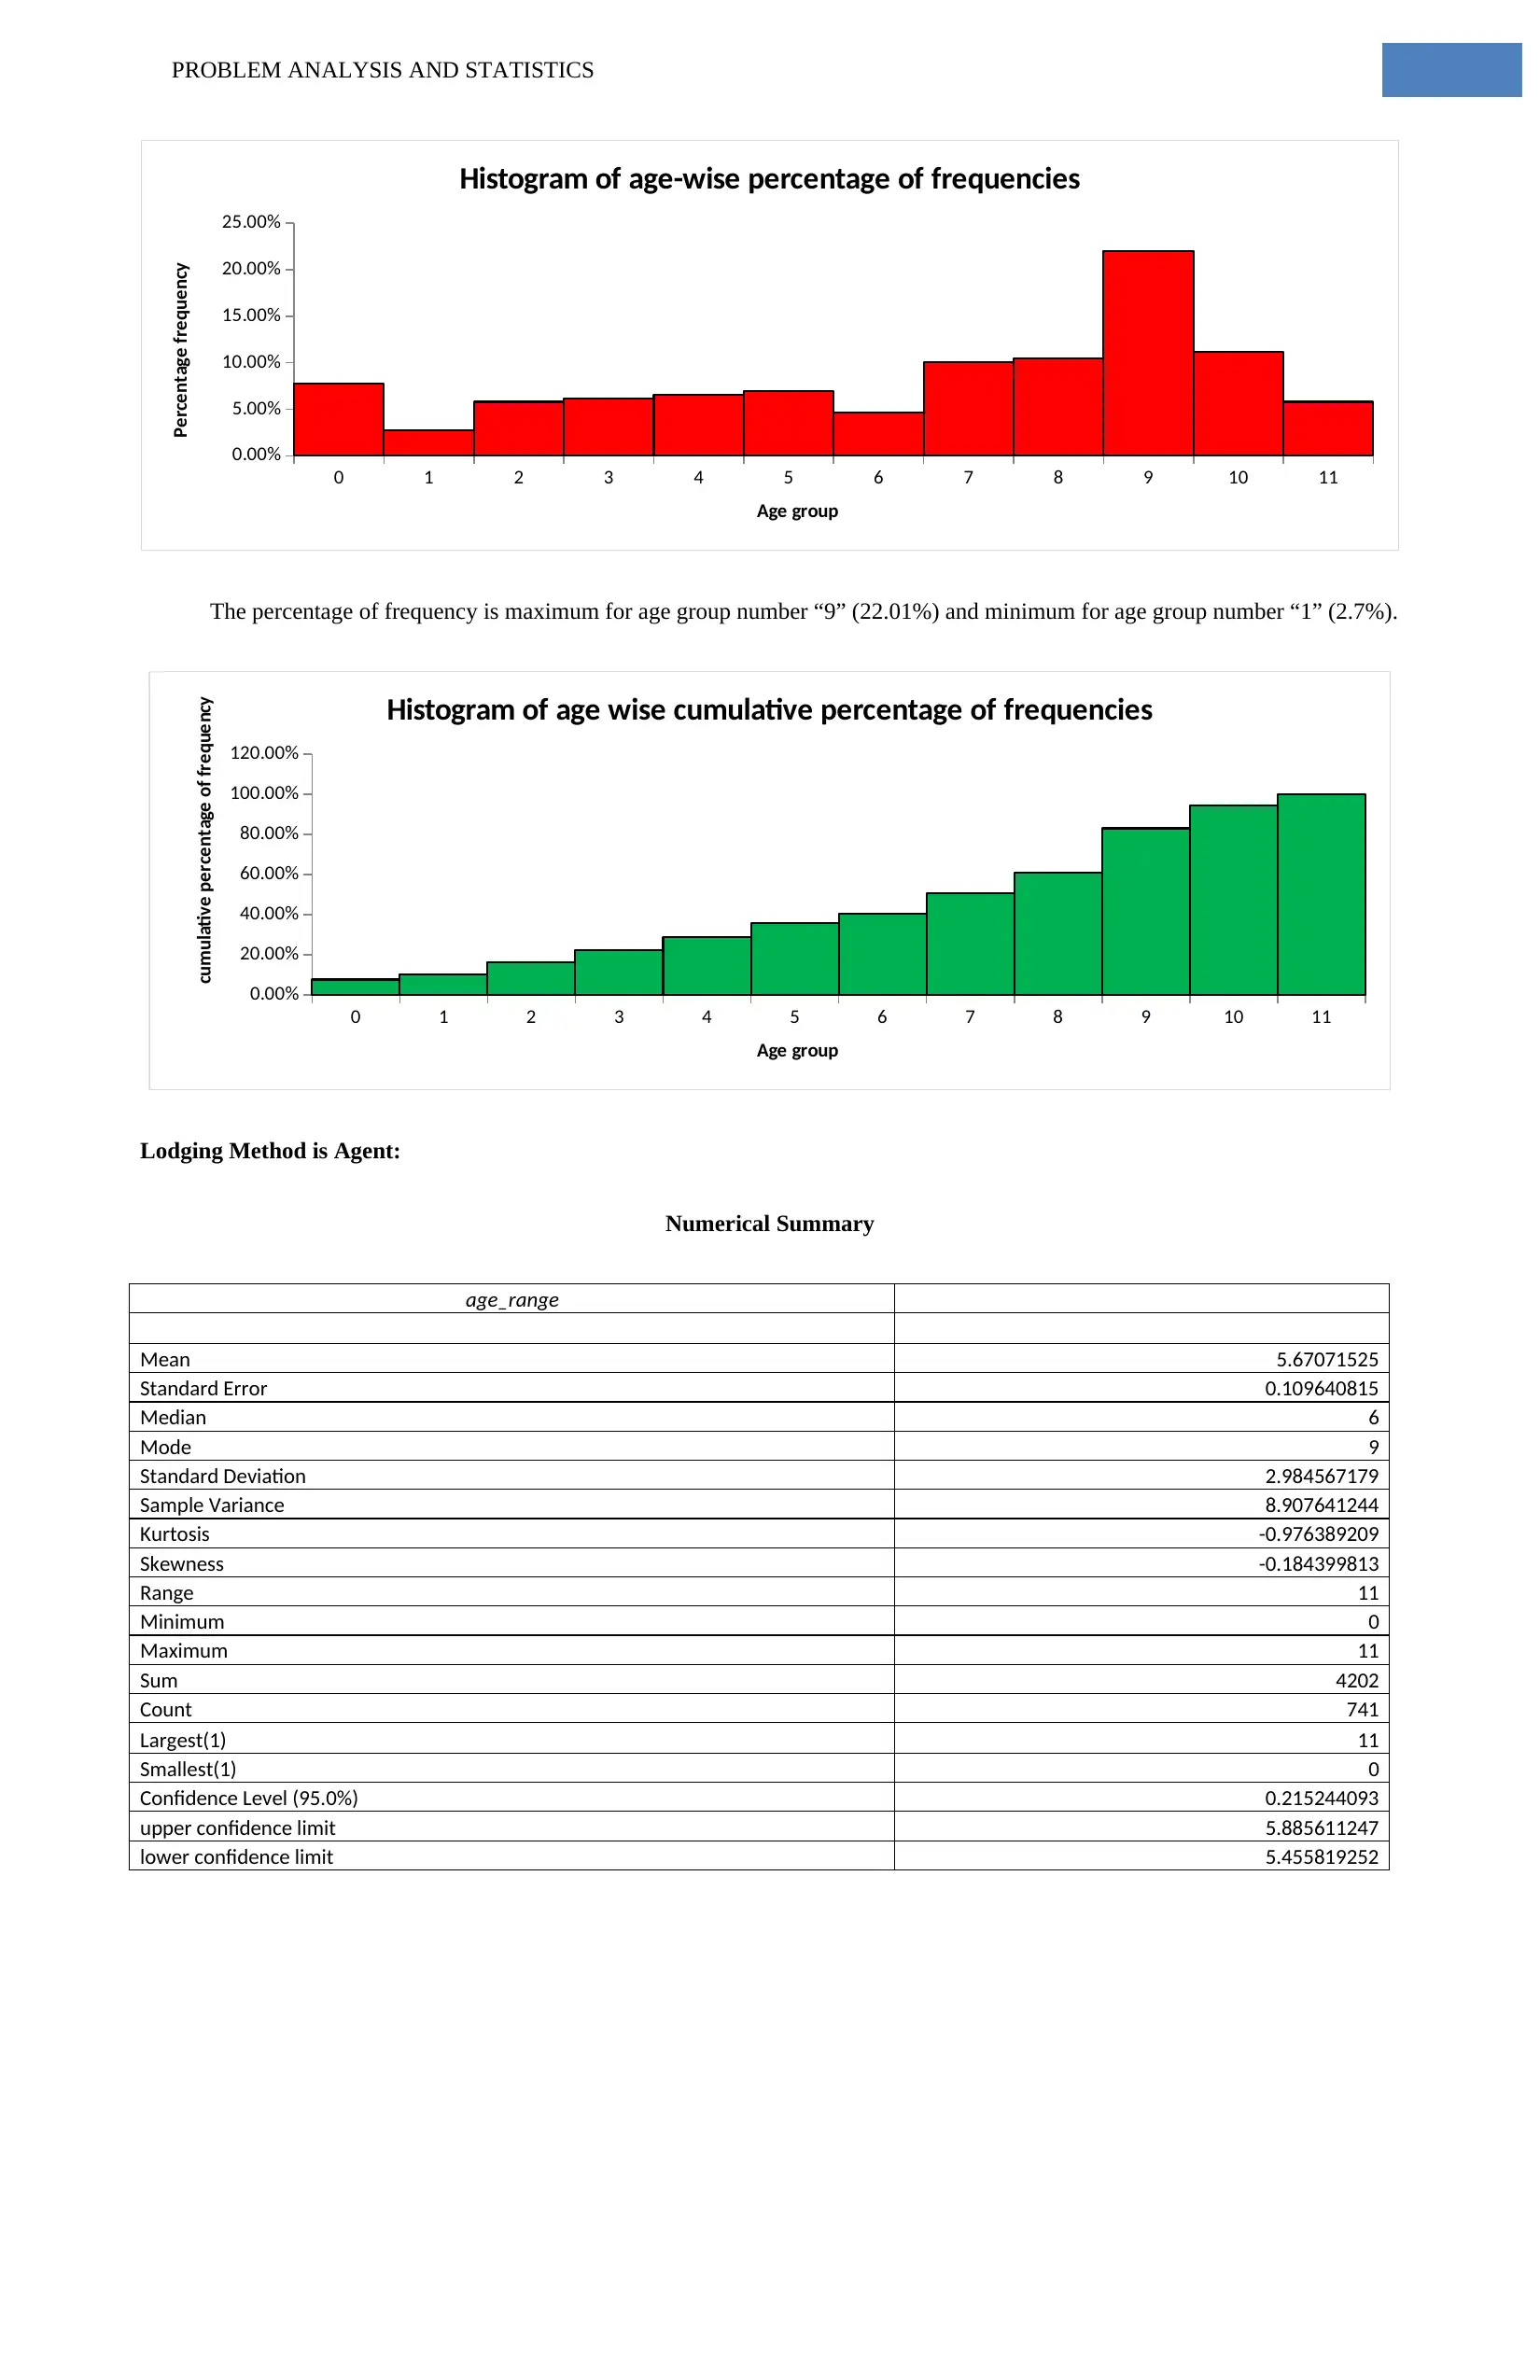
The percentage of frequency is maximum for age group number “9” (22.01%) and minimum for age group number “1” (2.7%).
0 1 2 3 4 5 6 7 8 9 10 11
0.00%
20.00%
40.00%
60.00%
80.00%
100.00%
120.00%
Histogram of age wise cumulative percentage of frequencies
Age group
cumulative percentage of frequency
Lodging Method is Agent:
Numerical Summary
age_range
Mean 5.67071525
Standard Error 0.109640815
Median 6
Mode 9
Standard Deviation 2.984567179
Sample Variance 8.907641244
Kurtosis -0.976389209
Skewness -0.184399813
Range 11
Minimum 0
Maximum 11
Sum 4202
Count 741
Largest(1) 11
Smallest(1) 0
Confidence Level (95.0%) 0.215244093
upper confidence limit 5.885611247
lower confidence limit 5.455819252
0 1 2 3 4 5 6 7 8 9 10 11
0.00%
5.00%
10.00%
15.00%
20.00%
25.00%
Histogram of age-wise percentage of frequencies
Age group
Percentage frequency
The percentage of frequency is maximum for age group number “9” (22.01%) and minimum for age group number “1” (2.7%).
0 1 2 3 4 5 6 7 8 9 10 11
0.00%
20.00%
40.00%
60.00%
80.00%
100.00%
120.00%
Histogram of age wise cumulative percentage of frequencies
Age group
cumulative percentage of frequency
Lodging Method is Agent:
Numerical Summary
age_range
Mean 5.67071525
Standard Error 0.109640815
Median 6
Mode 9
Standard Deviation 2.984567179
Sample Variance 8.907641244
Kurtosis -0.976389209
Skewness -0.184399813
Range 11
Minimum 0
Maximum 11
Sum 4202
Count 741
Largest(1) 11
Smallest(1) 0
Confidence Level (95.0%) 0.215244093
upper confidence limit 5.885611247
lower confidence limit 5.455819252
PROBLEM ANALYSIS AND STATISTICS
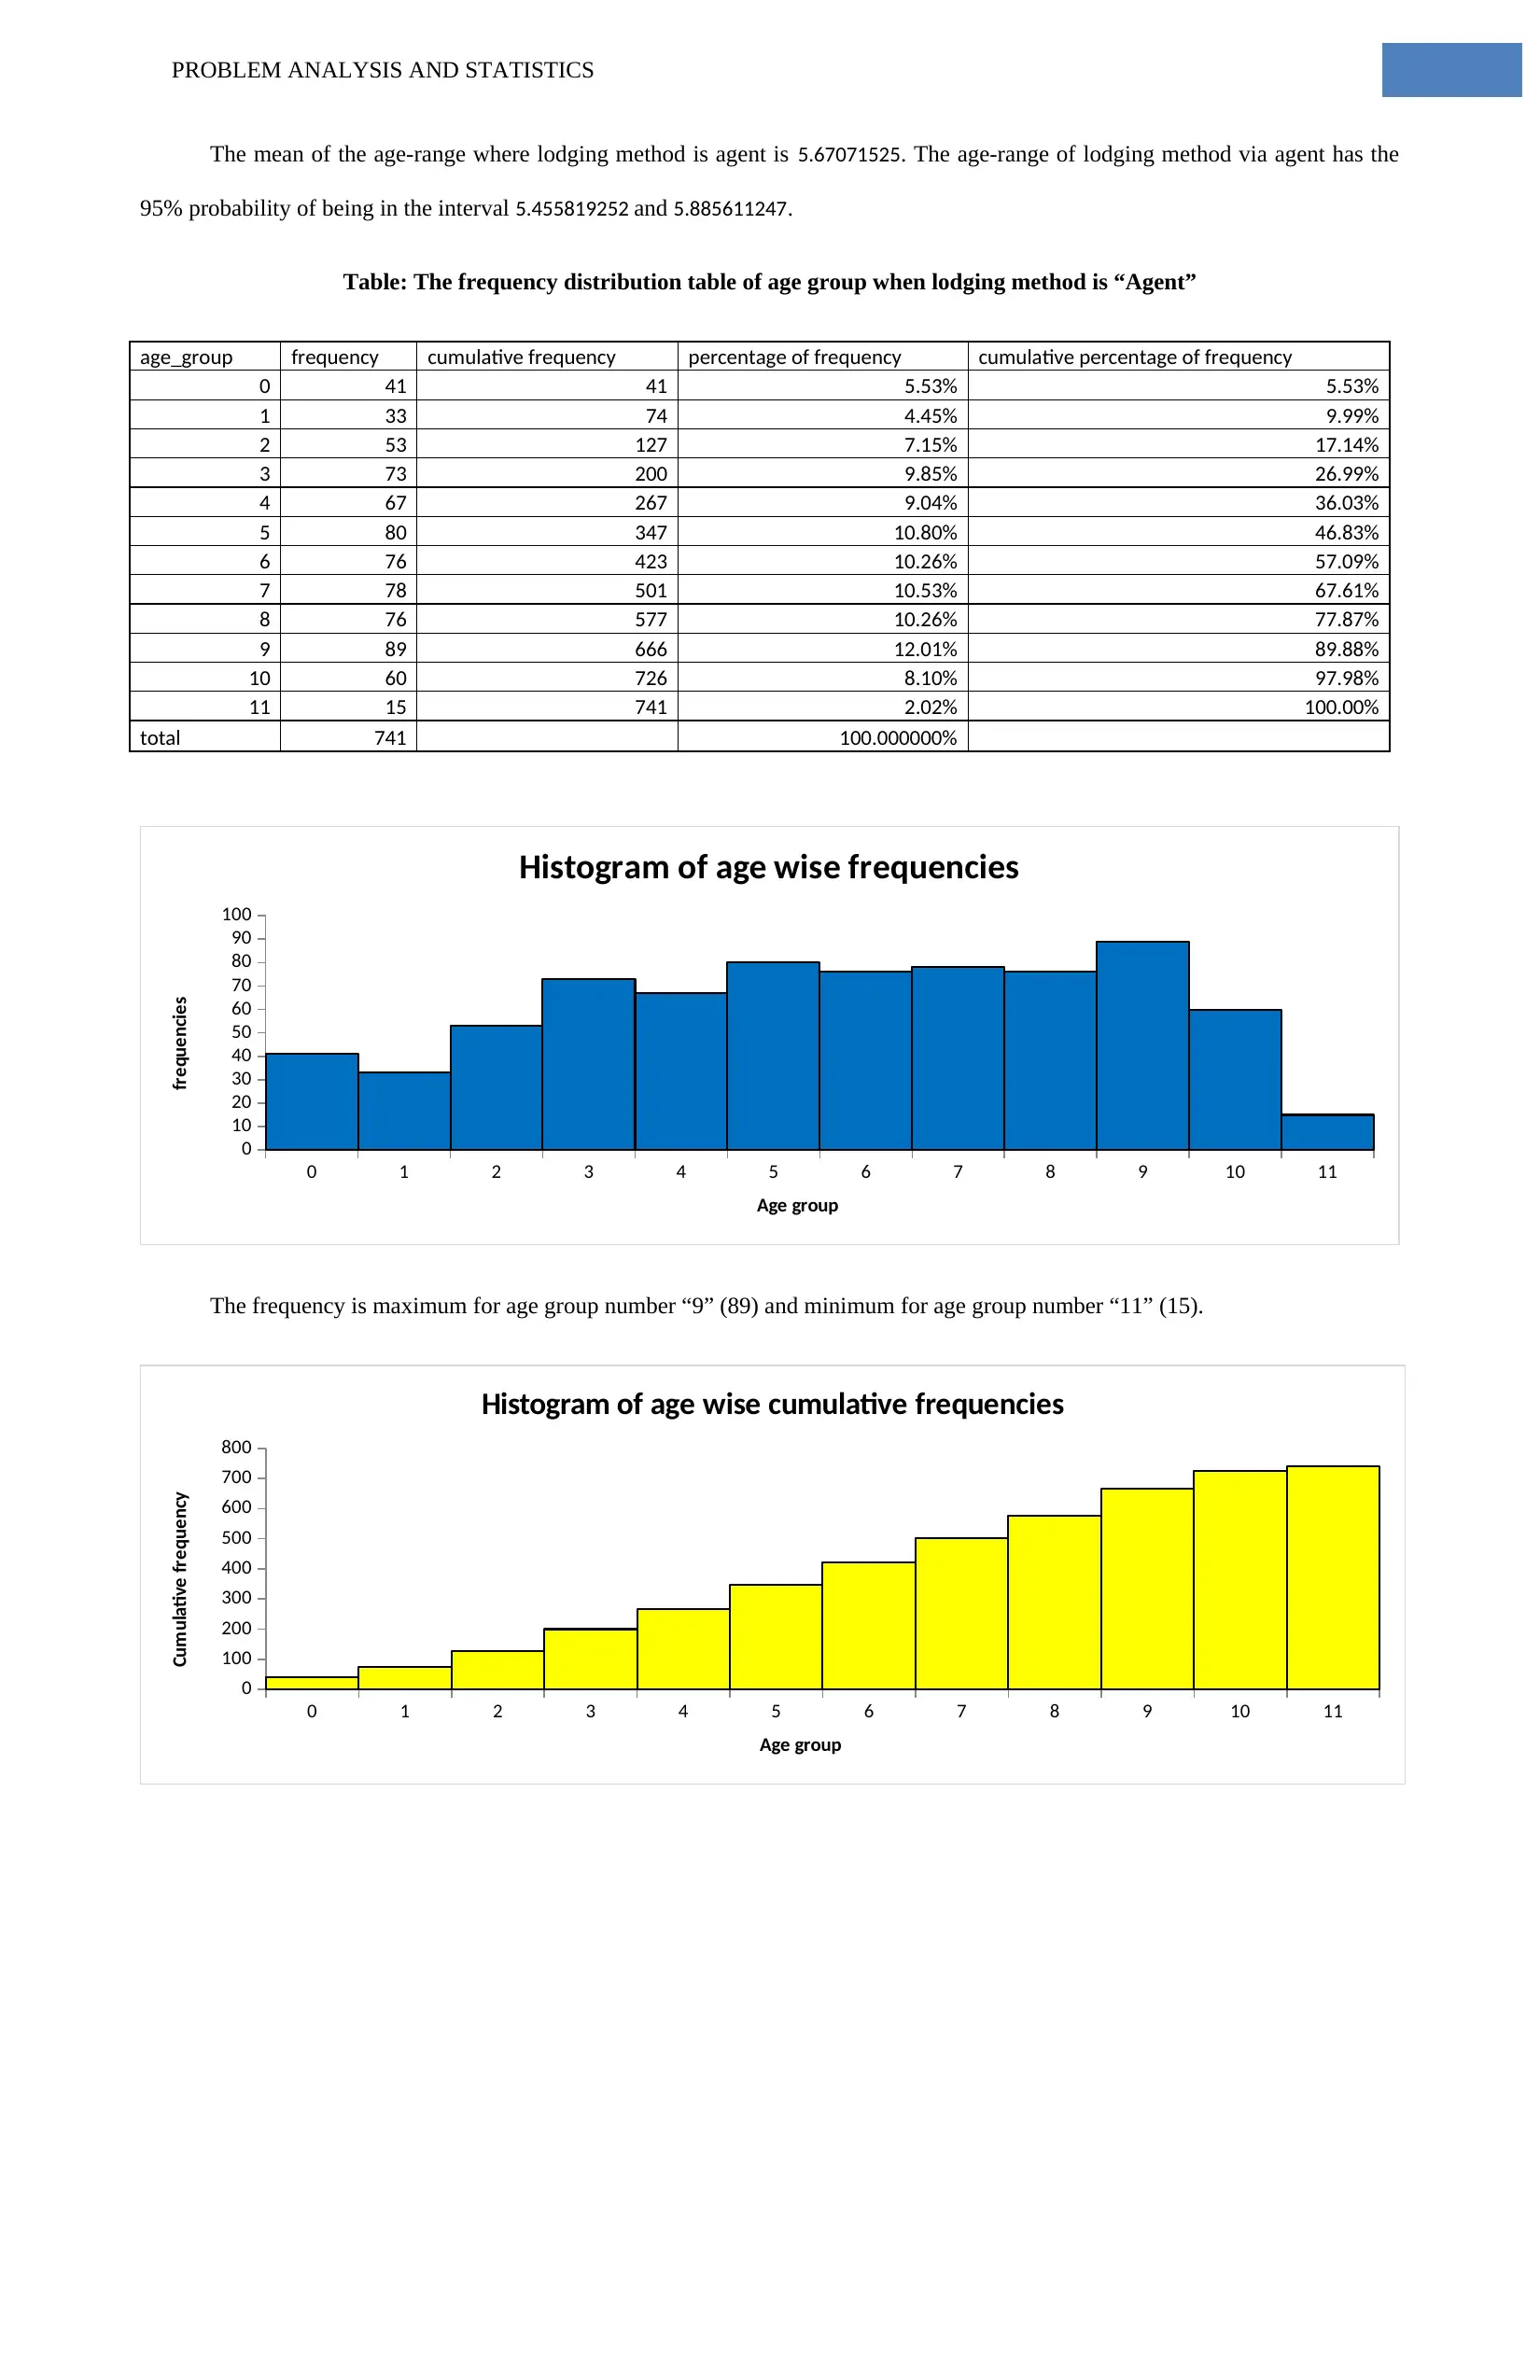
The mean of the age-range where lodging method is agent is 5.67071525. The age-range of lodging method via agent has the
95% probability of being in the interval 5.455819252 and 5.885611247.
Table: The frequency distribution table of age group when lodging method is “Agent”
age_group frequency cumulative frequency percentage of frequency cumulative percentage of frequency
0 41 41 5.53% 5.53%
1 33 74 4.45% 9.99%
2 53 127 7.15% 17.14%
3 73 200 9.85% 26.99%
4 67 267 9.04% 36.03%
5 80 347 10.80% 46.83%
6 76 423 10.26% 57.09%
7 78 501 10.53% 67.61%
8 76 577 10.26% 77.87%
9 89 666 12.01% 89.88%
10 60 726 8.10% 97.98%
11 15 741 2.02% 100.00%
total 741 100.000000%
0 1 2 3 4 5 6 7 8 9 10 11
0
10
20
30
40
50
60
70
80
90
100
Histogram of age wise frequencies
Age group
frequencies
The frequency is maximum for age group number “9” (89) and minimum for age group number “11” (15).
0 1 2 3 4 5 6 7 8 9 10 11
0
100
200
300
400
500
600
700
800
Histogram of age wise cumulative frequencies
Age group
Cumulative frequency
⊘ This is a preview!⊘
Do you want full access?
Subscribe today to unlock all pages.
Trusted by 1+ million students worldwide
PROBLEM ANALYSIS AND STATISTICS
1 2 3 4 5 6 7 8 9 10 11 12
0.00%
2.00%
4.00%
6.00%
8.00%
10.00%
12.00%
14.00%
Histogram of percentage of frequencies
Percentage of frequency
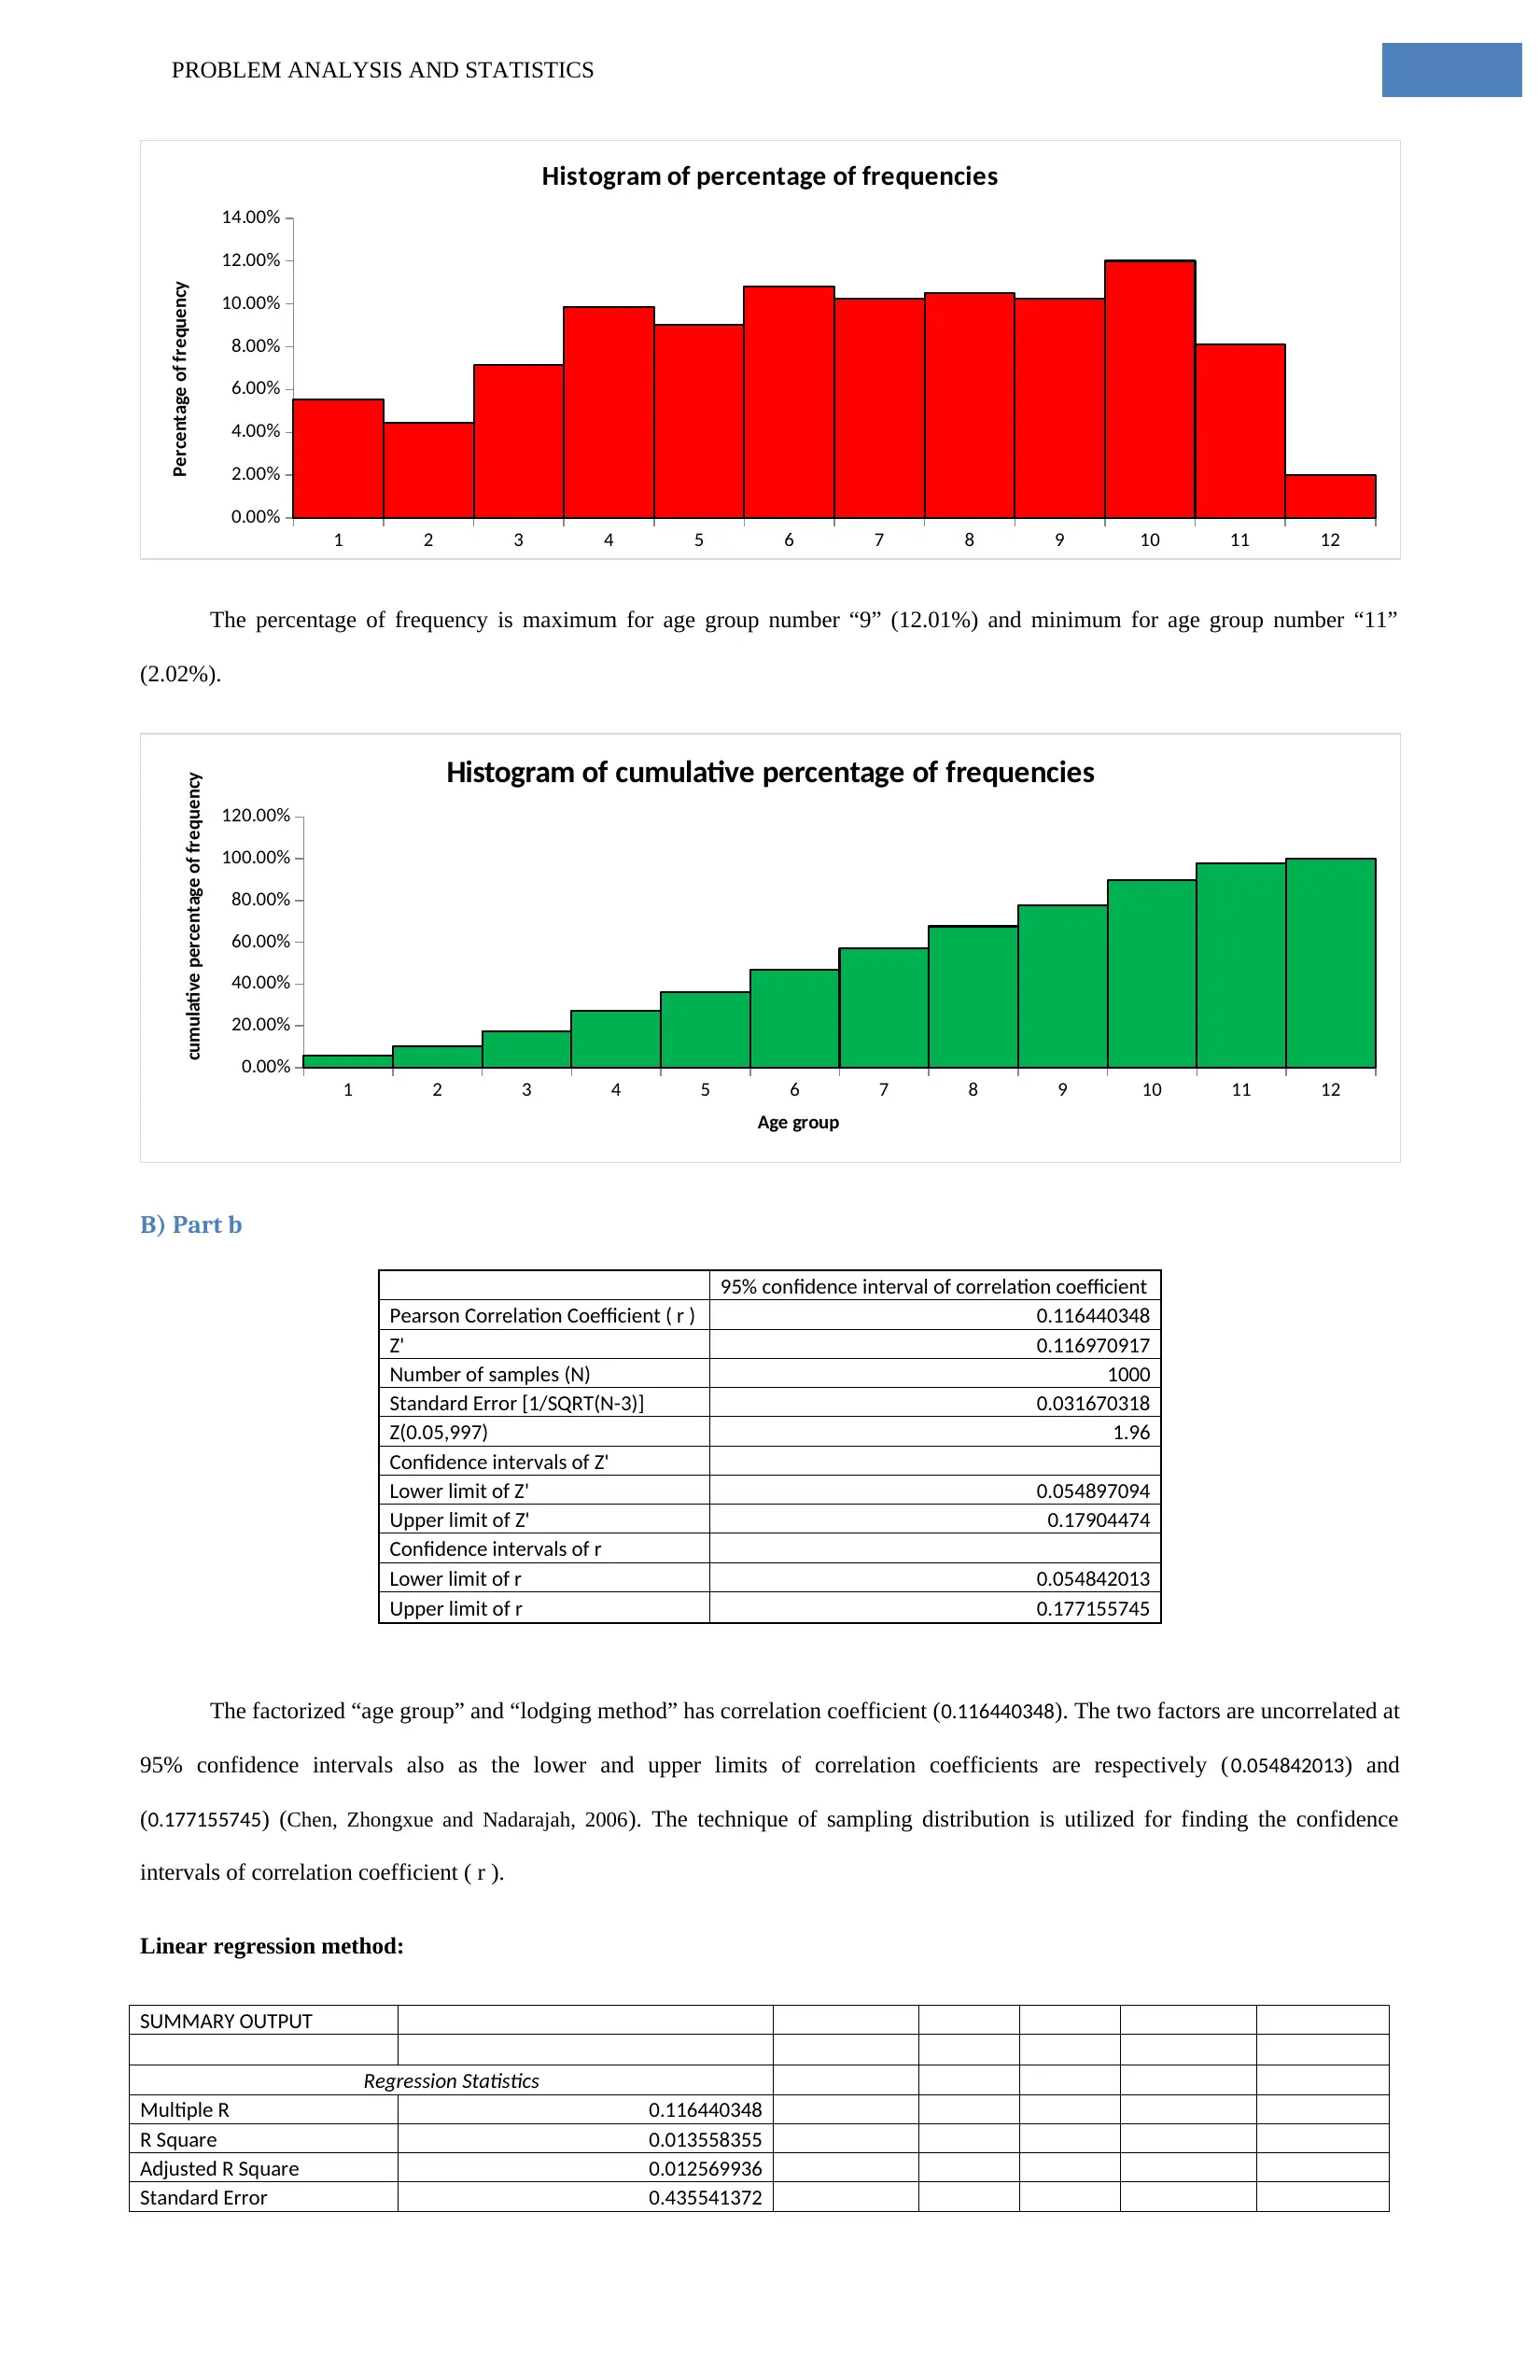
The percentage of frequency is maximum for age group number “9” (12.01%) and minimum for age group number “11”
(2.02%).
1 2 3 4 5 6 7 8 9 10 11 12
0.00%
20.00%
40.00%
60.00%
80.00%
100.00%
120.00%
Histogram of cumulative percentage of frequencies
Age group
cumulative percentage of frequency
B) Part b
95% confidence interval of correlation coefficient
Pearson Correlation Coefficient ( r ) 0.116440348
Z' 0.116970917
Number of samples (N) 1000
Standard Error [1/SQRT(N-3)] 0.031670318
Z(0.05,997) 1.96
Confidence intervals of Z'
Lower limit of Z' 0.054897094
Upper limit of Z' 0.17904474
Confidence intervals of r
Lower limit of r 0.054842013
Upper limit of r 0.177155745
The factorized “age group” and “lodging method” has correlation coefficient (0.116440348). The two factors are uncorrelated at
95% confidence intervals also as the lower and upper limits of correlation coefficients are respectively (0.054842013) and
(0.177155745) (Chen, Zhongxue and Nadarajah, 2006). The technique of sampling distribution is utilized for finding the confidence
intervals of correlation coefficient ( r ).
Linear regression method:
SUMMARY OUTPUT
Regression Statistics
Multiple R 0.116440348
R Square 0.013558355
Adjusted R Square 0.012569936
Standard Error 0.435541372
1 2 3 4 5 6 7 8 9 10 11 12
0.00%
2.00%
4.00%
6.00%
8.00%
10.00%
12.00%
14.00%
Histogram of percentage of frequencies
Percentage of frequency
The percentage of frequency is maximum for age group number “9” (12.01%) and minimum for age group number “11”
(2.02%).
1 2 3 4 5 6 7 8 9 10 11 12
0.00%
20.00%
40.00%
60.00%
80.00%
100.00%
120.00%
Histogram of cumulative percentage of frequencies
Age group
cumulative percentage of frequency
B) Part b
95% confidence interval of correlation coefficient
Pearson Correlation Coefficient ( r ) 0.116440348
Z' 0.116970917
Number of samples (N) 1000
Standard Error [1/SQRT(N-3)] 0.031670318
Z(0.05,997) 1.96
Confidence intervals of Z'
Lower limit of Z' 0.054897094
Upper limit of Z' 0.17904474
Confidence intervals of r
Lower limit of r 0.054842013
Upper limit of r 0.177155745
The factorized “age group” and “lodging method” has correlation coefficient (0.116440348). The two factors are uncorrelated at
95% confidence intervals also as the lower and upper limits of correlation coefficients are respectively (0.054842013) and
(0.177155745) (Chen, Zhongxue and Nadarajah, 2006). The technique of sampling distribution is utilized for finding the confidence
intervals of correlation coefficient ( r ).
Linear regression method:
SUMMARY OUTPUT
Regression Statistics
Multiple R 0.116440348
R Square 0.013558355
Adjusted R Square 0.012569936
Standard Error 0.435541372
Paraphrase This Document
Need a fresh take? Get an instant paraphrase of this document with our AI Paraphraser
PROBLEM ANALYSIS AND STATISTICS
Observations 1000
ANOVA
df SS MS F
Significance
F
Regression 1 2.602105853
2.60210
6
13.7172
2 0.000224148
Residual 998 189.3168941
0.18969
6
Total 999 191.919
Coefficients
Standard
Error t Stat P-value Lower 95% Upper 95%
Intercept 1.161683428 0.029666596
39.1579
6 6.4E-204 1.103467367
1.21989948
9
age_range 0.016541998 0.004466372
3.70367
7
0.00022
4 0.00777744
0.02530655
5
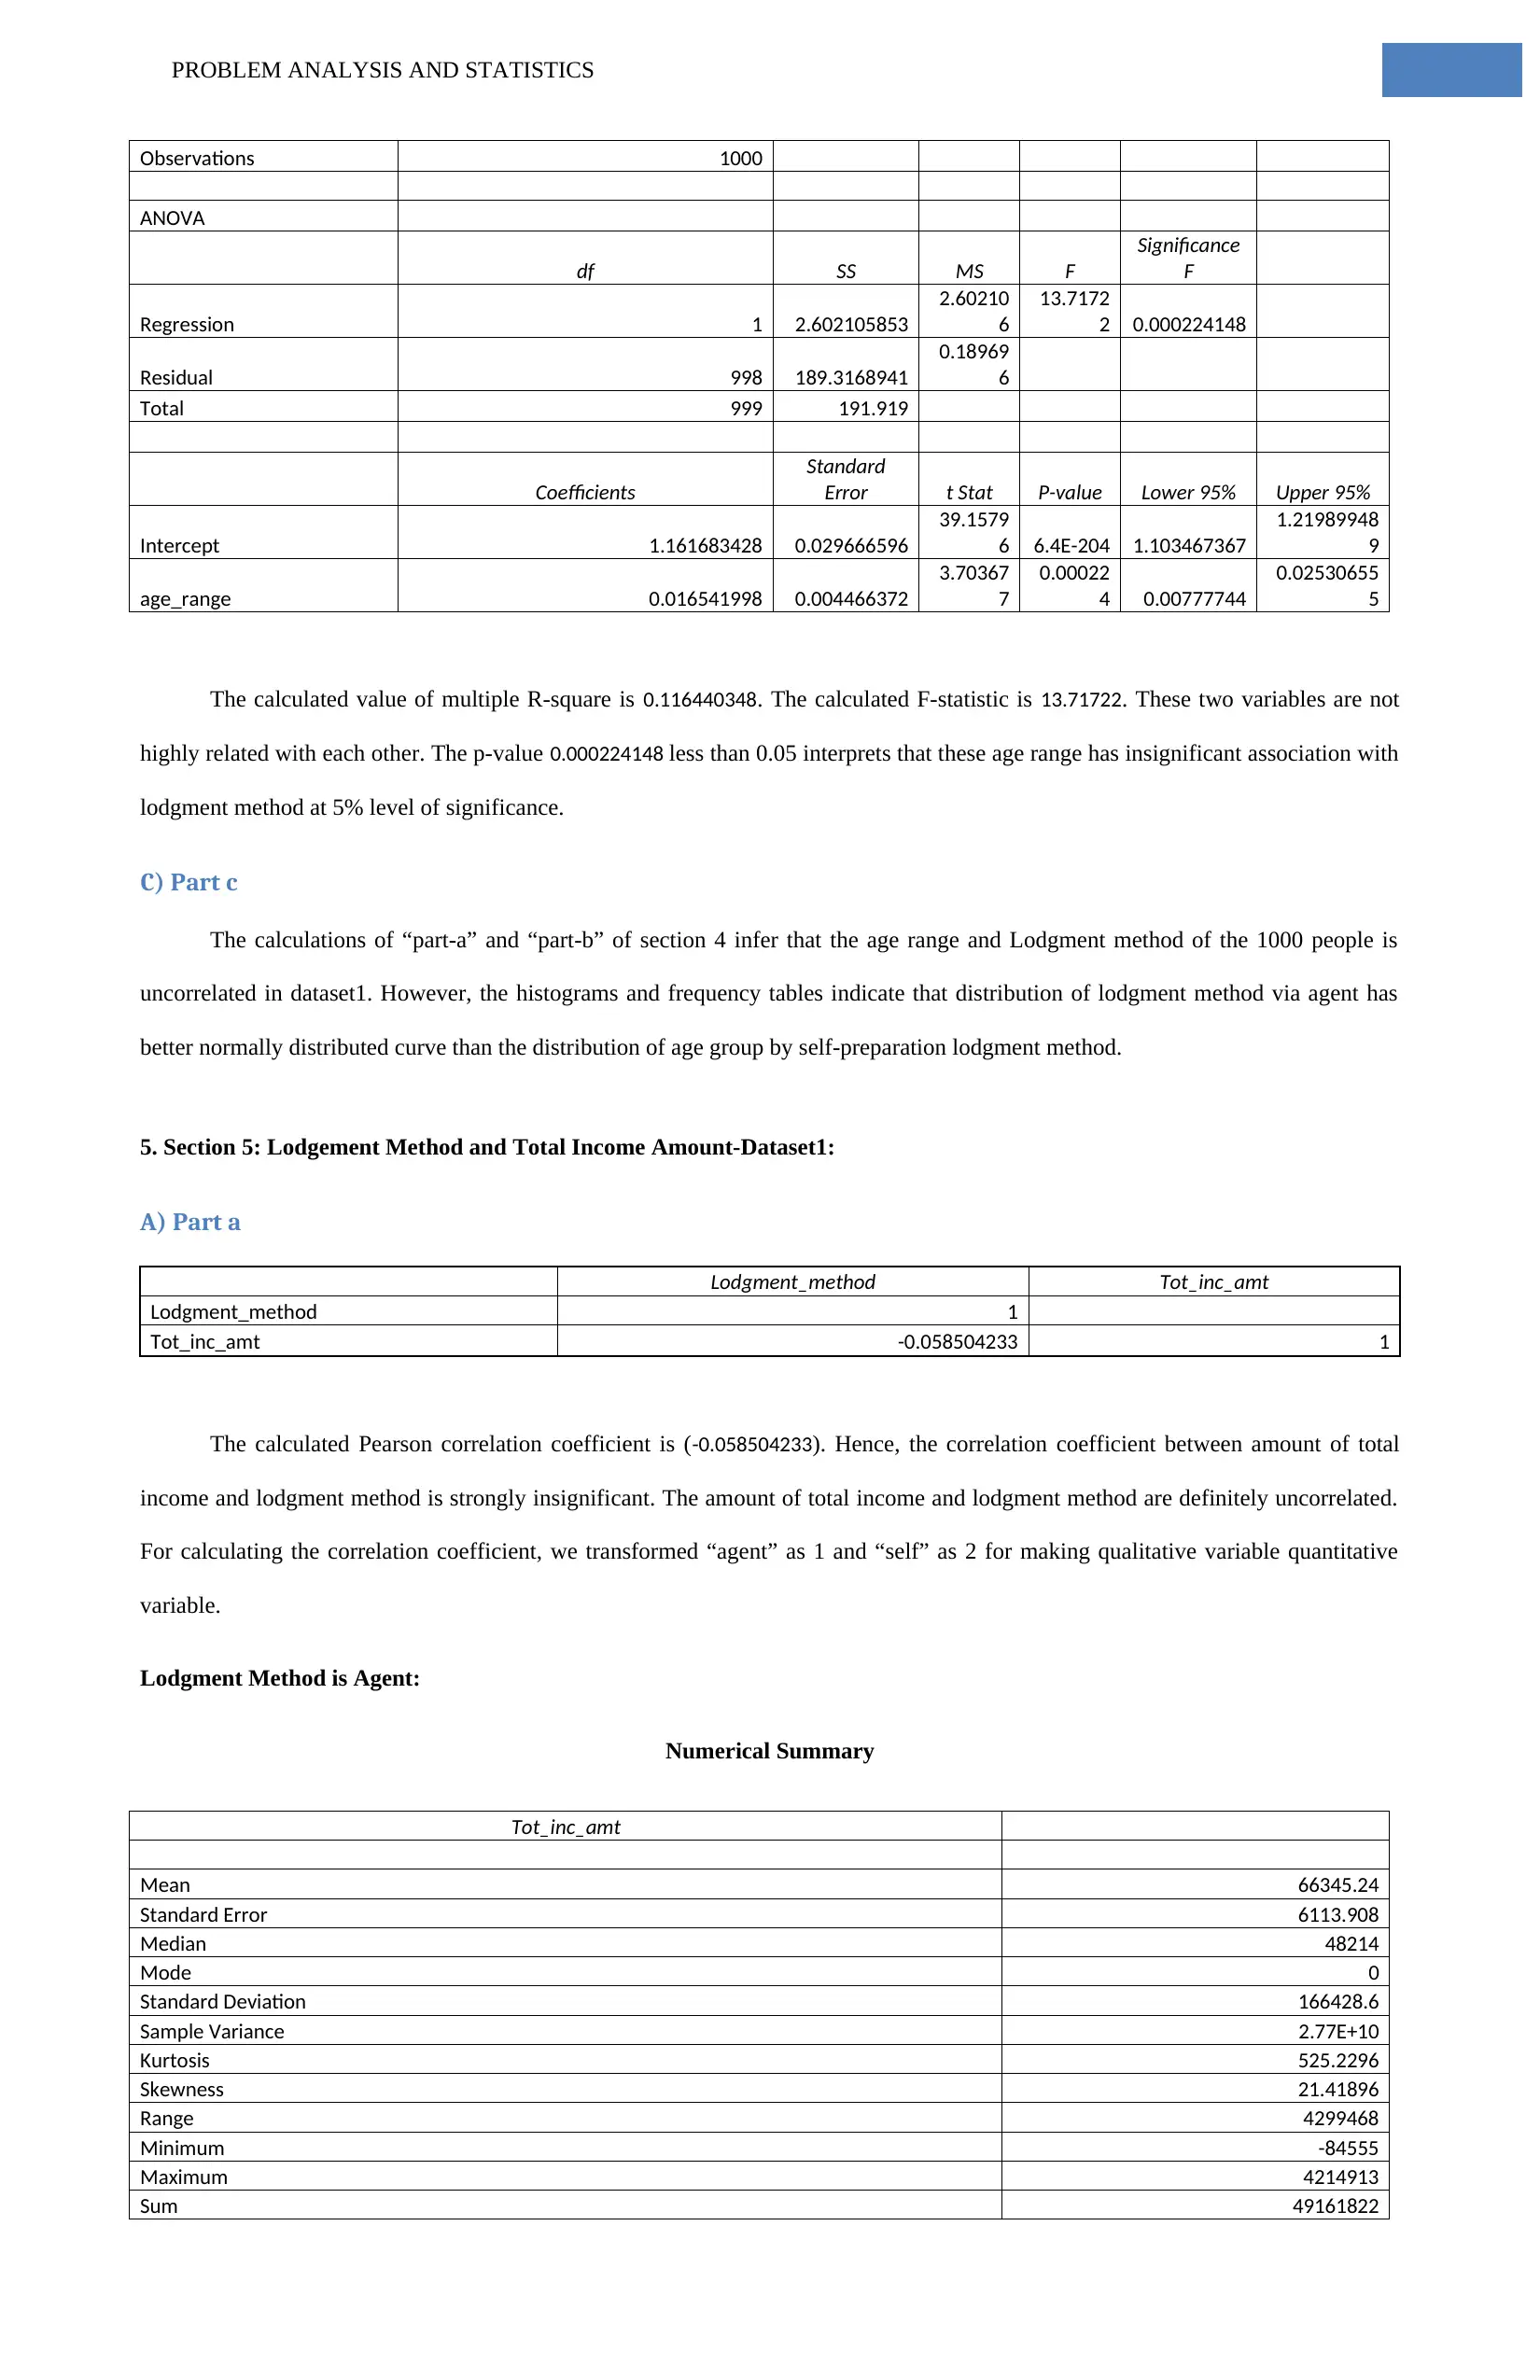
The calculated value of multiple R-square is 0.116440348. The calculated F-statistic is 13.71722. These two variables are not
highly related with each other. The p-value 0.000224148 less than 0.05 interprets that these age range has insignificant association with
lodgment method at 5% level of significance.
C) Part c
The calculations of “part-a” and “part-b” of section 4 infer that the age range and Lodgment method of the 1000 people is
uncorrelated in dataset1. However, the histograms and frequency tables indicate that distribution of lodgment method via agent has
better normally distributed curve than the distribution of age group by self-preparation lodgment method.
5. Section 5: Lodgement Method and Total Income Amount-Dataset1:
A) Part a
Lodgment_method Tot_inc_amt
Lodgment_method 1
Tot_inc_amt -0.058504233 1
The calculated Pearson correlation coefficient is (-0.058504233). Hence, the correlation coefficient between amount of total
income and lodgment method is strongly insignificant. The amount of total income and lodgment method are definitely uncorrelated.
For calculating the correlation coefficient, we transformed “agent” as 1 and “self” as 2 for making qualitative variable quantitative
variable.
Lodgment Method is Agent:
Numerical Summary
Tot_inc_amt
Mean 66345.24
Standard Error 6113.908
Median 48214
Mode 0
Standard Deviation 166428.6
Sample Variance 2.77E+10
Kurtosis 525.2296
Skewness 21.41896
Range 4299468
Minimum -84555
Maximum 4214913
Sum 49161822
Observations 1000
ANOVA
df SS MS F
Significance
F
Regression 1 2.602105853
2.60210
6
13.7172
2 0.000224148
Residual 998 189.3168941
0.18969
6
Total 999 191.919
Coefficients
Standard
Error t Stat P-value Lower 95% Upper 95%
Intercept 1.161683428 0.029666596
39.1579
6 6.4E-204 1.103467367
1.21989948
9
age_range 0.016541998 0.004466372
3.70367
7
0.00022
4 0.00777744
0.02530655
5
The calculated value of multiple R-square is 0.116440348. The calculated F-statistic is 13.71722. These two variables are not
highly related with each other. The p-value 0.000224148 less than 0.05 interprets that these age range has insignificant association with
lodgment method at 5% level of significance.
C) Part c
The calculations of “part-a” and “part-b” of section 4 infer that the age range and Lodgment method of the 1000 people is
uncorrelated in dataset1. However, the histograms and frequency tables indicate that distribution of lodgment method via agent has
better normally distributed curve than the distribution of age group by self-preparation lodgment method.
5. Section 5: Lodgement Method and Total Income Amount-Dataset1:
A) Part a
Lodgment_method Tot_inc_amt
Lodgment_method 1
Tot_inc_amt -0.058504233 1
The calculated Pearson correlation coefficient is (-0.058504233). Hence, the correlation coefficient between amount of total
income and lodgment method is strongly insignificant. The amount of total income and lodgment method are definitely uncorrelated.
For calculating the correlation coefficient, we transformed “agent” as 1 and “self” as 2 for making qualitative variable quantitative
variable.
Lodgment Method is Agent:
Numerical Summary
Tot_inc_amt
Mean 66345.24
Standard Error 6113.908
Median 48214
Mode 0
Standard Deviation 166428.6
Sample Variance 2.77E+10
Kurtosis 525.2296
Skewness 21.41896
Range 4299468
Minimum -84555
Maximum 4214913
Sum 49161822
PROBLEM ANALYSIS AND STATISTICS
Count 741
Largest(1) 4214913
Smallest(1) -84555
Confidence Level(95.0%) 12002.67
Upper confidence limit 78328.5
Lower confidence limit 54361.98
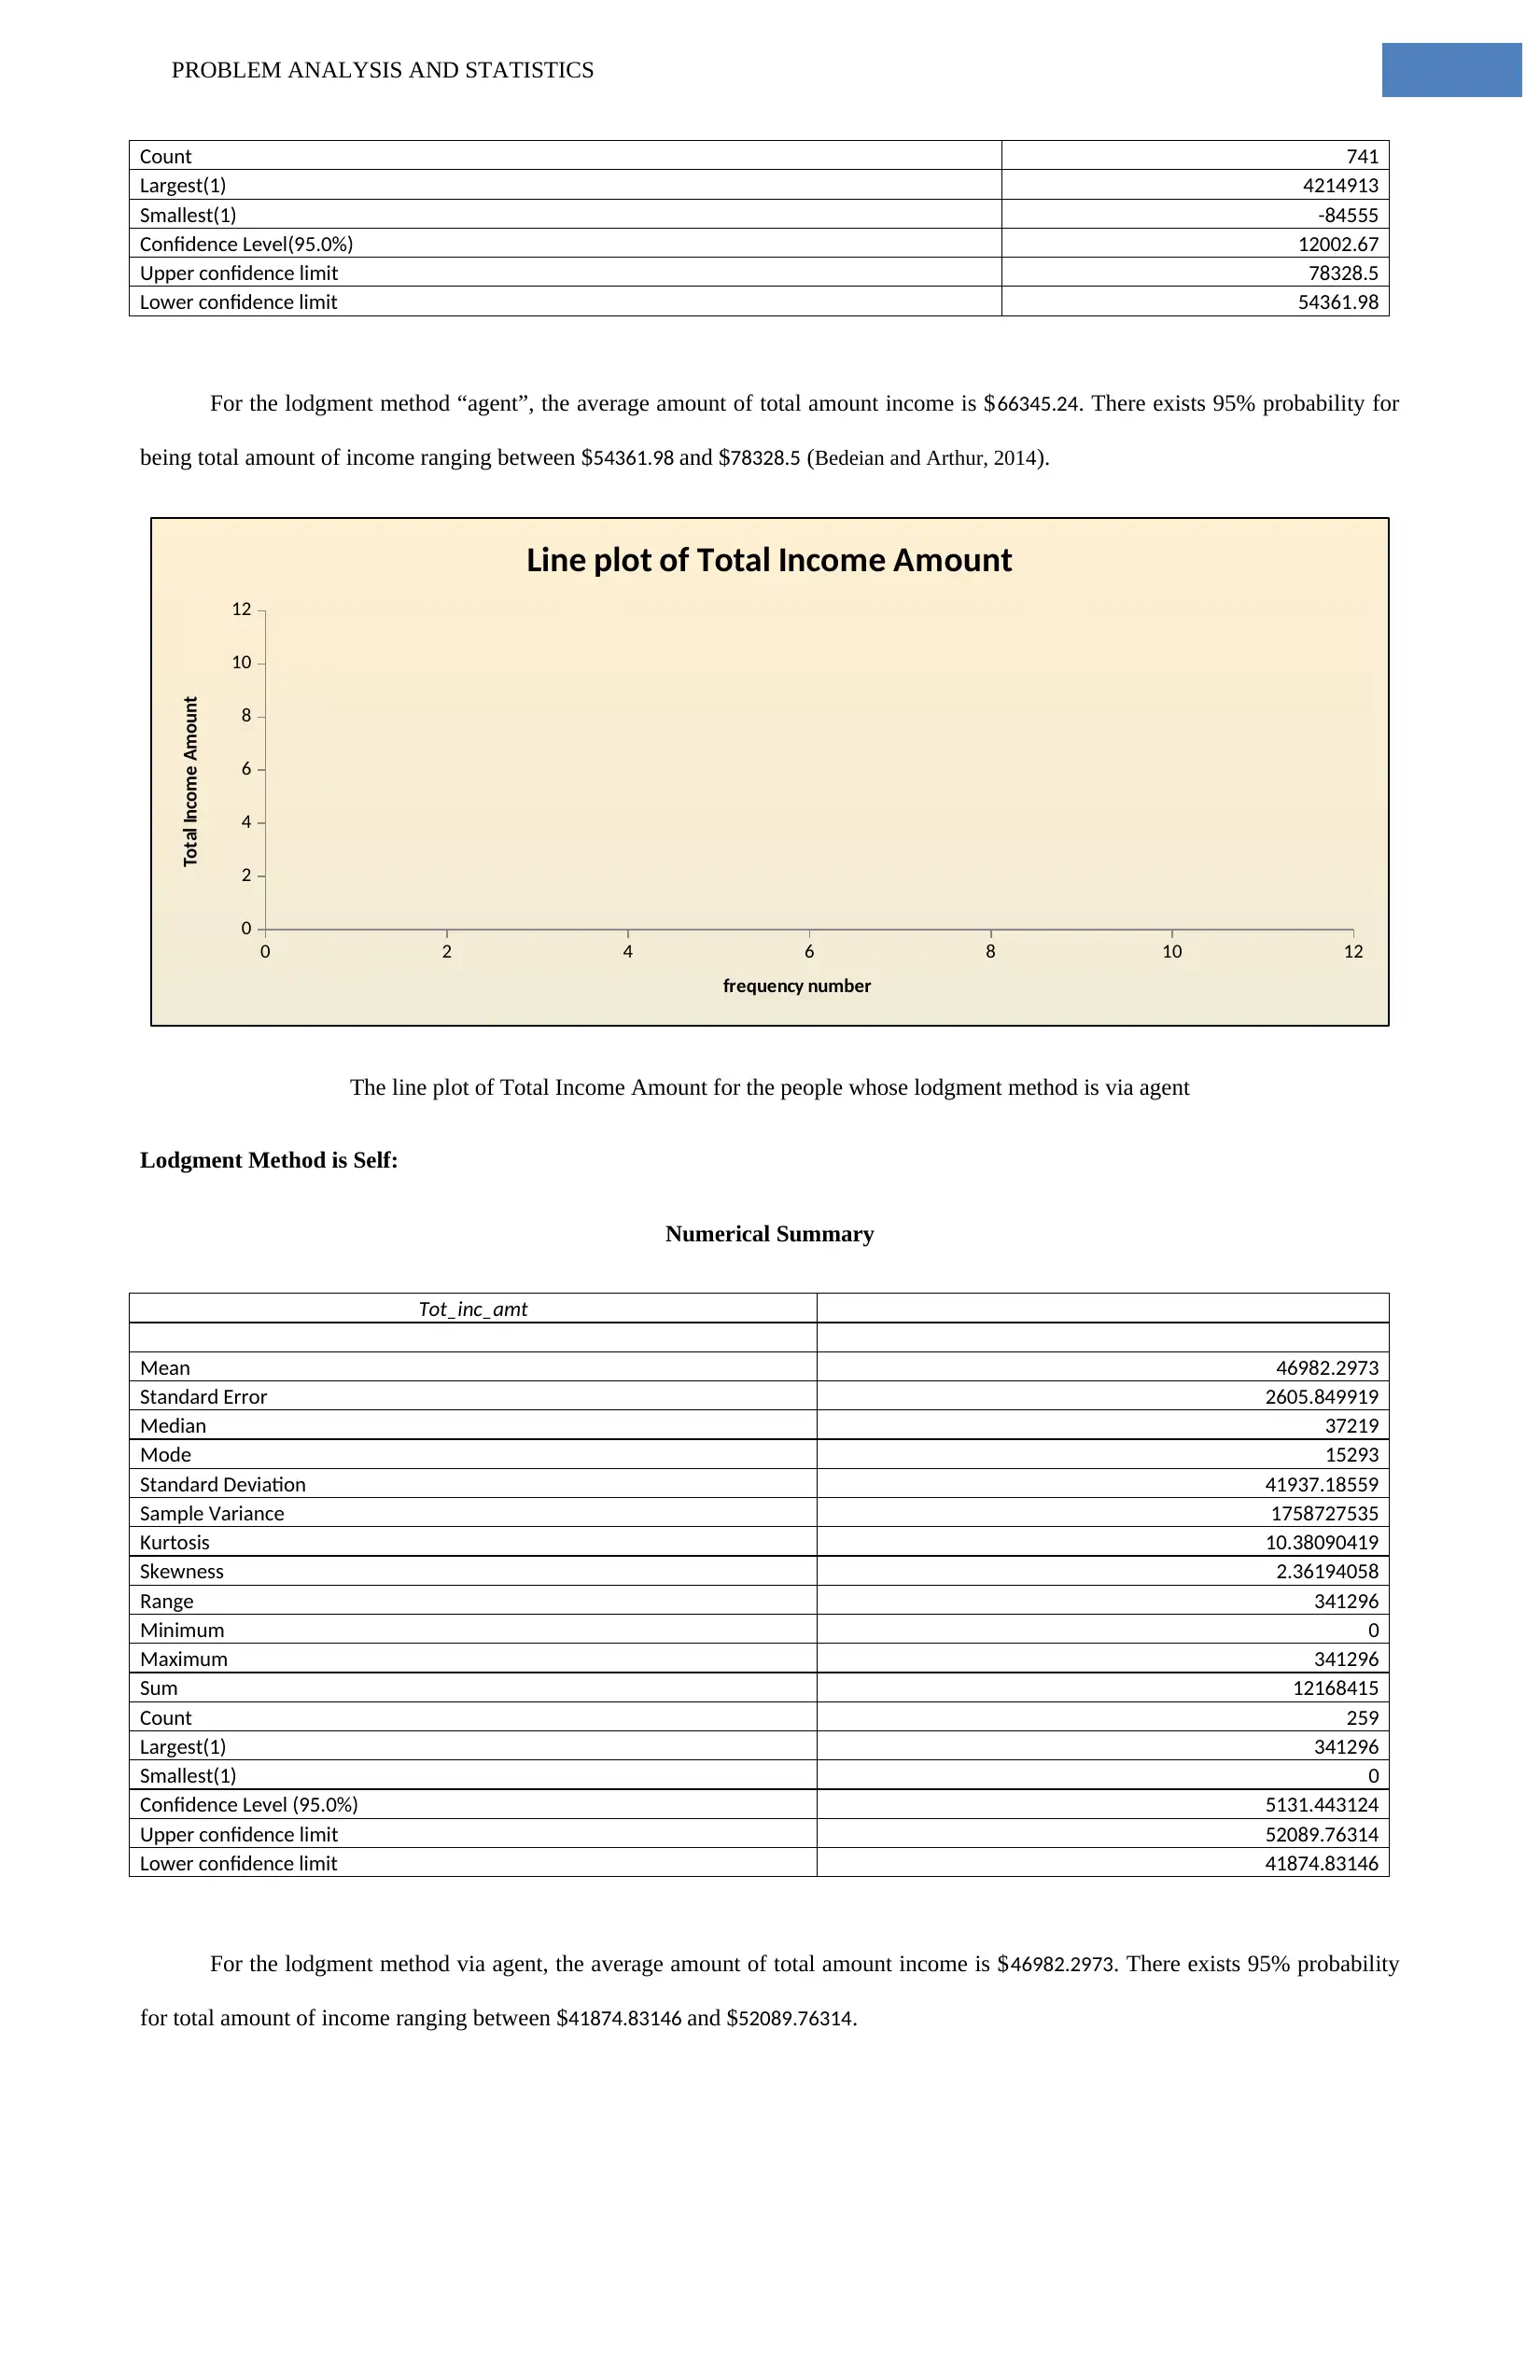
For the lodgment method “agent”, the average amount of total amount income is $66345.24. There exists 95% probability for
being total amount of income ranging between $54361.98 and $78328.5 (Bedeian and Arthur, 2014).
0 2 4 6 8 10 12
0
2
4
6
8
10
12
Line plot of Total Income Amount
frequency number
Total Income Amount
The line plot of Total Income Amount for the people whose lodgment method is via agent
Lodgment Method is Self:
Numerical Summary
Tot_inc_amt
Mean 46982.2973
Standard Error 2605.849919
Median 37219
Mode 15293
Standard Deviation 41937.18559
Sample Variance 1758727535
Kurtosis 10.38090419
Skewness 2.36194058
Range 341296
Minimum 0
Maximum 341296
Sum 12168415
Count 259
Largest(1) 341296
Smallest(1) 0
Confidence Level (95.0%) 5131.443124
Upper confidence limit 52089.76314
Lower confidence limit 41874.83146
For the lodgment method via agent, the average amount of total amount income is $46982.2973. There exists 95% probability
for total amount of income ranging between $41874.83146 and $52089.76314.
Count 741
Largest(1) 4214913
Smallest(1) -84555
Confidence Level(95.0%) 12002.67
Upper confidence limit 78328.5
Lower confidence limit 54361.98
For the lodgment method “agent”, the average amount of total amount income is $66345.24. There exists 95% probability for
being total amount of income ranging between $54361.98 and $78328.5 (Bedeian and Arthur, 2014).
0 2 4 6 8 10 12
0
2
4
6
8
10
12
Line plot of Total Income Amount
frequency number
Total Income Amount
The line plot of Total Income Amount for the people whose lodgment method is via agent
Lodgment Method is Self:
Numerical Summary
Tot_inc_amt
Mean 46982.2973
Standard Error 2605.849919
Median 37219
Mode 15293
Standard Deviation 41937.18559
Sample Variance 1758727535
Kurtosis 10.38090419
Skewness 2.36194058
Range 341296
Minimum 0
Maximum 341296
Sum 12168415
Count 259
Largest(1) 341296
Smallest(1) 0
Confidence Level (95.0%) 5131.443124
Upper confidence limit 52089.76314
Lower confidence limit 41874.83146
For the lodgment method via agent, the average amount of total amount income is $46982.2973. There exists 95% probability
for total amount of income ranging between $41874.83146 and $52089.76314.
⊘ This is a preview!⊘
Do you want full access?
Subscribe today to unlock all pages.
Trusted by 1+ million students worldwide
1 out of 35
Related Documents


Your All-in-One AI-Powered Toolkit for Academic Success.
+13062052269
info@desklib.com
Available 24*7 on WhatsApp / Email
![[object Object]](/_next/static/media/star-bottom.7253800d.svg)
Unlock your academic potential
Copyright © 2020–2026 A2Z Services. All Rights Reserved. Developed and managed by ZUCOL.