Numeracy and Data Analysis Report: Liverpool Temperature Analysis

Verified

Added on  2023/06/04

|10
|1434
|185
Report
AI Summary
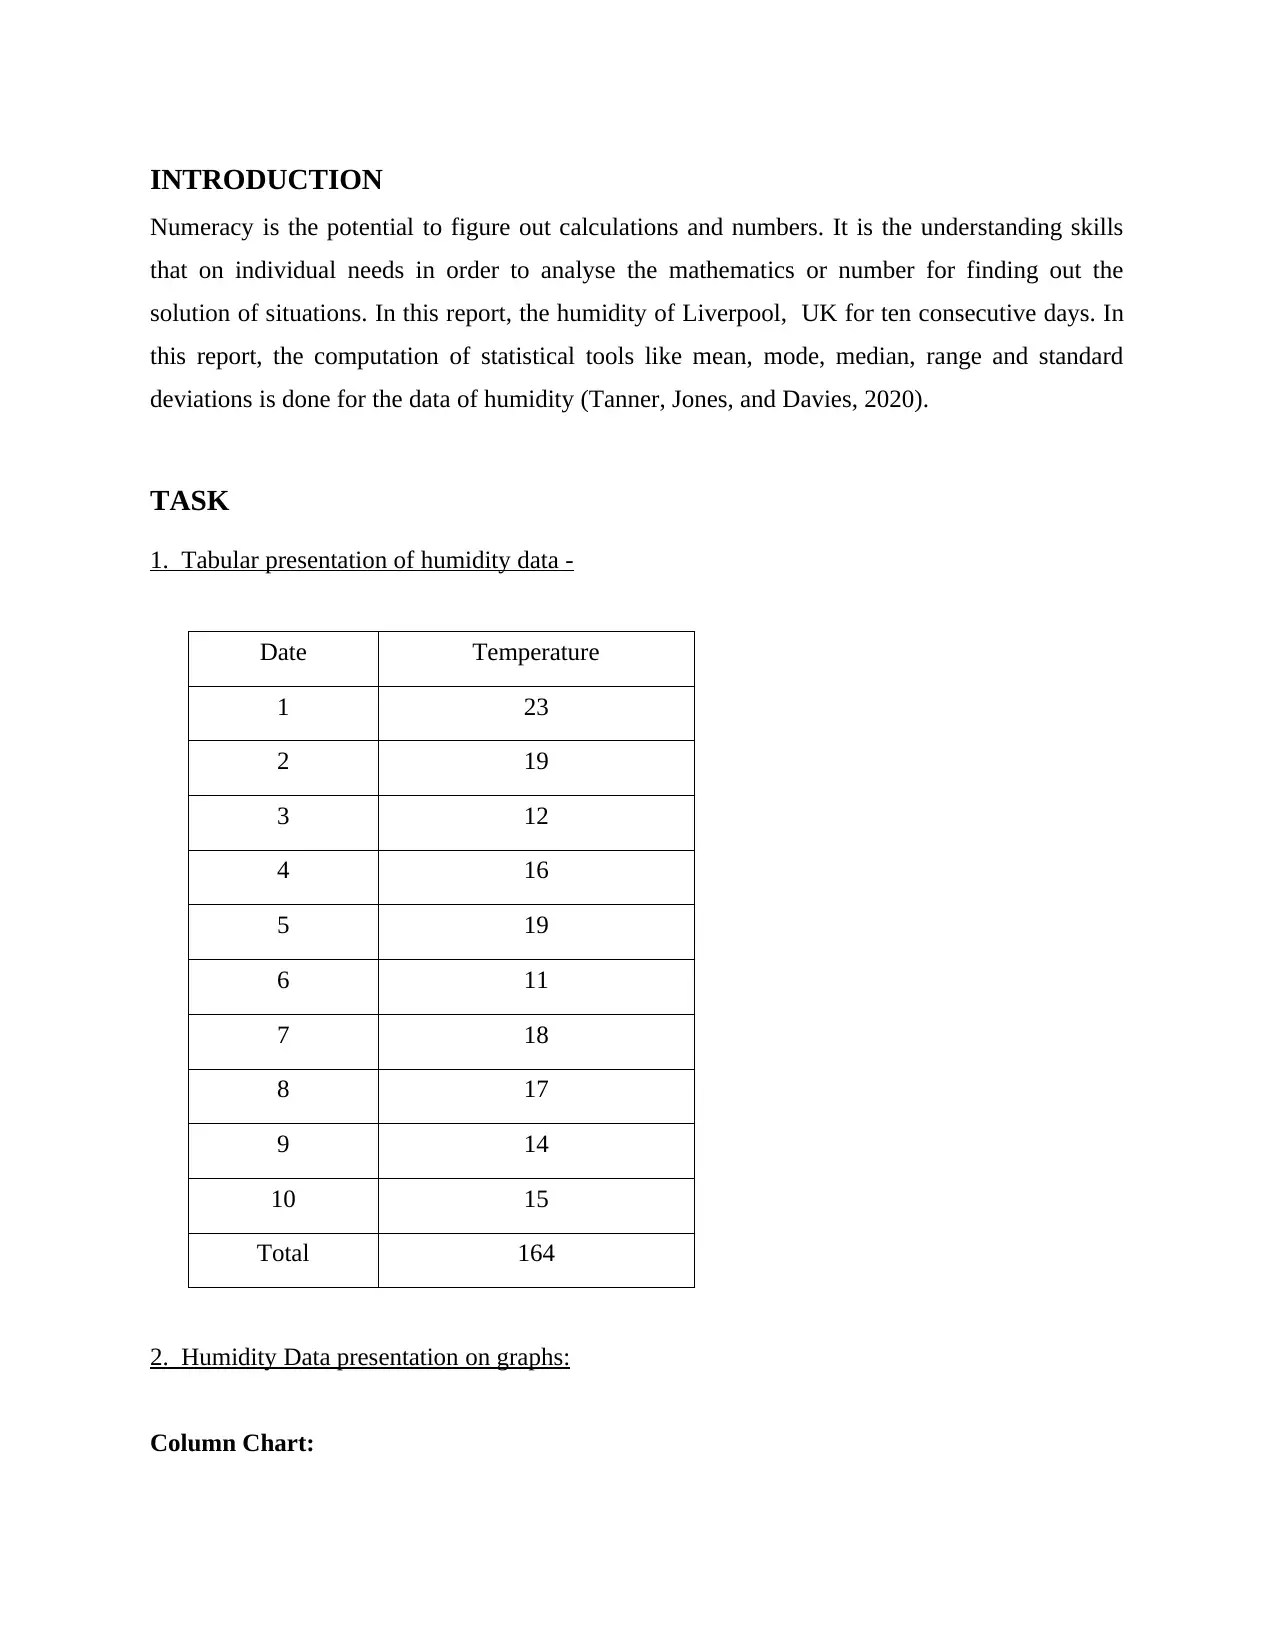
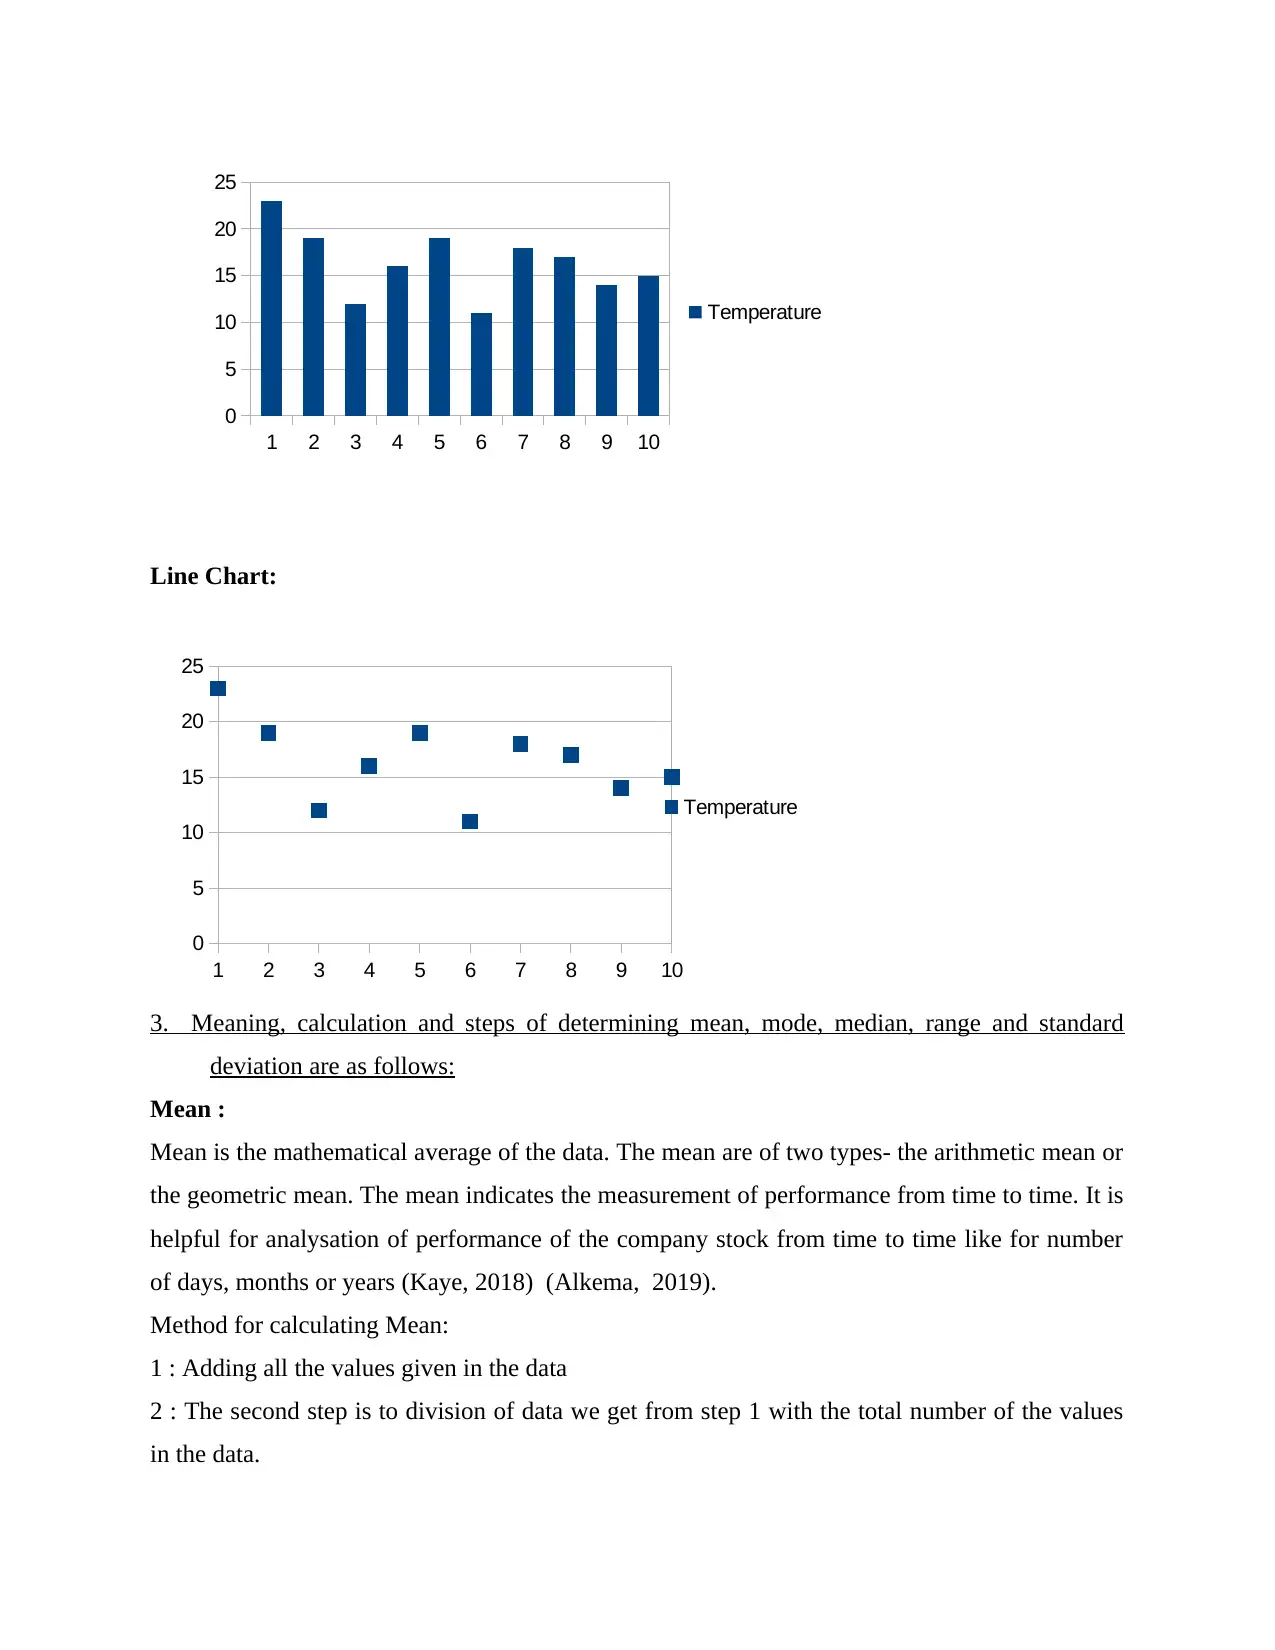
This report provides a comprehensive analysis of Liverpool's temperature data over ten consecutive days. It begins with a tabular presentation of the humidity data, followed by visual representations using column and line charts. The core of the report focuses on applying statistical tools to the data, including the calculation and explanation of mean, mode, median, range, and standard deviation. Detailed steps for each calculation are provided, enhancing understanding of the concepts. Furthermore, the report delves into linear forecasting to predict temperatures for days 11 and 14, determining the values of 'M' and 'C' and outlining the phases involved in the computation. The conclusion summarizes the findings, emphasizing the application of statistical methods to analyze and interpret the temperature data. References to relevant sources are also included to support the analysis.
Document Page
Numeracy & Data
analysis
tabler-icon-diamond-filled.svg

Paraphrase This Document

Need a fresh take? Get an instant paraphrase of this document with our AI Paraphraser
Document Page
Table of Contents
INTRODUCTION ..........................................................................................................................3
TASK...............................................................................................................................................3
1. Tabular presentation of humidity data -.................................................................................3
2. Humidity Data presentation on graphs:..................................................................................3
3. Meaning, calculation and steps of determining mean, mode, median, range and standard
deviation are as follows:..............................................................................................................4
4. Find out the values of the M and C and and discuss the phases to be followed for
computing the value of the temperature of the day 11 and 14. ..................................................6
CONCLUSION................................................................................................................................9
REFRENCES.................................................................................................................................10
Document Page
INTRODUCTION
Numeracy is the potential to figure out calculations and numbers. It is the understanding skills
that on individual needs in order to analyse the mathematics or number for finding out the
solution of situations. In this report, the humidity of Liverpool, UK for ten consecutive days. In
this report, the computation of statistical tools like mean, mode, median, range and standard
deviations is done for the data of humidity (Tanner, Jones, and Davies, 2020).
TASK
1. Tabular presentation of humidity data -
Date Temperature
1 23
2 19
3 12
4 16
5 19
6 11
7 18
8 17
9 14
10 15
Total 164
2. Humidity Data presentation on graphs:
Column Chart:
Document Page
Line Chart:
3. Meaning, calculation and steps of determining mean, mode, median, range and standard
deviation are as follows:
Mean :
Mean is the mathematical average of the data. The mean are of two types- the arithmetic mean or
the geometric mean. The mean indicates the measurement of performance from time to time. It is
helpful for analysation of performance of the company stock from time to time like for number
of days, months or years (Kaye, 2018) (Alkema, 2019).
Method for calculating Mean:
1 : Adding all the values given in the data
2 : The second step is to division of data we get from step 1 with the total number of the values
in the data.
1 2 3 4 5 6 7 8 9 10
0
5
10
15
20
25
Temperature
1 2 3 4 5 6 7 8 9 10
0
5
10
15
20
25
Temperature
tabler-icon-diamond-filled.svg

Paraphrase This Document

Need a fresh take? Get an instant paraphrase of this document with our AI Paraphraser
Document Page
Humidity Mean : addition of all the values / number of values
= 164/10
= 16.4
Median :
it is the average value in a sequential data either in upward or downward form. If the numbers in
the data are odd then the value of the odd number is the value of median and in case if the
number is even then the value from the data which have the central pair must be find and after
that add both the numbers and divide the addition value from two for finding the value of
median.
Steps for calculation of Median:
1 : Arrangement of all the data in upmost order
2 : Count the number of data
3 : Determine the even and odd terms
4 : Calculation of median
Humidity Median :
= 10/2 =5
= (5th term +6th term ) / 2
= (16+17)/2
= 33/2
= 16.5
Mode:
In statistics the most repetitive number from the given data is known as mode. It is helpful to
measure the exact description of the whole data when there is need to analysing of categorised
data. In normal distribution, the mode is as similar to mean and that of median, but in some cases
it's not the same.
Technique for calculating Mode -
1: Arrangement of data in upward or downward order
2: Analysation of data and find the most repetitive number
3: The number that occurs the most is mode
As per the data we have, the most repetitive number is 19 so, the humidity mode is 19
Document Page
Range:
In statistics, range shows the difference of the minimum value from the maximum one. The
range allow us to known about the spread of the whole data and what is the extreme value of the
provided data (Faragher, 2019).
Methodology for determining Range:
1: Analysation of data
2: Select the lowest and the highest value
3: Find the difference of lowest value from highest value.
Humidity Range = high value – low value
= 23-11
= 12
Standard deviation: It is the method used to measure the variations or the differences in the
variables or the set of the data.
Way to calculate standard deviation:
1: Find out the value of mean
2: Analysation of every score deviation from mean and then do the square root of them.
3: Add the value we find in step 2
4: Divide the number of data point
5: Find out the square root.
= 116.4/10
= 3.41
4. Find out the values of the M and C and and discuss the phases to be followed for computing
the value of the temperature of the day 11 and 14.
Linear forecasting: It specify the relation among the two variables. The information is calculated
by using the past data to represent them in time series. It helps to follow the pattern and the
trends that is needed to measure the values. It will furnish to forecast the data in future and to
compare the data of the two variables. It comes under the quantitive measurement to follow the
Document Page
patterns of the trends when the cost is increased. It will provide benefit to lower the price and
make the strategy of the data trend line. It guides to compare the budgeted amounts with the past
data (Colliver, and Arguel 2018). It is the most crucial method to calculate the figure of the Y.
Y = MX + C
= [(10*860)-(55*164)]/(10*385)-(55)^2
= [8600-9020]/3850-3025
= 420/825
= 0.51
tabler-icon-diamond-filled.svg

Paraphrase This Document

Need a fresh take? Get an instant paraphrase of this document with our AI Paraphraser
Document Page
={164-0.51(55)}/10
= {164 – 28.05}/10
= 135.95/10
= 13.6
Temperature of day 11:
M= 0.51
X = 11
C = 13.6
= 0.51*11+13.6
= 19.21
Temperature of day 14:
X = 14
= 0.51*14+13.6
= 20.74
Document Page
CONCLUSION
It has been observed from the predetermined report that there is the information of the
Liverpool country of the 10 days temperature. The content of the temperature is showed in the
tabular form accompanying with the days and amount of the temperatures. The next is to
represent the Liverpool organisation temperature with the help of the charts and the graphs. This
table guide to compute the median, mode and the mean. In this report there the estimation of the
statistical data to provide the content in simple manner. Company has assume the several
elements to use the data of temperature to find the concluded result. In this company calculated
the standard deviation to know the the changes figure of the mean.
Document Page
REFRENCES
Tanner, H Jones, S. and Davies, A., 2020. Developing numeracy in the secondary school: a
practical guide for students and teachers. Routledge.
Kaye, D., 2018. Defining adult and numeracy: An academic and political investigation.
In Contemporary Research in Adult and Lifelong Learning of Mathematics (pp. 11-37).
Springer, Cham.
Alkema, A., 2019. The workplace as a context for adult literacy and numeracy learning. Journal
of Adolescent & Adult Literacy, 63(1). pp.102-105.
Faragher, R., 2019. The new ‘functional mathematics’ for learners with down syndrome:
Numeracy for a digital world. International Journal of Disability, Development and
Education, 66(2). pp.206-217.
Colliver, Y. and Arguel, A., 2018. Following in our footsteps: How adult demonstrations of
literacy and numeracy can influence children’s spontaneous play and improve learning
outcomes. Early Child Development and Care, 188(8). pp.1093-1108.
chevron_up_icon
1 out of 10
circle_padding
hide_on_mobile
zoom_out_icon
[object Object]