Introduction to Statistical Tests and Data Visualization Assignment
VerifiedAdded on 2022/08/13
|8
|1001
|22
Homework Assignment
AI Summary
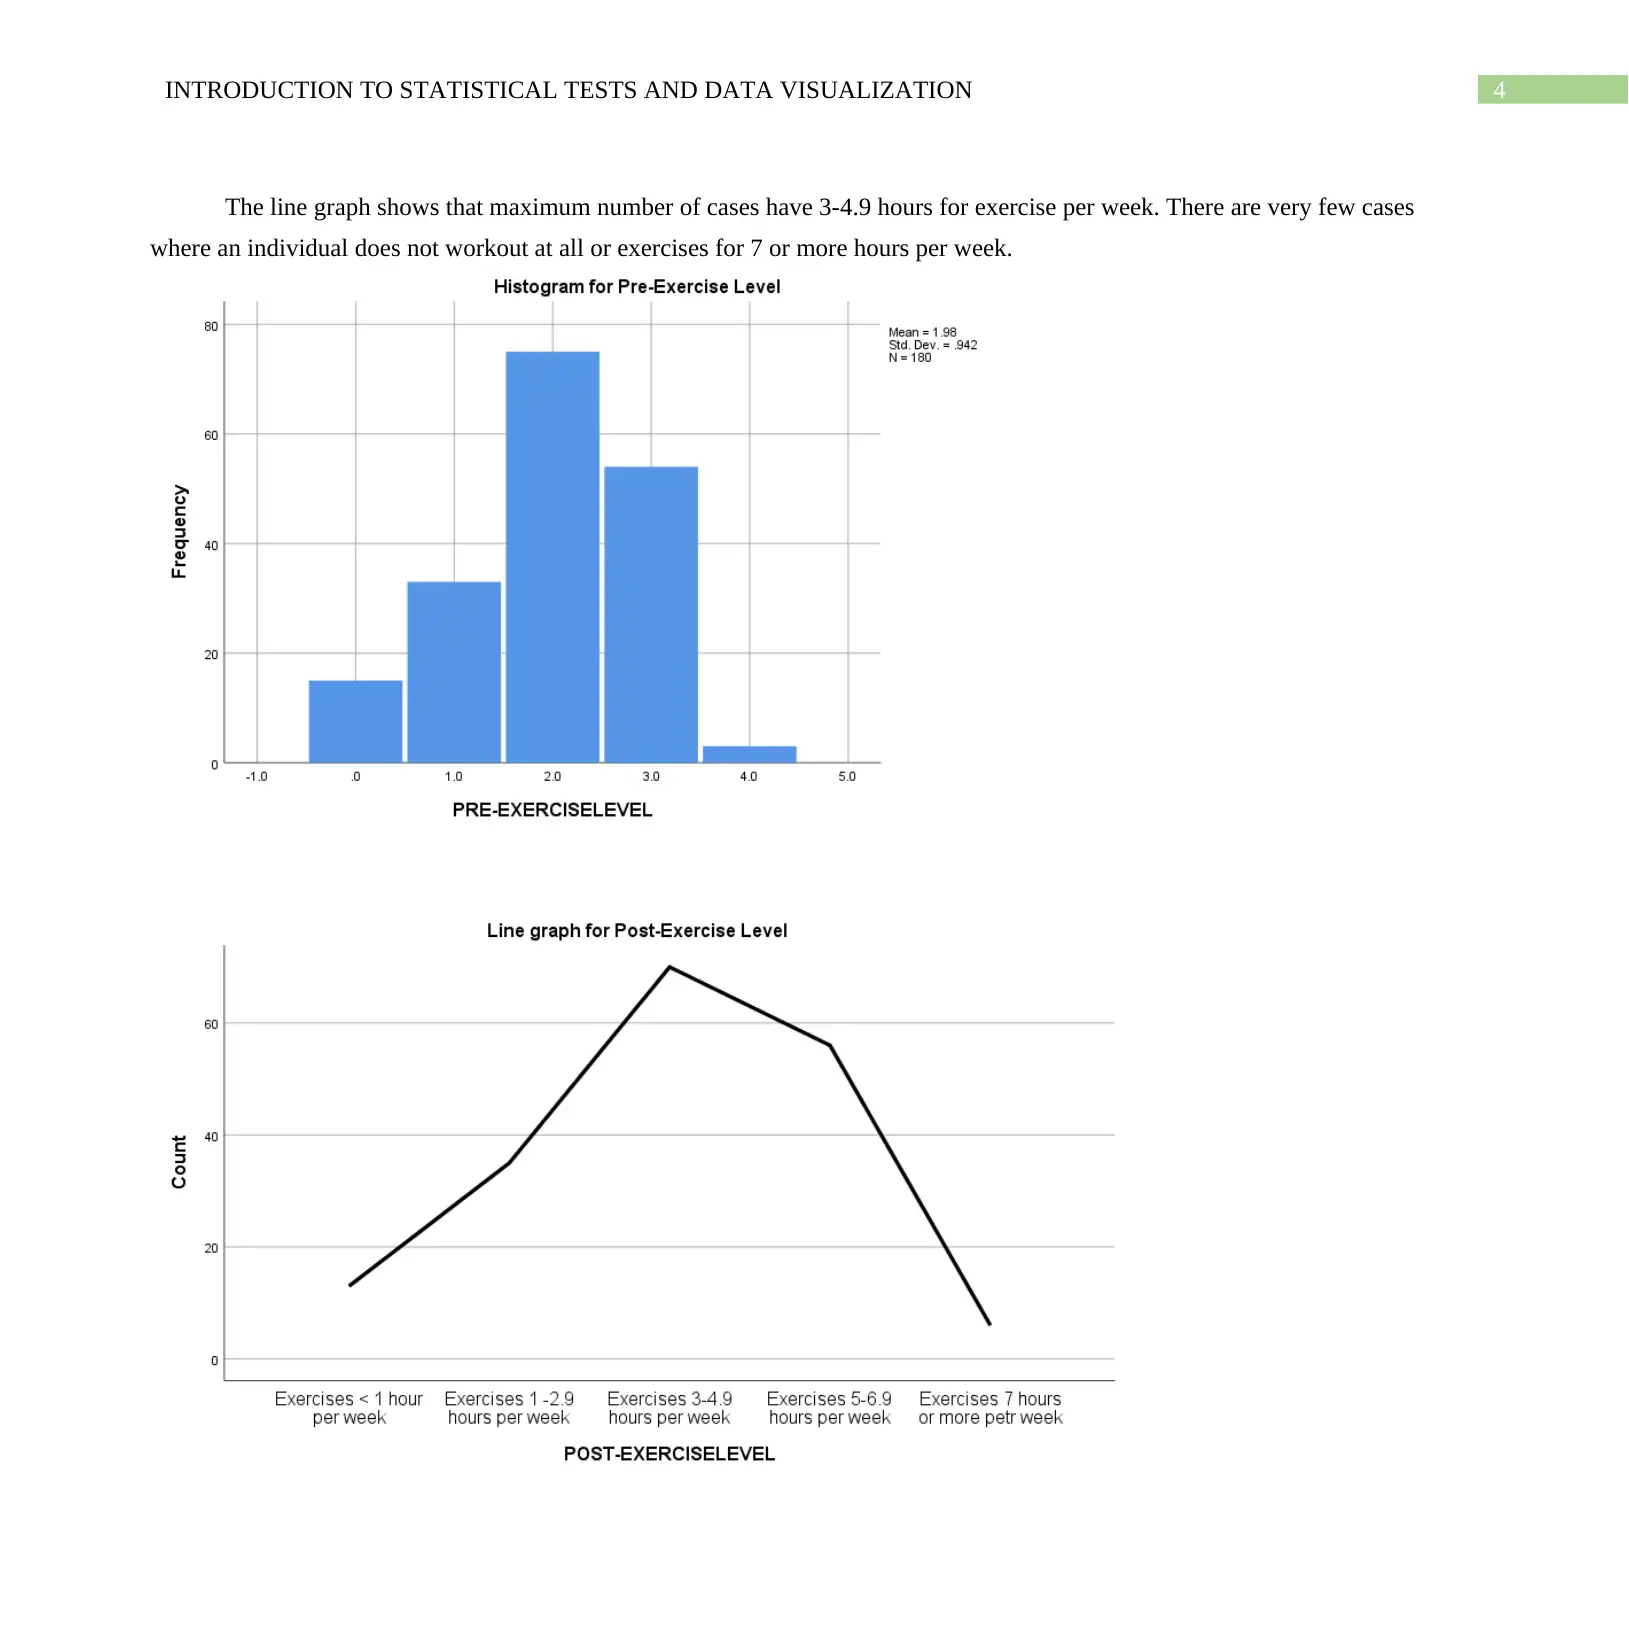
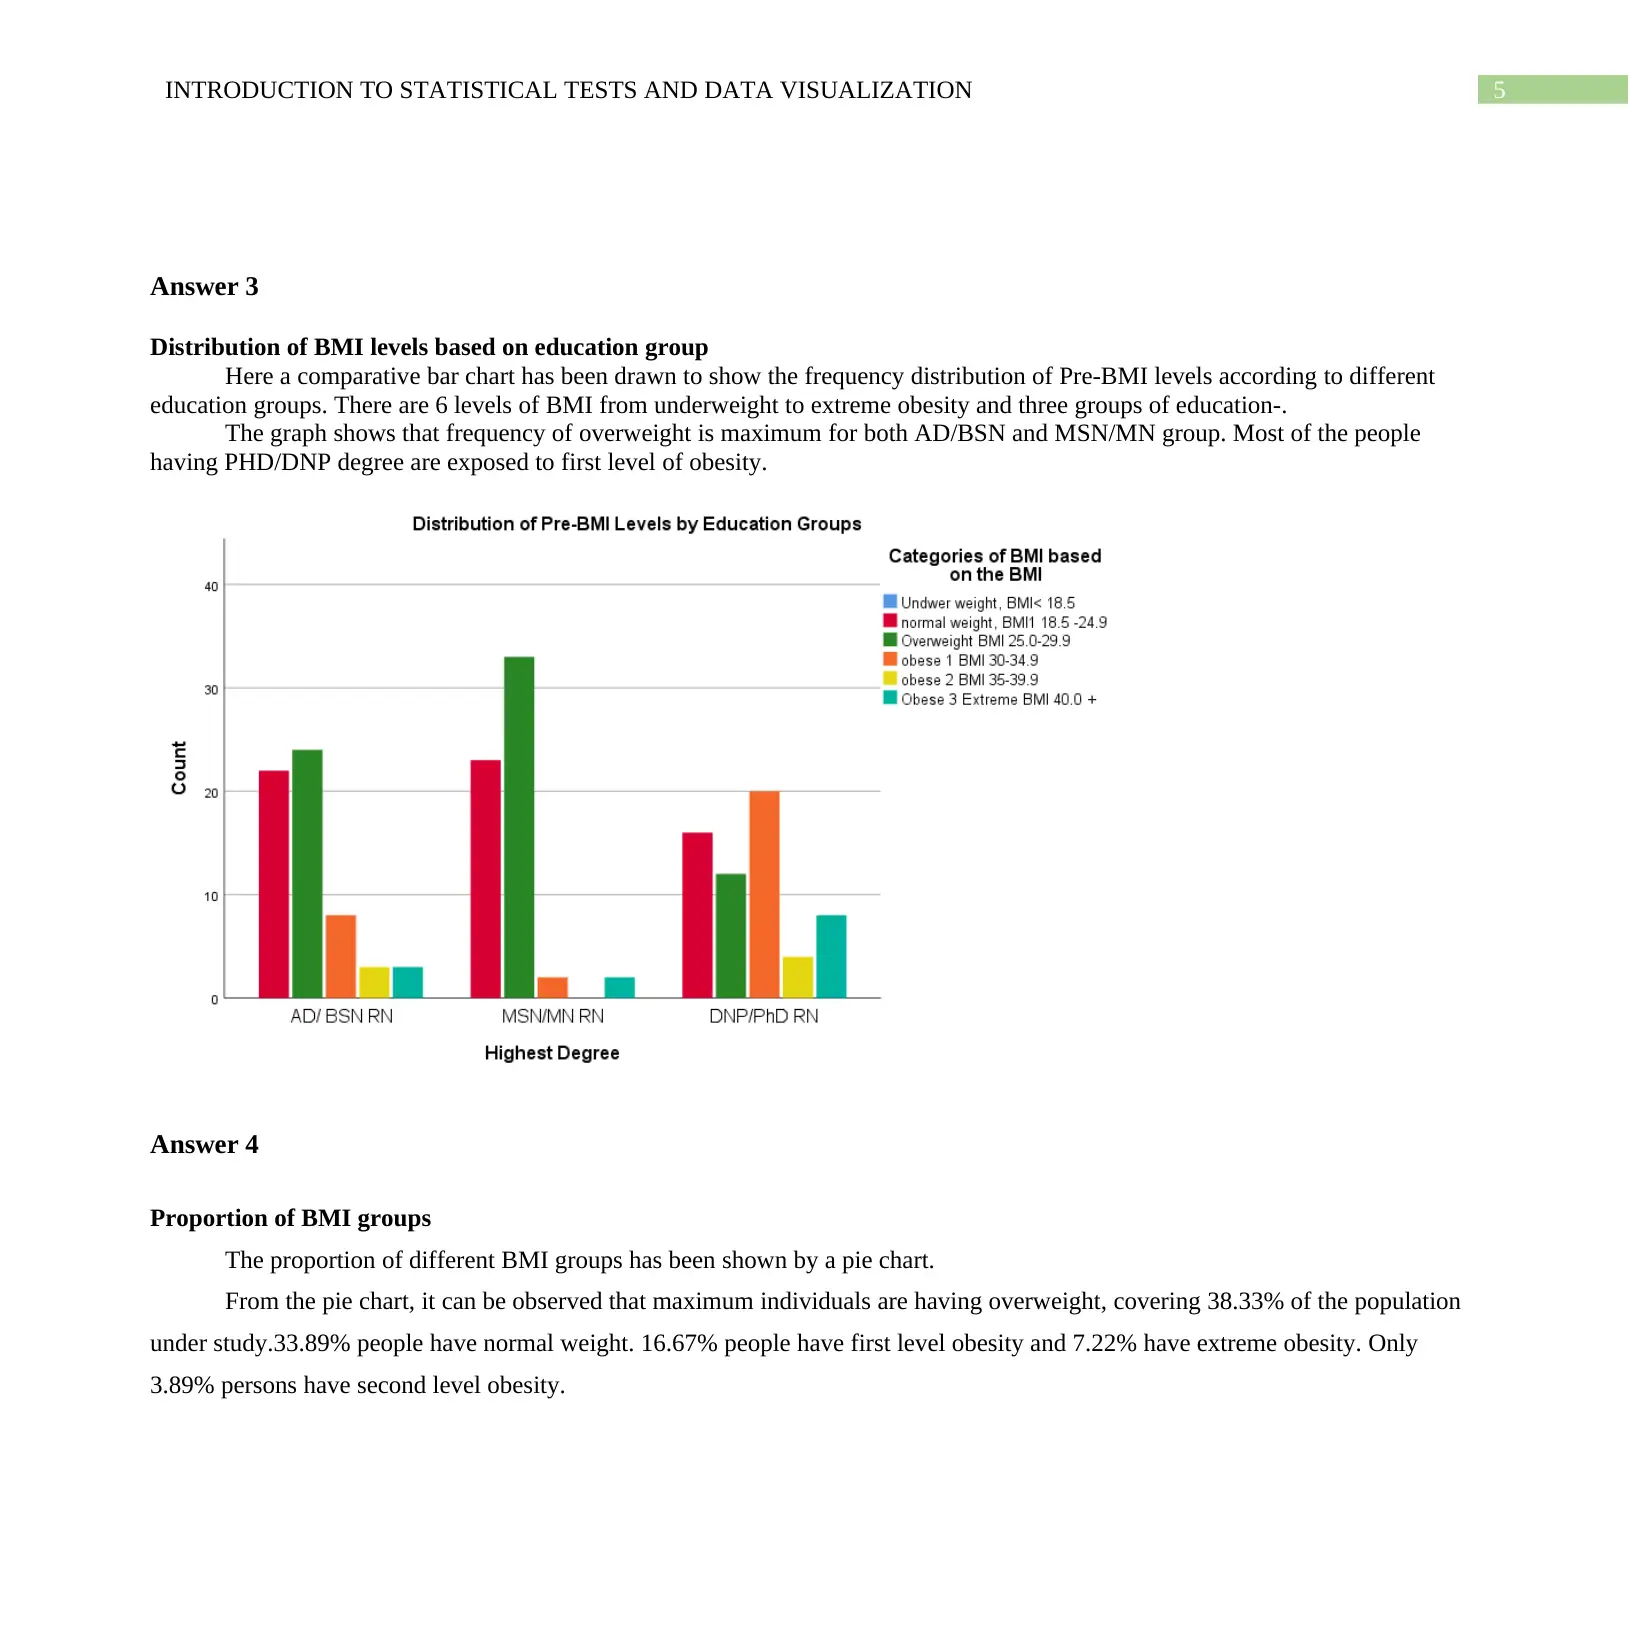
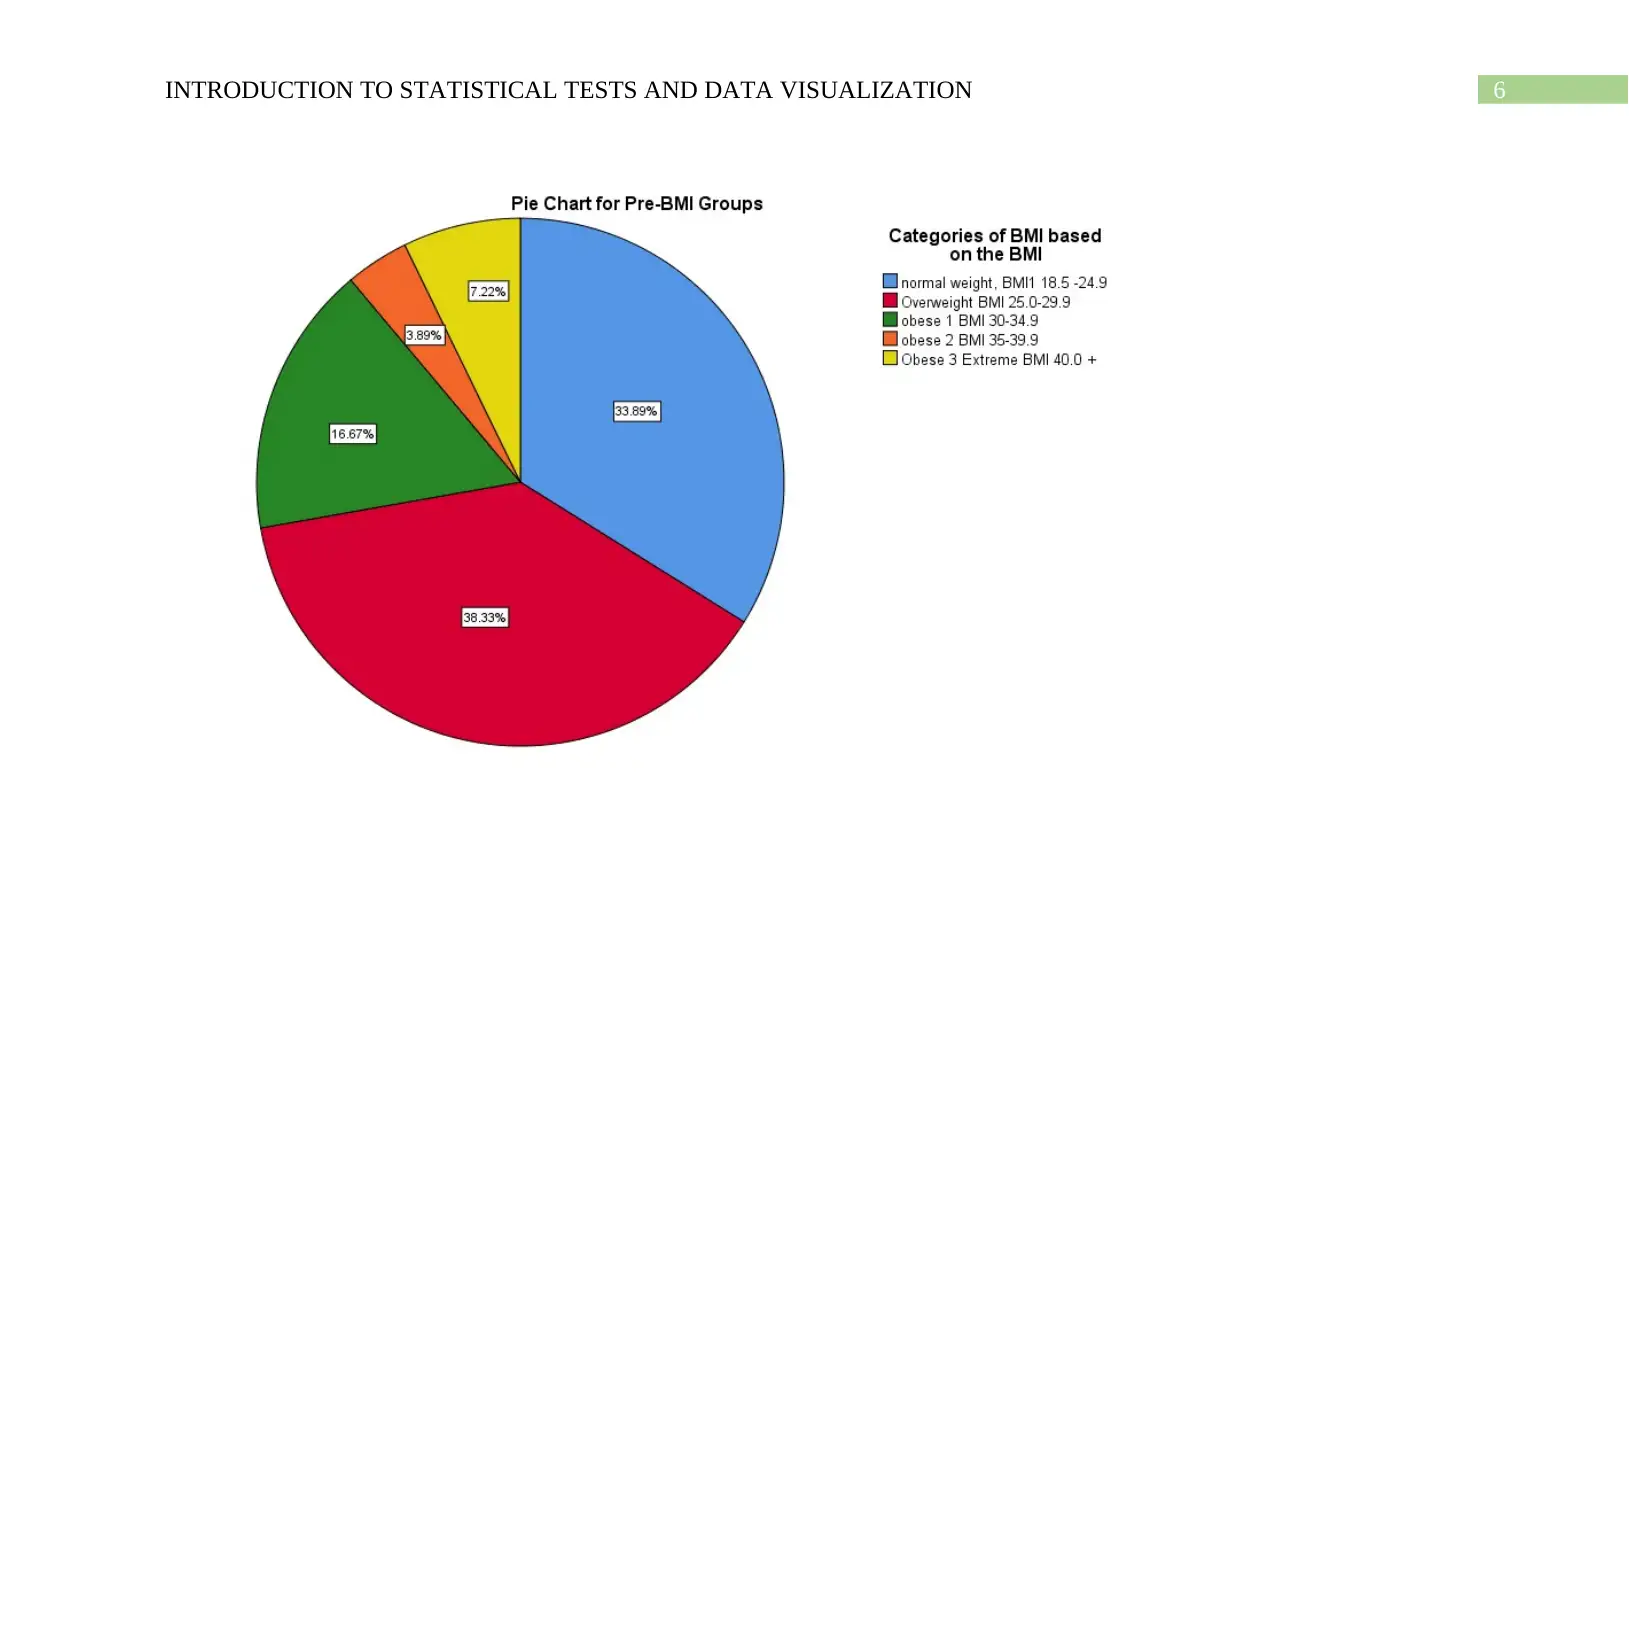
This assignment solution provides answers to a statistics assignment focusing on statistical tests and data visualization. Part 1 addresses the selection of appropriate statistical tests (t-tests, chi-square, linear regression, ANOVA) for various scenarios, explaining the rationale behind each choice. Part 2 focuses on data visualization, with solutions for creating scatter plots, histograms, bar charts, and pie charts to represent and interpret data effectively. The assignment covers topics such as relationships between variables, distributions, and comparisons across groups, illustrating how different visualization techniques can reveal insights from data. The document includes a bibliography citing relevant statistical resources.

INTRODUCTION TO STATISTICAL TESTS AND DATA VISUALIZATION
Name of the Student:
Name of the University:
Author Note:
INTRODUCTION TO STATISTICAL TESTS AND DATA VISUALIZATION
Name of the Student:
Name of the University:
Author Note:
Paraphrase This Document
Need a fresh take? Get an instant paraphrase of this document with our AI Paraphraser

1INTRODUCTION TO STATISTICAL TESTS AND DATA VISUALIZATION
Part 1
Answer: Scenario 1
For this study, a two independent sample t-test will be a perfect tool for the analysis.
Here the measurements of stressful events are recorded for two independent groups-cardiac and orthopedic patients. It is
required to find whether cardiac patients have more stressful lives than orthopedic patients. In statistical terms, it is required to test
the equality of means of events for two independent groups. Hence two-sample independent t-test would be most appropriate.
Answer: Scenario 2
Chi- square test for independence is the most suitable test for this case.
Both the study variables are categorical. The variable community has three categories and opinion has also three categories.
The objective is to find whether opinion is related to the community of a person. Since chi-square test measures the association
between two categorical variables, it would be perfect tool for the analysis.
Answer: Scenario 3
Chi square test for independence of groups should be used for this study.
Chi-square test is performed to see the relation between two categorical variables. Here both the variables of interest are
categorical and it is required to find the relation between them. Therefore, Chi-square test is appropriate here.
Answer: Scenario 4
A suitable test for this case is independent sample t-test.
The measurements are taken for two independent groups. The aim is to check whether one group has better result than the
other group which indicates the test of equality of means of two independent groups. Hence, independent sample t-test should be
applied.
Answer: Scenario 5
Here paired sample t-test would be appropriate.
Here the observations are taken on the same set of individuals and the objective is to find whether the second sample is
better than the first sample. Hence, paired sample t-test is the most suitable one.
Answer: Scenario 6
Linear regression should be used in this problem.

2INTRODUCTION TO STATISTICAL TESTS AND DATA VISUALIZATION
The objective is to find whether job satisfaction level can be interpreted by the duration of job. Hence, linear regression
should be used taking duration of job as independent and satisfaction level as dependent variable.
Answer: Scenario 7
Here the goal is to check whether there is any significant difference in the scores of two independent groups. Hence, an
independent sample t-test should be applied here.
Answer: Scenario 8
One-way ANOVA is the most suitable tool in this analysis.
Here the researcher’s interest is to investigate if there is any notable difference in the scores among various groups. Hence,
one-way ANOVA would be perfect for this situation.
Answer: Scenario 9
The objective of this study is to build up a relation between a dependent variable and a set of independent variables.
Therefore, multiple regression would be the most accurate model in this case.
Answer: Scenario 10
Here it is required to observe if there is any significant difference in intensity among three different groups. Thus, a one-way
ANOVA would be a perfect equipment for the analysis.
⊘ This is a preview!⊘
Do you want full access?
Subscribe today to unlock all pages.

Trusted by 1+ million students worldwide

3INTRODUCTION TO STATISTICAL TESTS AND DATA VISUALIZATION
Part 2
Answer 1
Relation between Pre-BMI and Self-Esteem
Here a scatter plot has been used to show the connection between Pre-BMI measure and self-esteem of individuals.
The plot shows a perfect linear relationship between these two variables. Further, it can be seen that one unit increase in the
Pre-BMI will decrease the value of self-esteem by 0.95times. Therefore, it can be concluded that a higher Pre-BMI indicates a lower
value of self-esteem.
Answer 2
Visualization of Pre-Exercise Level and Post-Exercise Level
The distributions of pre-exercise level and post exercise level are represented by a histogram and a line graph respectively.
The histogram shows that on average, the pre-exercise level is 1.98hours with standard deviation 0.942. In maximum cases,
people workout for 3-4.9 hours per week. Most of the people exercise for 1-6.9 hours per week. There are very few cases where
individuals workout for 7 or more hours.
Paraphrase This Document
Need a fresh take? Get an instant paraphrase of this document with our AI Paraphraser

4INTRODUCTION TO STATISTICAL TESTS AND DATA VISUALIZATION
The line graph shows that maximum number of cases have 3-4.9 hours for exercise per week. There are very few cases
where an individual does not workout at all or exercises for 7 or more hours per week.
The line graph shows that maximum number of cases have 3-4.9 hours for exercise per week. There are very few cases
where an individual does not workout at all or exercises for 7 or more hours per week.

5INTRODUCTION TO STATISTICAL TESTS AND DATA VISUALIZATION
Answer 3
Distribution of BMI levels based on education group
Here a comparative bar chart has been drawn to show the frequency distribution of Pre-BMI levels according to different
education groups. There are 6 levels of BMI from underweight to extreme obesity and three groups of education-.
The graph shows that frequency of overweight is maximum for both AD/BSN and MSN/MN group. Most of the people
having PHD/DNP degree are exposed to first level of obesity.
Answer 4
Proportion of BMI groups
The proportion of different BMI groups has been shown by a pie chart.
From the pie chart, it can be observed that maximum individuals are having overweight, covering 38.33% of the population
under study.33.89% people have normal weight. 16.67% people have first level obesity and 7.22% have extreme obesity. Only
3.89% persons have second level obesity.
⊘ This is a preview!⊘
Do you want full access?
Subscribe today to unlock all pages.

Trusted by 1+ million students worldwide

6INTRODUCTION TO STATISTICAL TESTS AND DATA VISUALIZATION
Paraphrase This Document
Need a fresh take? Get an instant paraphrase of this document with our AI Paraphraser

7INTRODUCTION TO STATISTICAL TESTS AND DATA VISUALIZATION
Bibliography
Hinton, P. R. (2014). Statistics explained. Routledge.
Plonsky, L. (2015). Statistical power, p values, descriptive statistics, and effect sizes: A “back-to-basics” approach to advancing quantitative
methods in L2 research. In Advancing quantitative methods in second language research (pp. 23-45). Routledge.
1 out of 8
Related Documents
Your All-in-One AI-Powered Toolkit for Academic Success.
+13062052269
info@desklib.com
Available 24*7 on WhatsApp / Email
Unlock your academic potential
Copyright © 2020–2025 A2Z Services. All Rights Reserved. Developed and managed by ZUCOL.


