Data Analysis and Assumptions: A Report on Statistical Testing

Verified

Added on  2023/06/15

|28
|2031
|479
Report
AI Summary
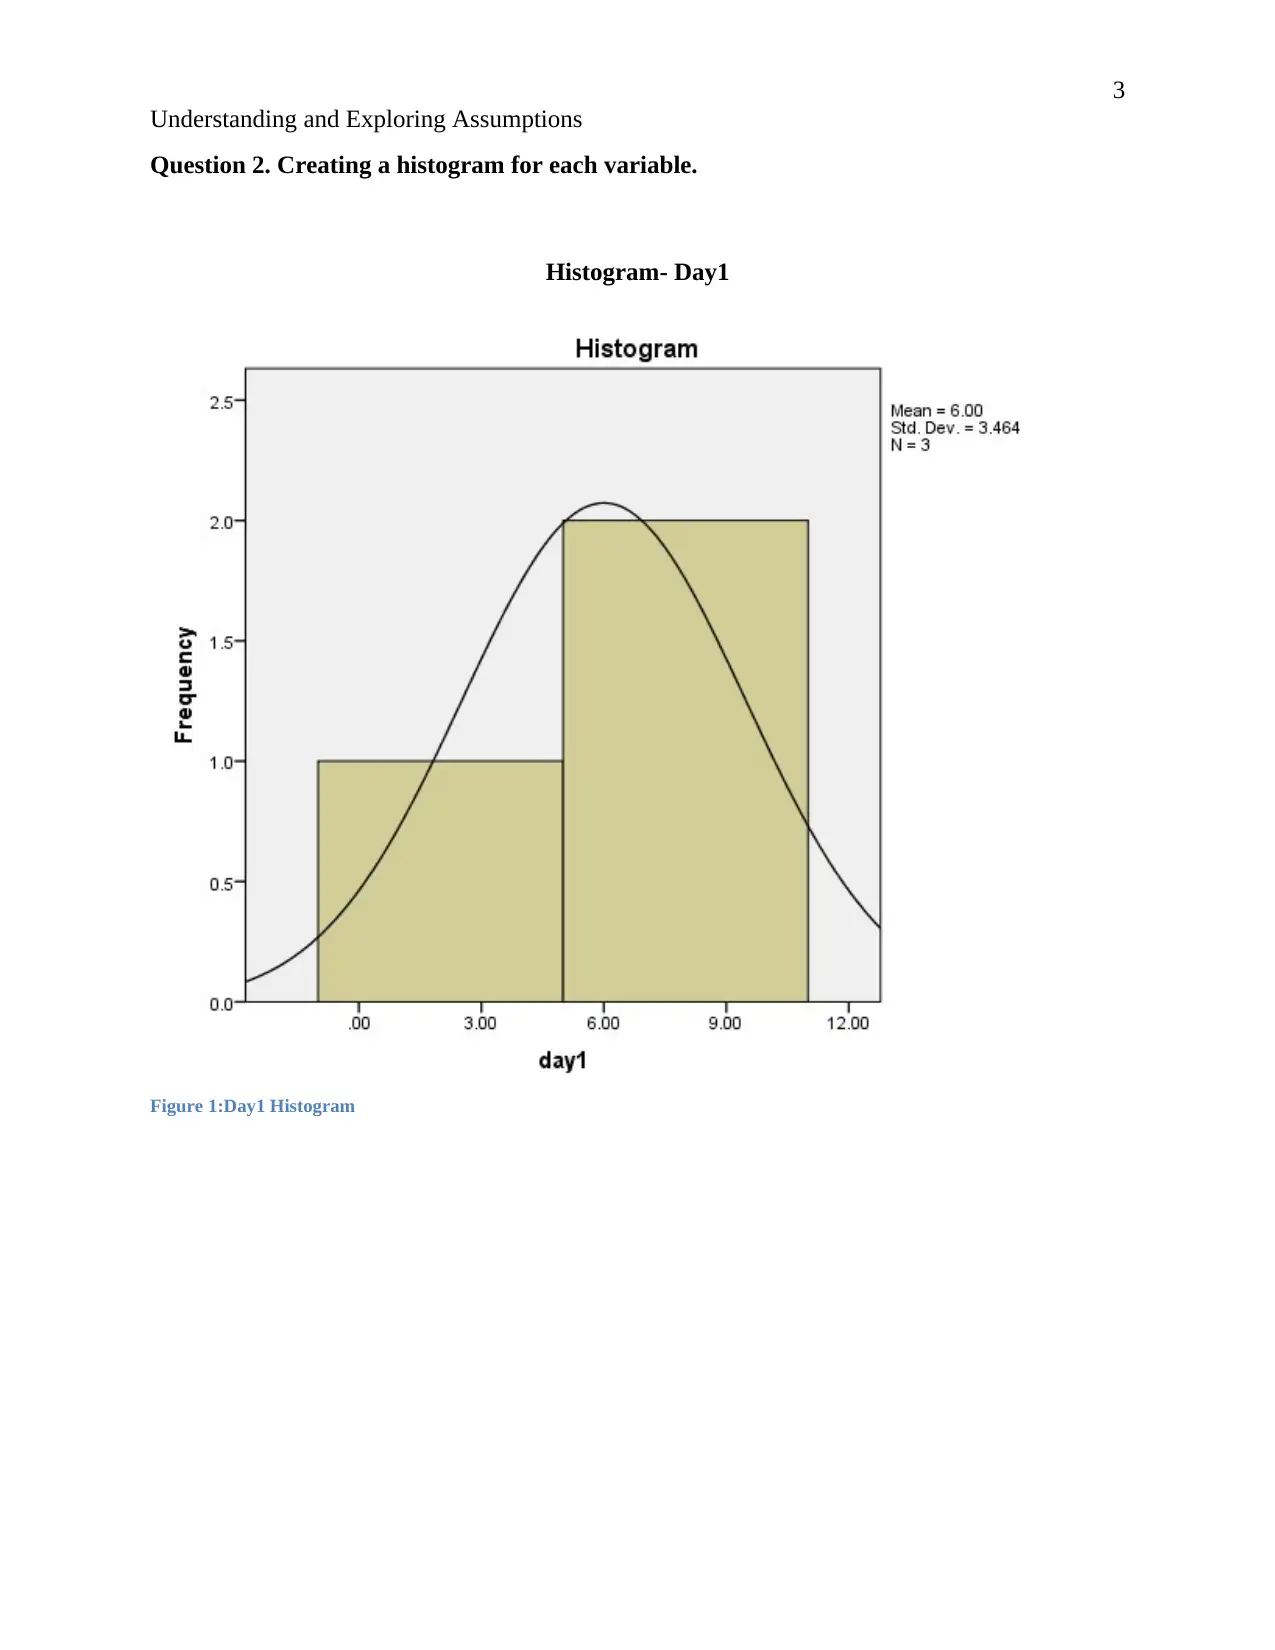
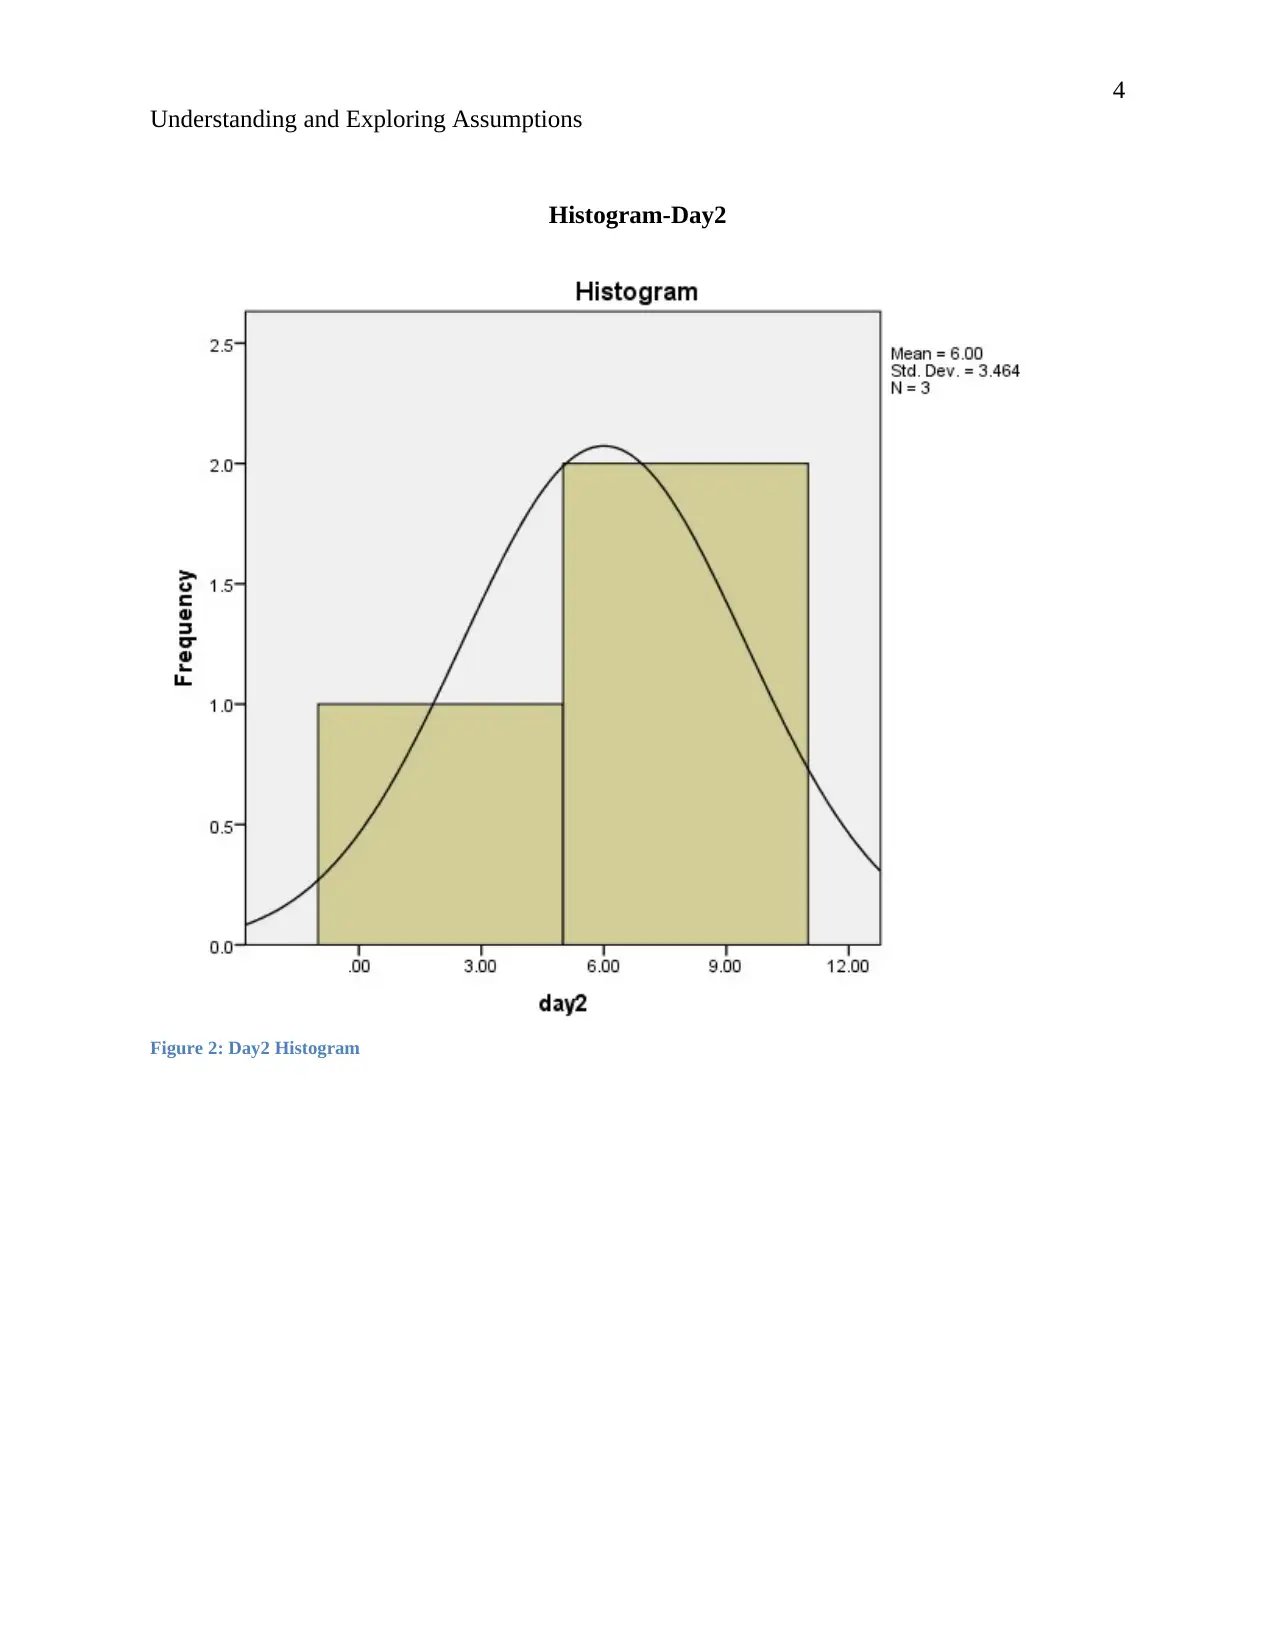
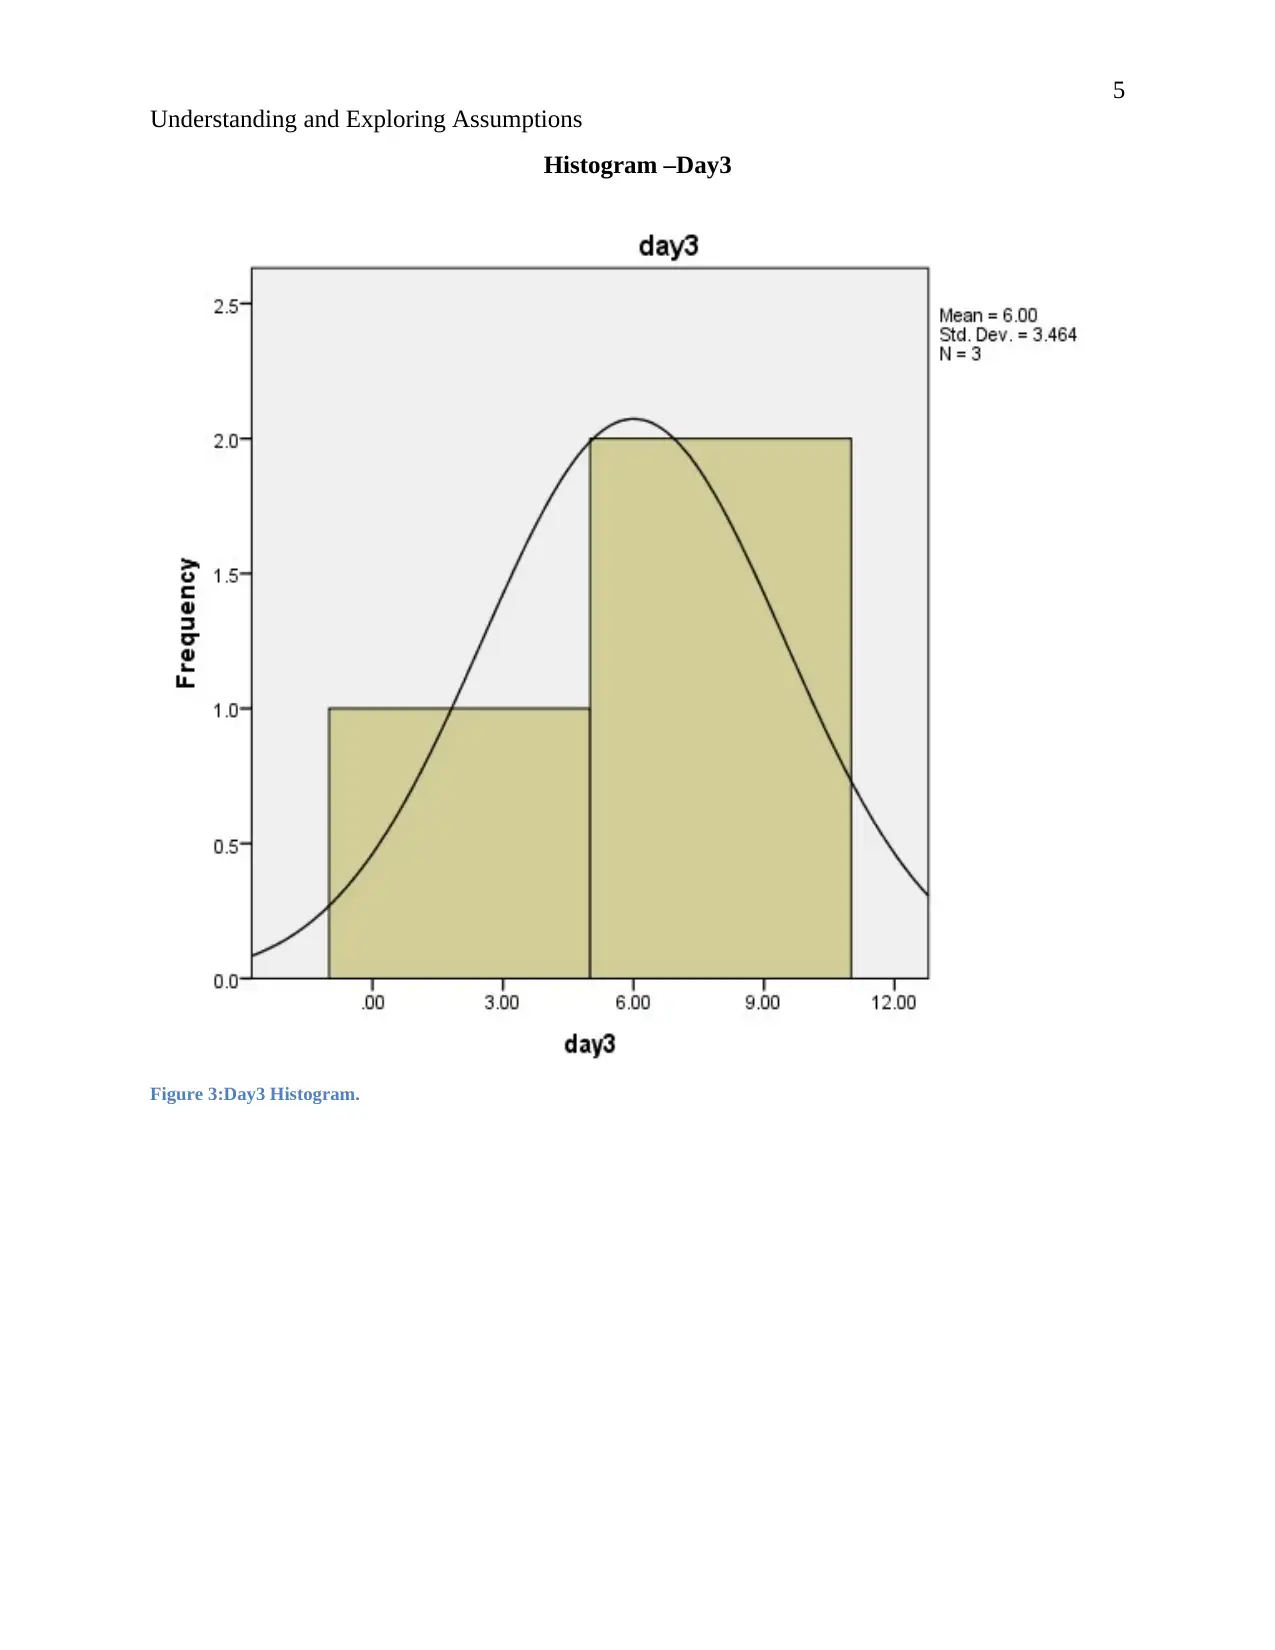
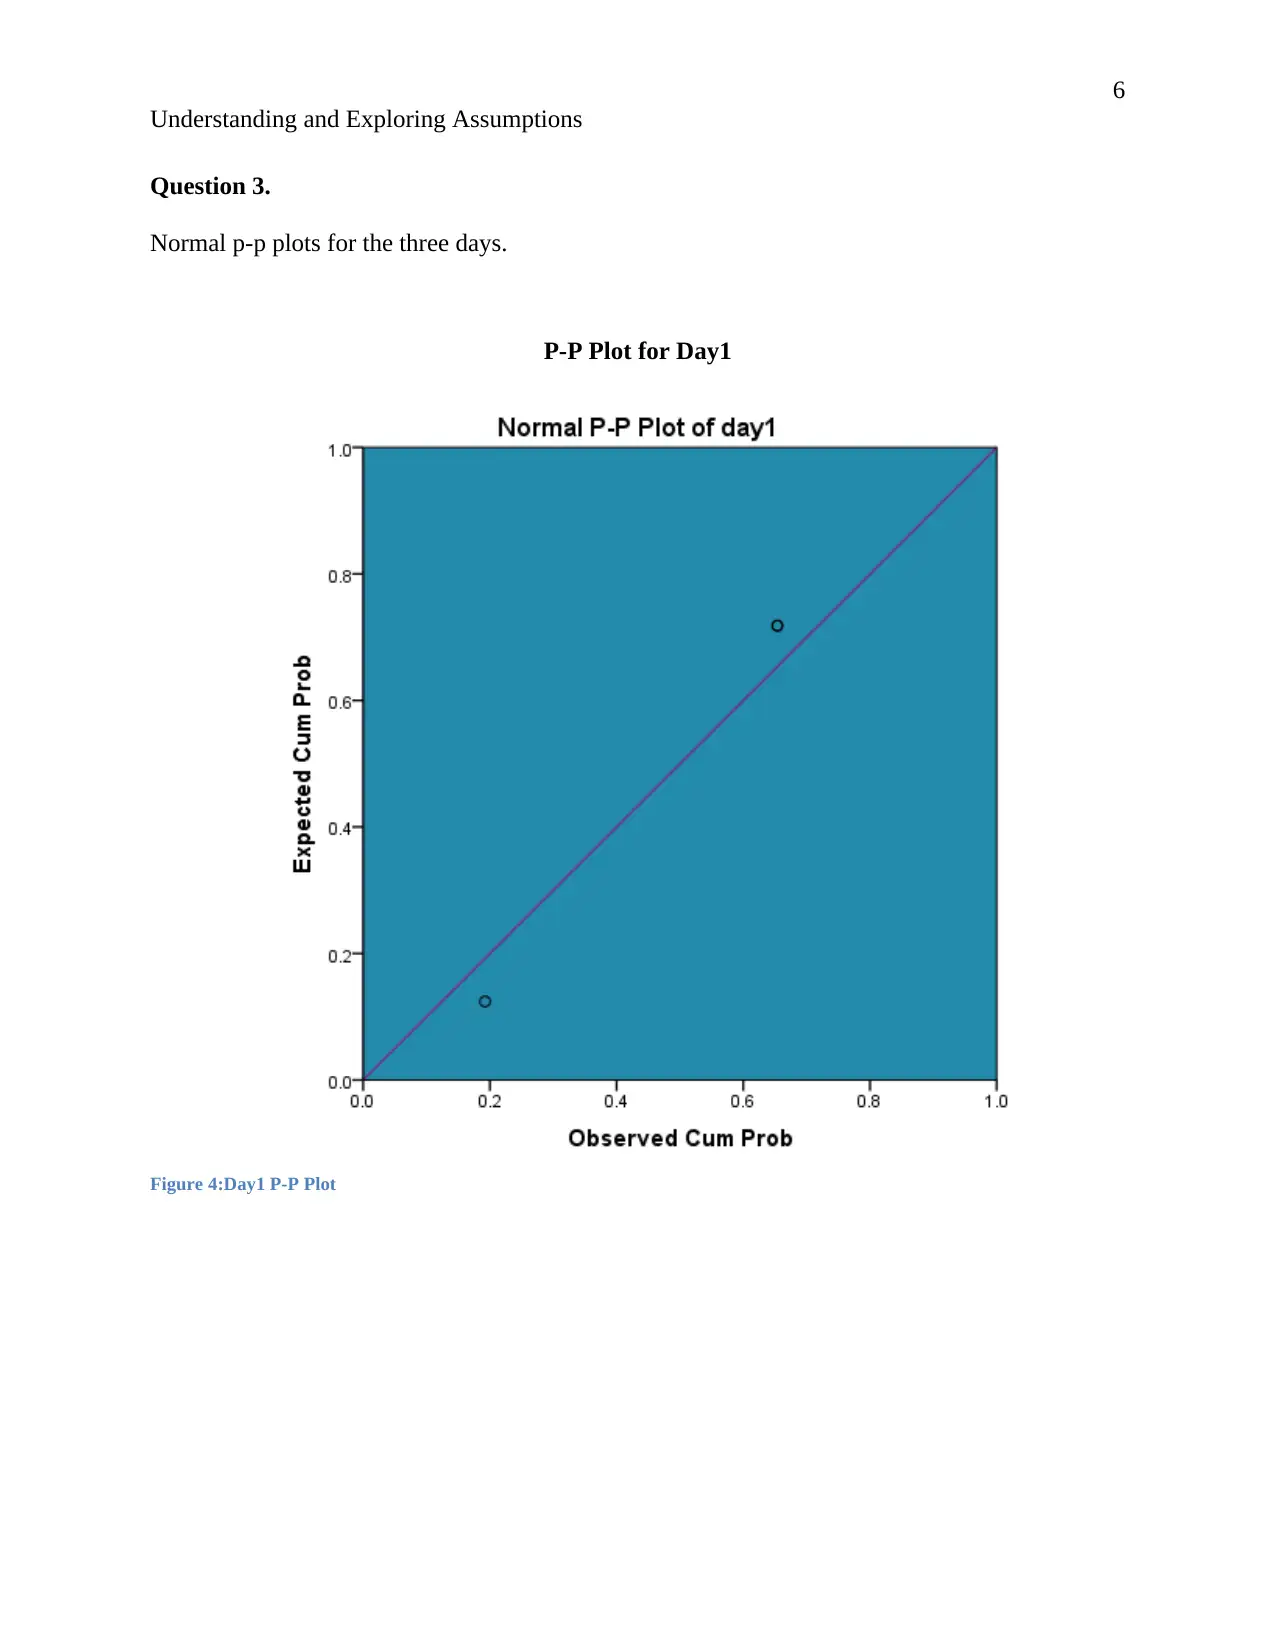
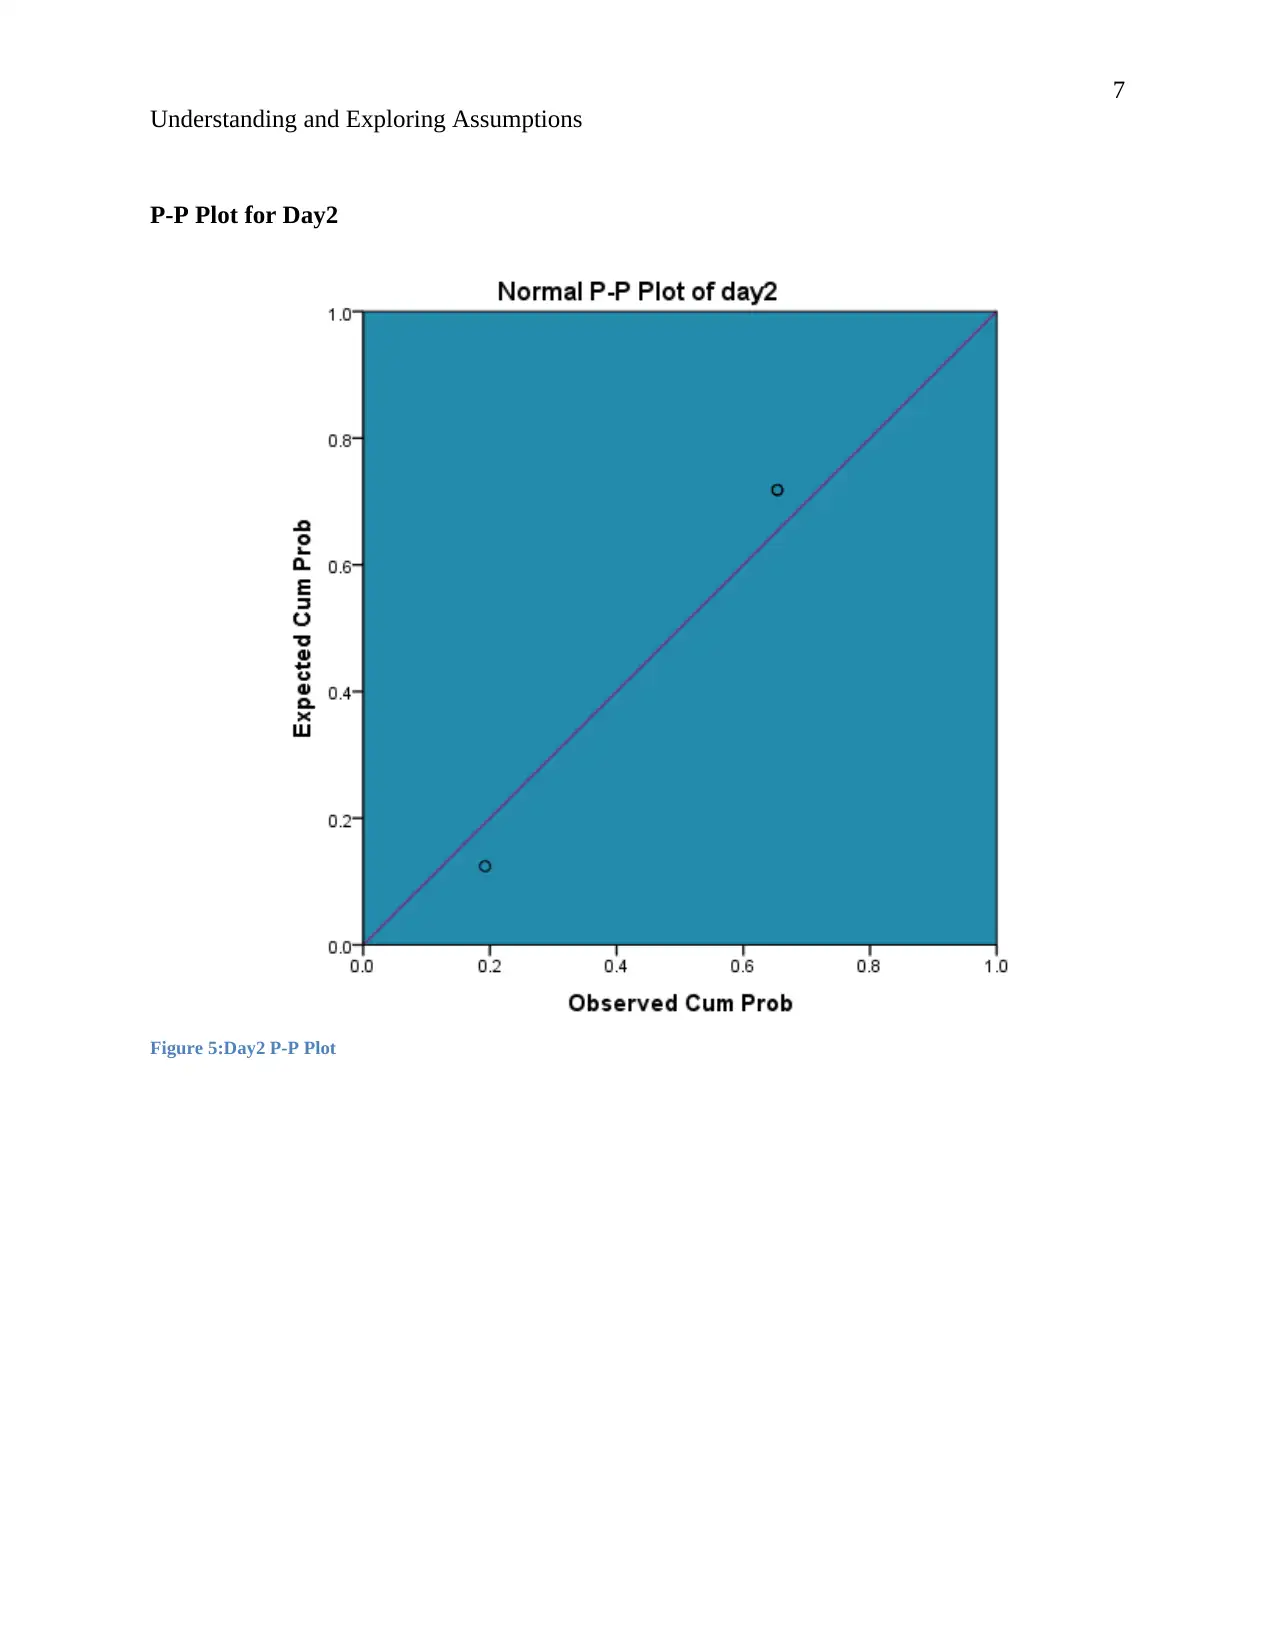
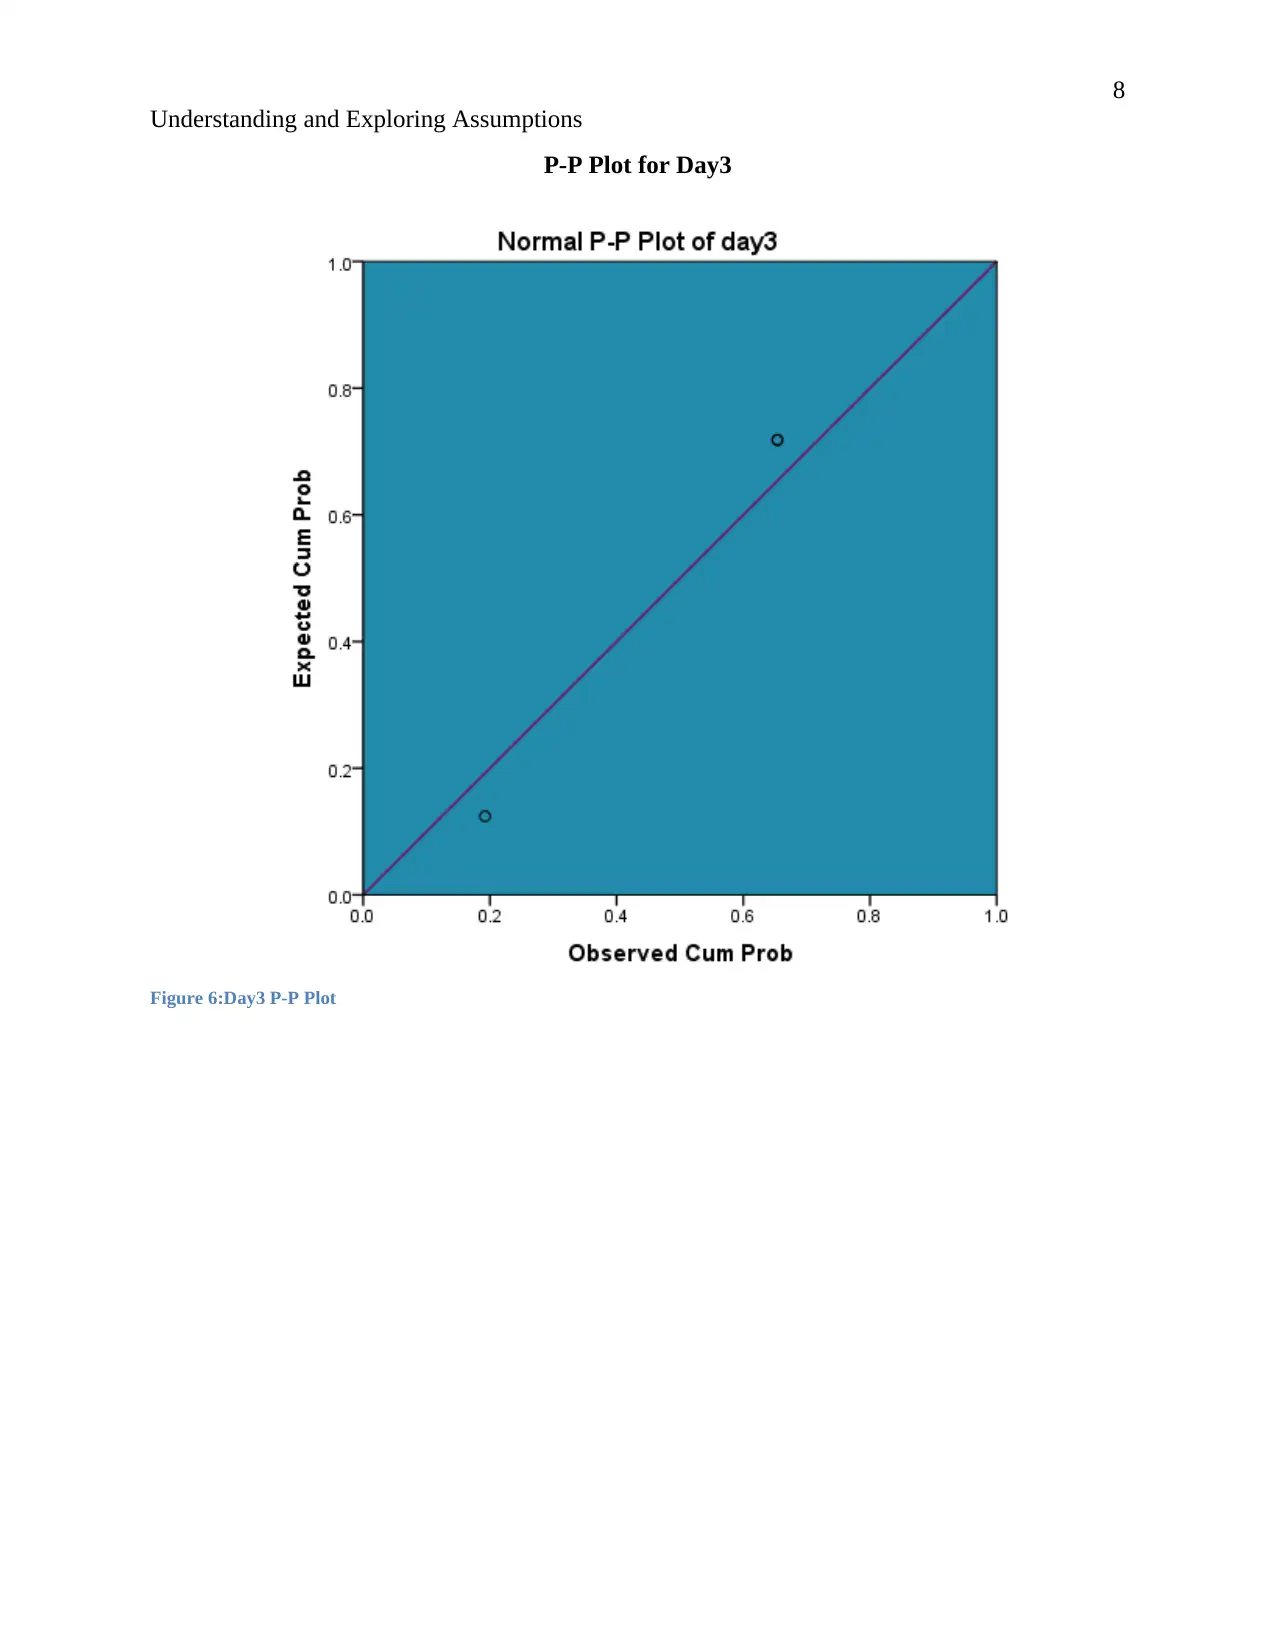
This report delves into the critical role of assumptions in statistical testing, emphasizing the importance of meeting these assumptions for accurate data analysis. It addresses key assumptions such as normality, homogeneity of variances, linearity, and independence, highlighting the potential for misleading or erroneous results when these assumptions are violated. The report includes histograms and P-P plots for three days of data, assessing the normality of each day's distribution and exploring measures of central tendency, skewness, and kurtosis. Furthermore, it examines a dataset related to computer exams, lecturer evaluations, and literacy scores, grouped by university, to test for homogeneity of variances using Levene's statistic. The report concludes by underscoring the impact of unmet assumptions on statistical test conclusions and the reliability of analysis outcomes. Desklib provides access to this and other solved assignments for students.
Document Page
1
RUNNINGHEAD: Understanding and Exploring Assumptions
Question 1. Why meeting of assumptions for a statistical test is important.
According to Charles Zaiontz ”…most of the statistical tests we perform are based on a set of
assumptions. When these assumptions are violated the results of the analysis can be misleading
or completely erroneous…” Most often the tests that assumptions during statistical tests carried
out include: (Charles 2015).
i. Assumption of normality.(Data is symmetrical)
ii. Homogeneity of variances. (Variance is the same for data)
iii. Linearity.( Tested data has linear relationships)
iv. Independence. (Tested data is independent).
Many statistical tests have assumptions that must be met in order to ensure that the data
collected is appropriate for the types of analyses you want to conduct. Common assumptions that
must be met for parametric statistics include normality, independence, linearity, and
homoscedasticity. Failure to meet these assumptions, among others, can result in inaccurate
results, which are problematic for many reasons. When testing hypotheses, running analyses on
data that has violated the assumptions of the statistical test can result in both false negatives and
false positives, depending on the particular assumption violated.” (Elite research 2012). This is
against the very aim of carrying out the statistical analysis which whose main reason is to ensure
that correct assumptions are met, analysis done, output interpreted and the results put into
importance. Failing to meet assumptions, results to misguided analysis and eventually inaccurate
interpretation.
tabler-icon-diamond-filled.svg

Paraphrase This Document

Need a fresh take? Get an instant paraphrase of this document with our AI Paraphraser
Document Page
2
Understanding and Exploring Assumptions
However in any statistical test, the assumptions may fail to be met, this calls for scrutiny and
accuracy in the whole process. This can be done, according to Lund research limited through
following the basic steps of:
i. Understand the required assumptions.
ii. Check whether the assumptions are met.
iii. Find solutions if assumptions are not met. (laerd statistics 2013).
Document Page
3
Understanding and Exploring Assumptions
Question 2. Creating a histogram for each variable.
Histogram- Day1
Figure 1:Day1 Histogram
Document Page
4
Understanding and Exploring Assumptions
Histogram-Day2
Figure 2: Day2 Histogram
tabler-icon-diamond-filled.svg

Paraphrase This Document

Need a fresh take? Get an instant paraphrase of this document with our AI Paraphraser
Document Page
5
Understanding and Exploring Assumptions
Histogram –Day3
Figure 3:Day3 Histogram.
Document Page
6
Understanding and Exploring Assumptions
Question 3.
Normal p-p plots for the three days.
P-P Plot for Day1
Figure 4:Day1 P-P Plot
Document Page
7
Understanding and Exploring Assumptions
P-P Plot for Day2
Figure 5:Day2 P-P Plot
tabler-icon-diamond-filled.svg

Paraphrase This Document

Need a fresh take? Get an instant paraphrase of this document with our AI Paraphraser
Document Page
8
Understanding and Exploring Assumptions
P-P Plot for Day3
Figure 6:Day3 P-P Plot
Document Page
9
Understanding and Exploring Assumptions
Question 4. Description of the downloadfestival dataset with attention towards normality.
Day 1.
According to PQ systems “A second characteristic of the normal distribution is that it is
symmetrical. This means that if the distribution is cut in half, each side would be the mirror
of the other. It also must form a bell-shaped curve to be normal…”(PQsystems 2016). In the
day1 data the normal curve is bell shaped and the histogram is symmetric, this shows that the
data is normally distributed. Also the distribution on the p-p plot indicates that the data is
evenly distributed over the range. Hence we can say with certainty that the data for day one
follows a normal distribution.
Day2.
The normal curve of day 2 is bell shaped. This implies that the data is symmetrical as seen
from the histogram. Observing the p-p plot the data is even place along the regression line.
This indicates that the data follows a normal distribution.
Day3
In day three the p-p plot indicates that the residuals are evenly distributed over and below the
regression line. The normal curve is also bell shaped. Hence the data is symmetrical implying
that it follows a normal distribution.
Document Page
10
Understanding and Exploring Assumptions
Question 5
Exploring measures of central tendencies.
Statistics
day1 day2 day3
N Valid 3 3 3
Missing 7 7 7
Mean 6.00 6.00 6.00
Std. Error of Mean 2.000 2.000 2.000
Median 8.00 8.00 8.00
Mode 8 8 8
Std. Deviation 3.464 3.464 3.464
Variance 12.000 12.000 12.000
Skewness -1.732 -1.732 -1.732
Std. Error of Skewness 1.225 1.225 1.225
Range 6 6 6
Minimum 2 2 2
Maximum 8 8 8
Sum 18 18 18
Calculating z-scores for skewness and Kurtosis
Descriptive Statistics
N Mean Skewness Kurtosis
Statistic Statistic Statistic Std. Error Statistic Std. Error
day1 3 6.00 -1.732 1.225 . .
day2 3 6.00 -1.732 1.225 . .
day3 3 6.00 -1.732 1.225 . .
Valid N (listwise) 3
The values for skewness and kurtosis between -2 and +2 are considered acceptable in order to
prove normal univariate distribution…” (Research gate 2015).
Therefore given our skewness value of between -1.732 and 1.225 for day1, day2, day3 we
assume that the data follows a normal distribution.
tabler-icon-diamond-filled.svg

Paraphrase This Document

Need a fresh take? Get an instant paraphrase of this document with our AI Paraphraser
Document Page
11
Understanding and Exploring Assumptions
These imply that the assumptions in question 1 are met.
Question6
Statistics
Computer Exam Lecturer Literacy
N Valid 99 99 99 99
Missing 0 0 0 0
Mean 58.51 50.68 59.611 4.83
Std. Error of Mean 2.114 .834 2.1850 .272
Median 60.00 51.00 62.000 4.00
Mode 72a 54 48.5a 4
Std. Deviation 21.034 8.295 21.7402 2.711
Variance 442.416 68.813 472.635 7.348
Skewness -.099 -.162 -.405 .985
Std. Error of Skewness .243 .243 .243 .243
Kurtosis -1.112 .338 -.193 .987
Std. Error of Kurtosis .481 .481 .481 .481
Range 84 46 92.0 13
Minimum 15 27 8.0 1
Maximum 99 73 100.0 14
Sum 5792 5017 5901.5 478
a. Multiple modes exist. The smallest value is shown
Document Page
12
Understanding and Exploring Assumptions
chevron_up_icon
1 out of 28
circle_padding
hide_on_mobile
zoom_out_icon
[object Object]