Statistical Analysis of Non-Parametric Tests: Examples and Results

Verified

Added on  2022/11/01

|9
|1403
|166
Practical Assignment
AI Summary
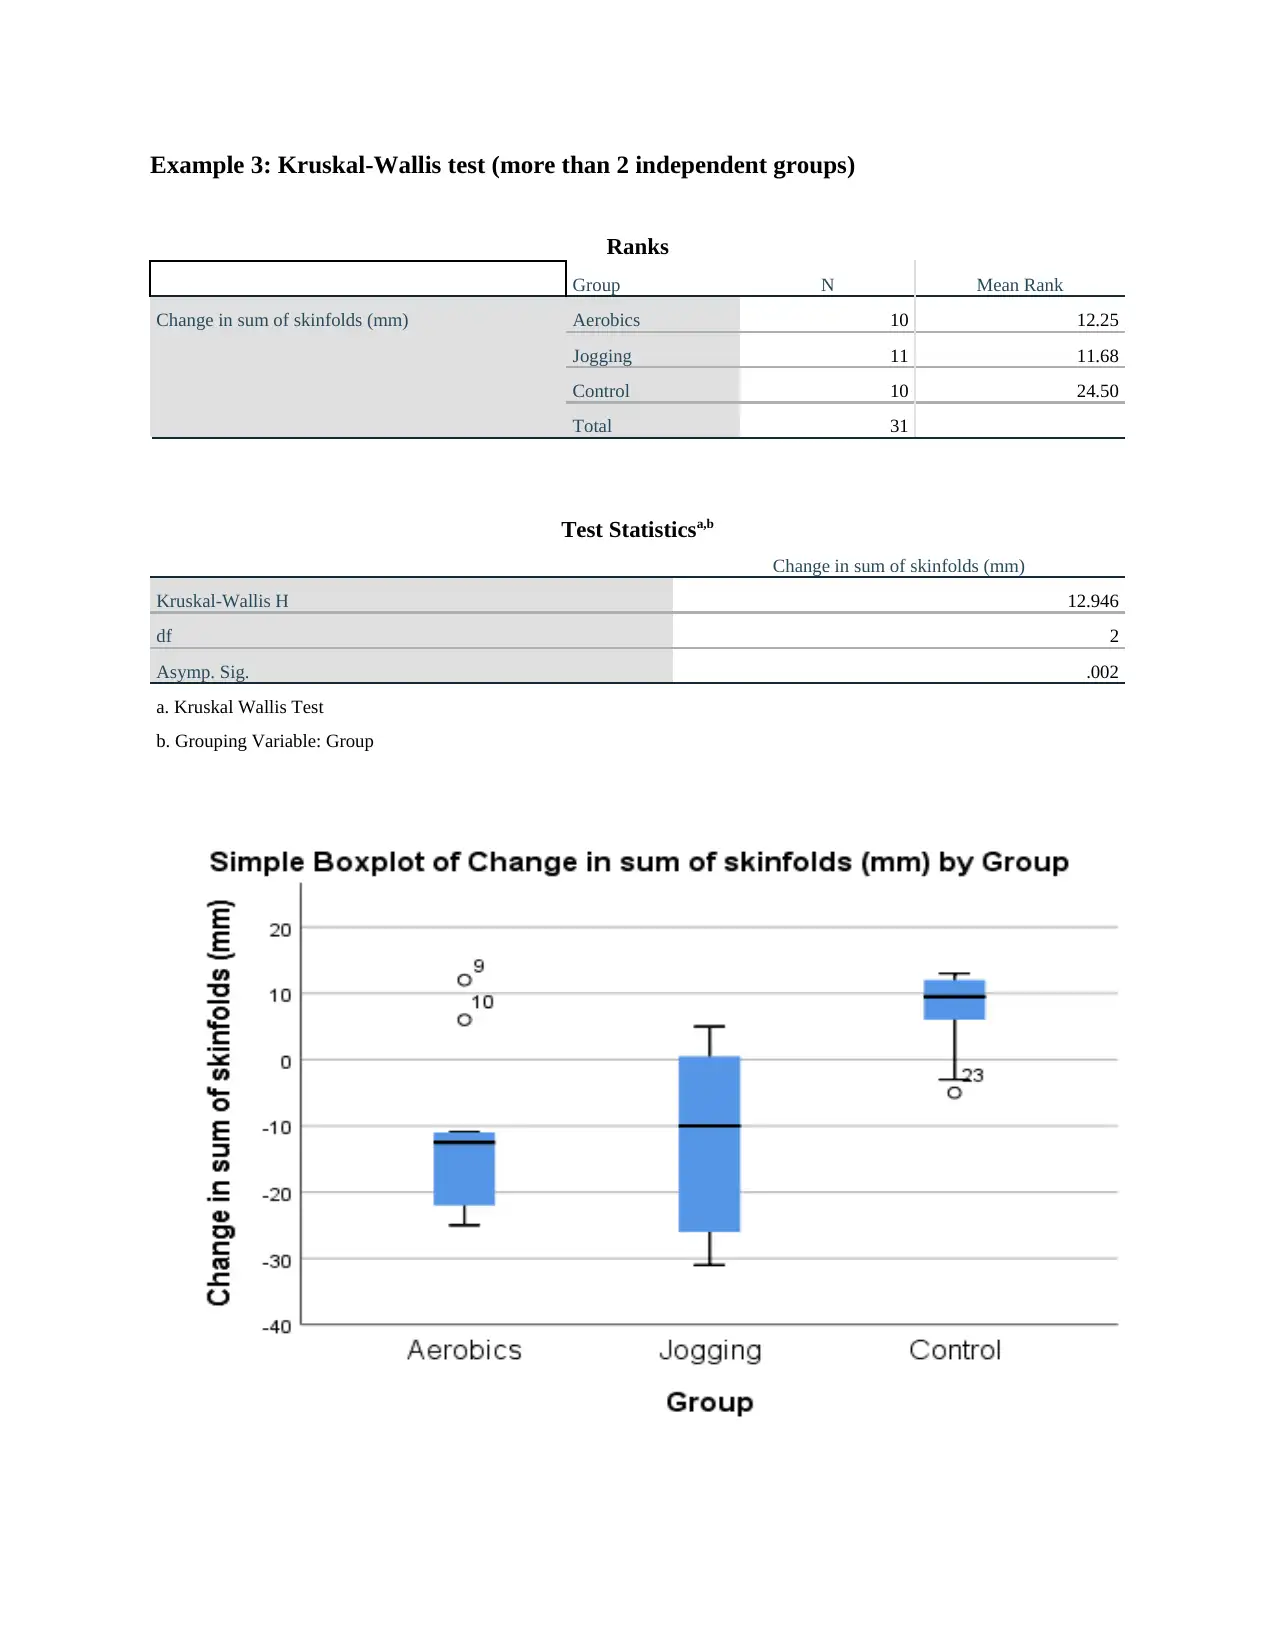
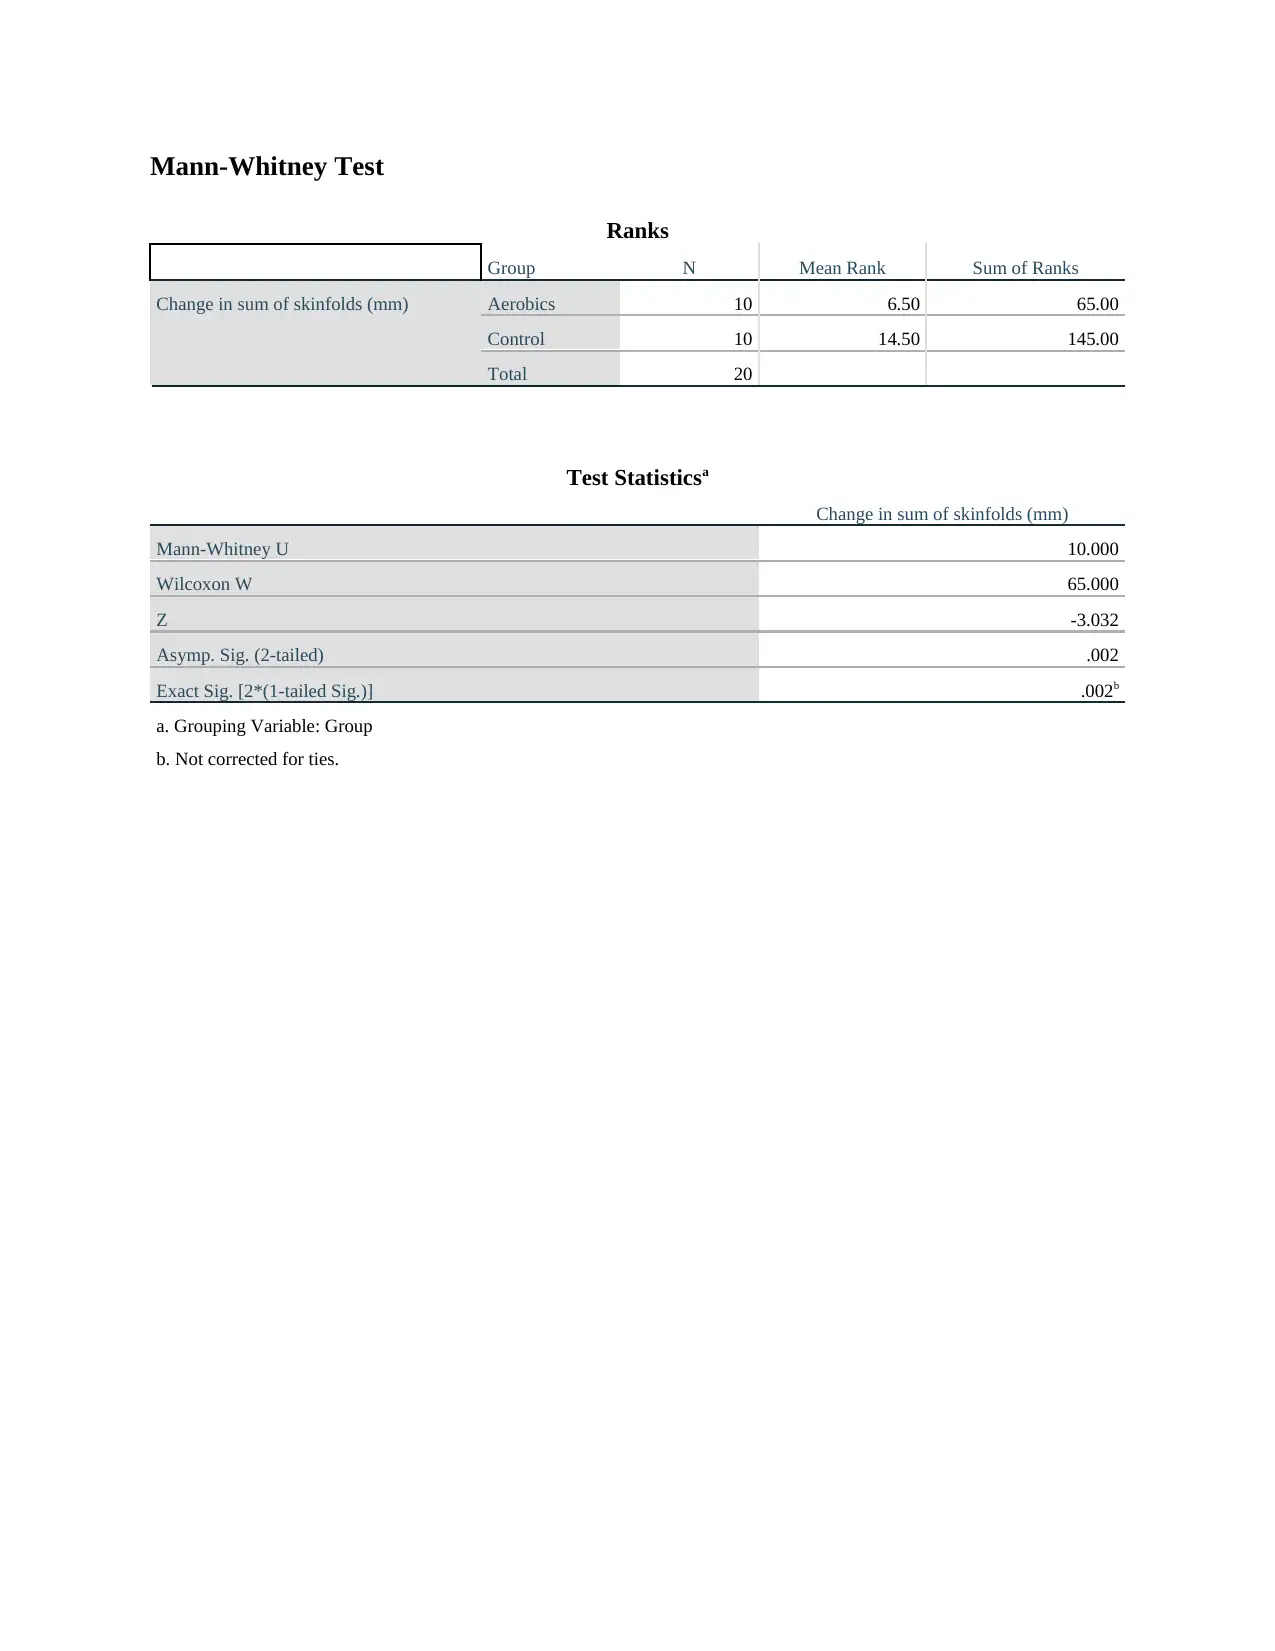
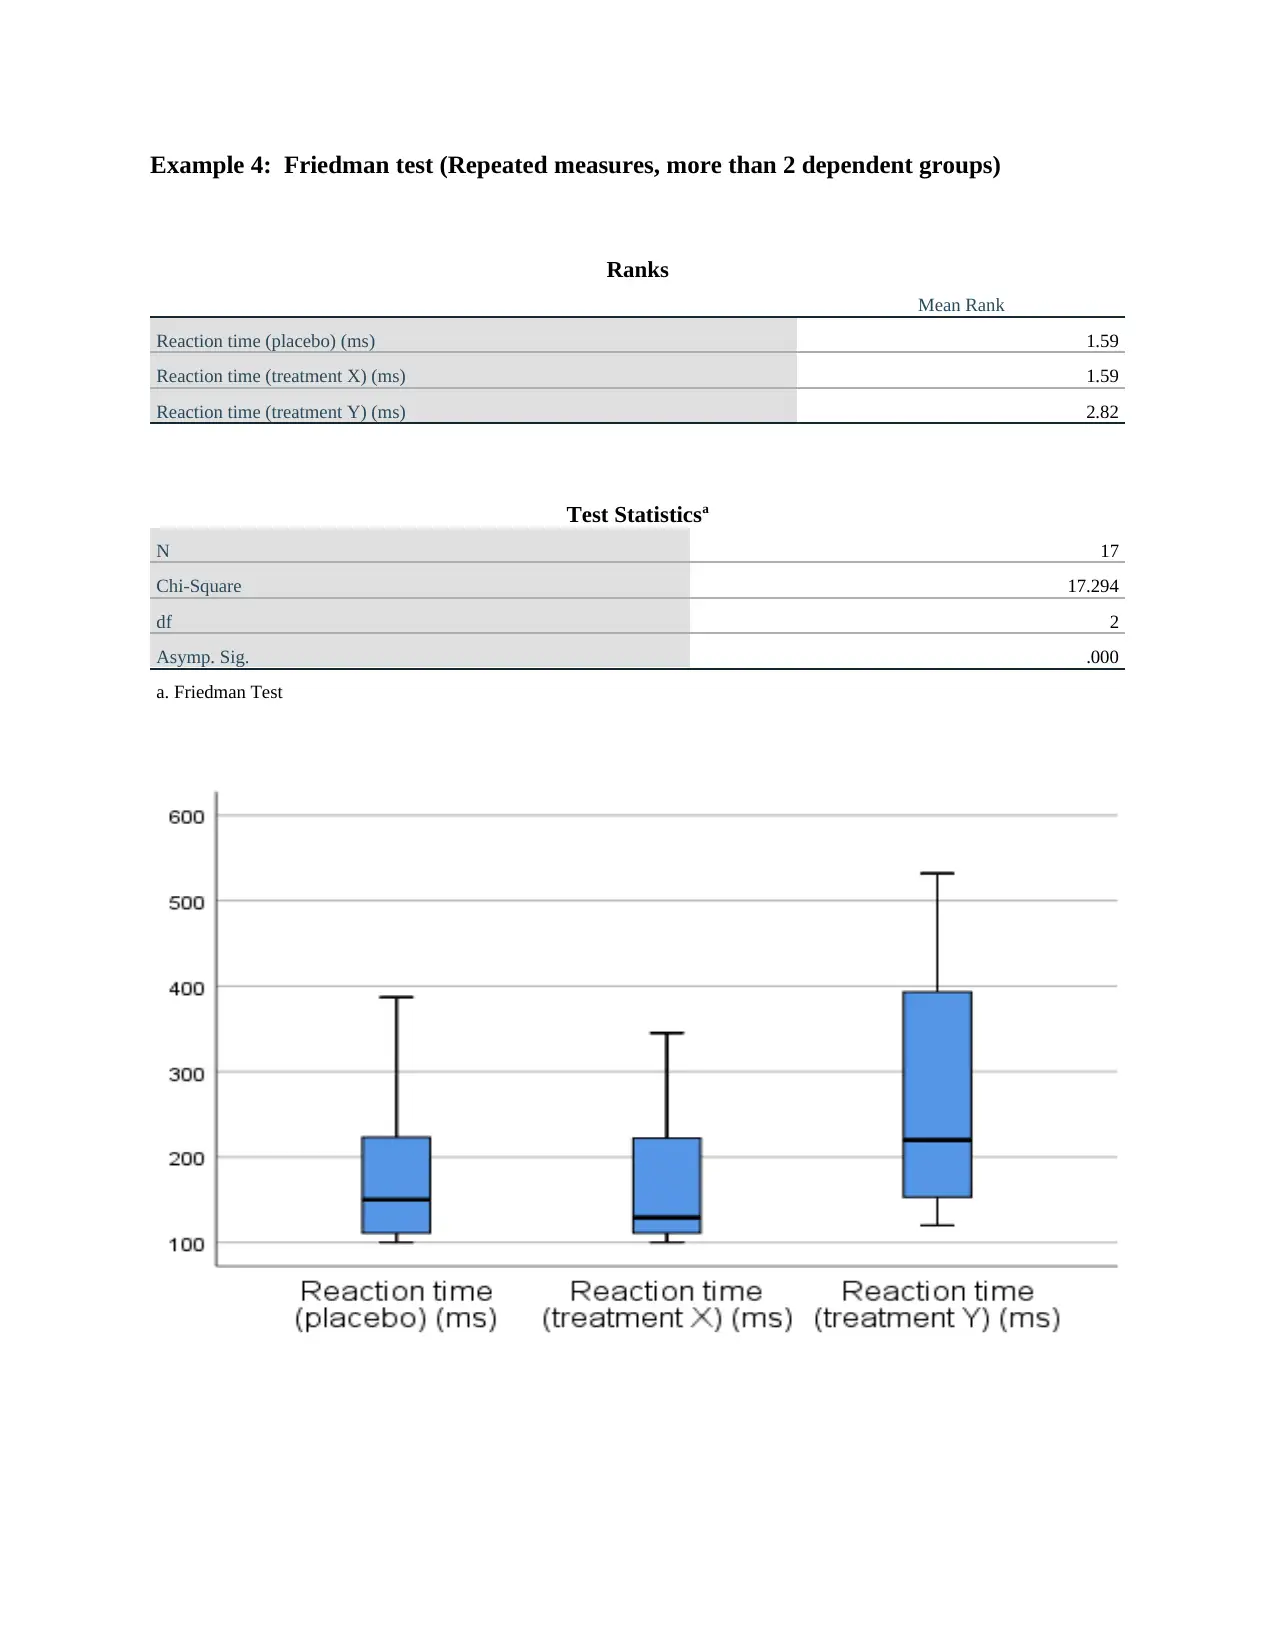
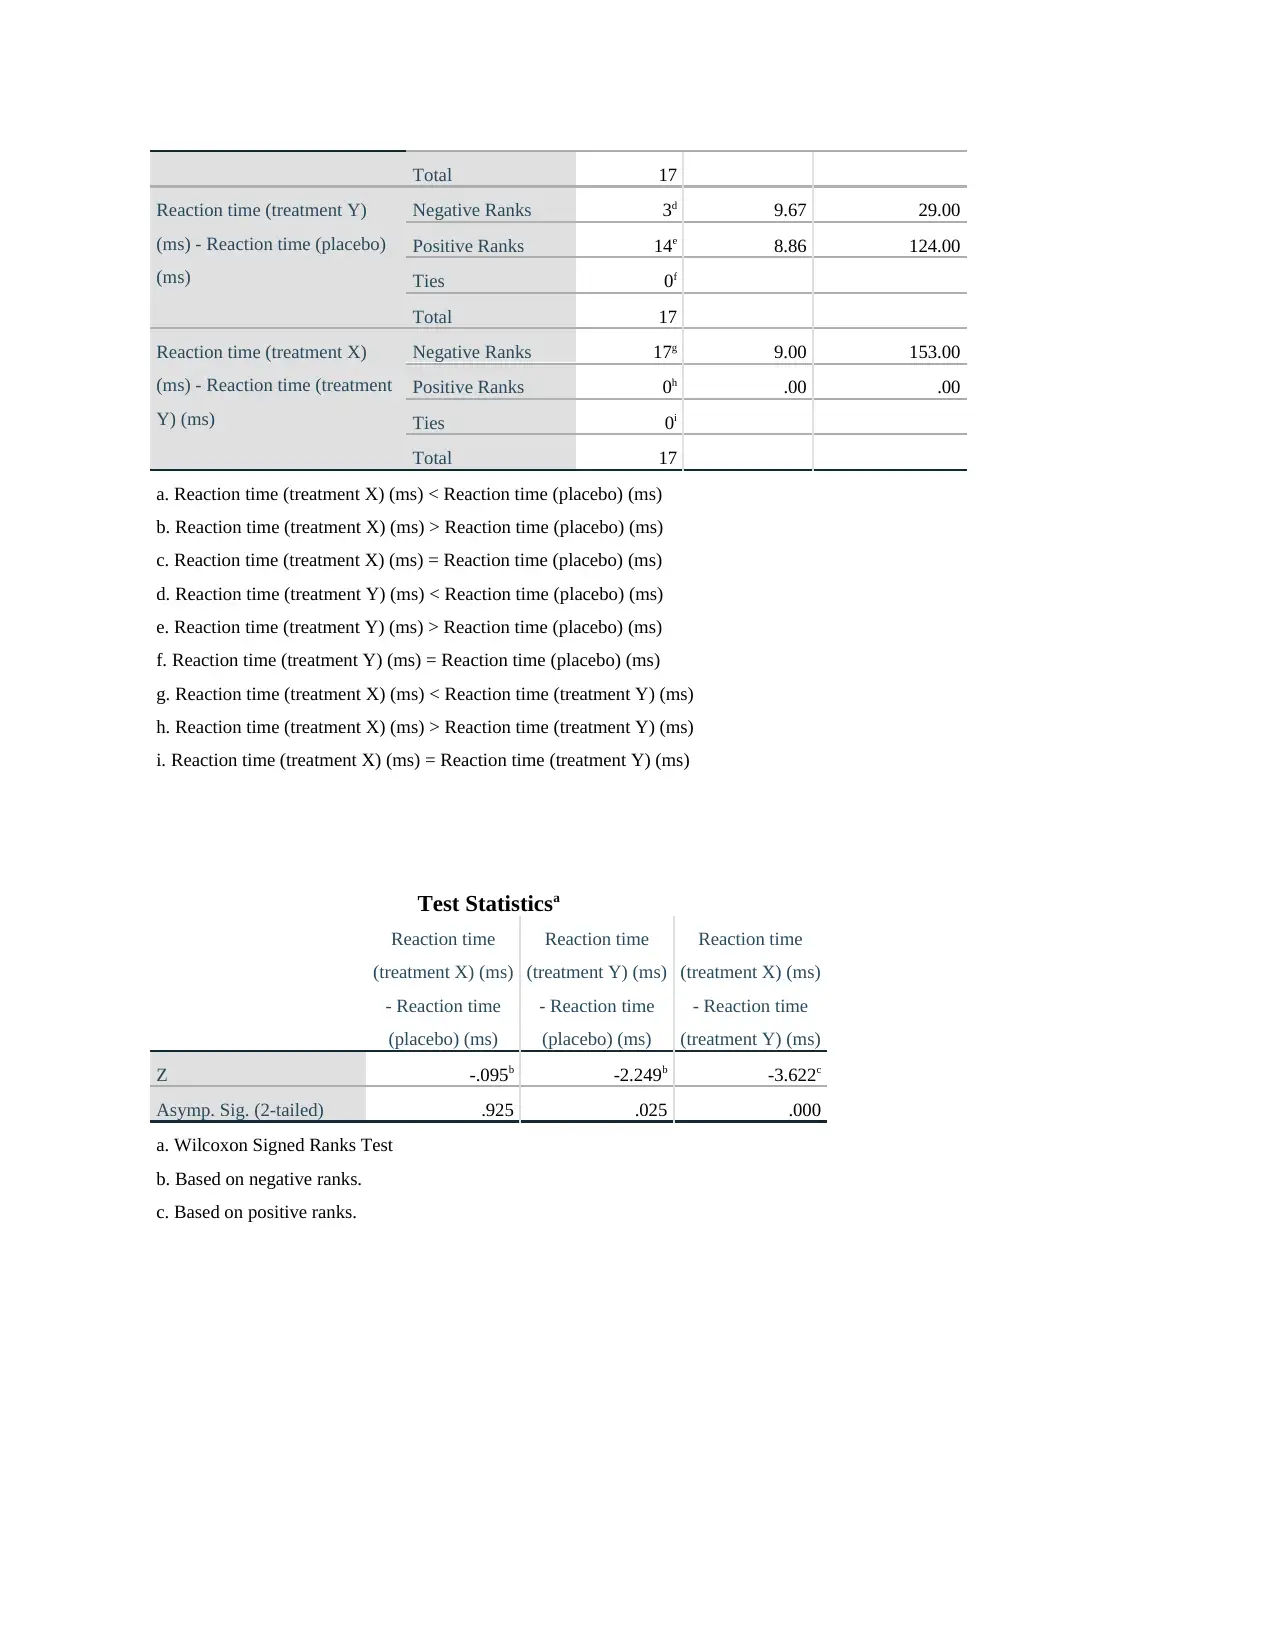
This assignment presents four examples of non-parametric statistical tests, illustrating their application and interpretation. The first example uses the Mann-Whitney U test to compare the diagnosis times of experienced and novice podiatrists, demonstrating the rejection of the null hypothesis due to a significant difference in observation times. The second example employs the Wilcoxon signed-rank test to assess the effectiveness of a new mobilization treatment on ankle range of motion, showing an improvement in range of movement after the program. The third example applies the Kruskal-Wallis test to compare changes in skinfold measurements across three groups (aerobics, jogging, and control), revealing a significant difference between the groups. Finally, the fourth example utilizes the Friedman test to analyze reaction times under different treatment conditions (placebo, treatment X, and treatment Y), indicating significant differences in reaction times among the treatments. Each example includes relevant statistical output, such as mean ranks, test statistics, and significance levels, to support the conclusions drawn about the data.
Document Page
Mann-Whitney U-test
Example 1: Mann-Whitney U test (2 independent samples) A researcher wants to test the
hypothesis that experienced podiatrists require less time than novices to make a particular
diagnosis. A group of experienced podiatrists is compared with a group of novices. Both groups
observe the same individuals. The data are stored in the SPSS file ‘Mann-Whitney.sav’. The two
variables are Obstime (time in seconds for the observer to make a diagnosis), and Experience (a
grouping variable denoting the experience of the observer). Should the researcher accept or reject
the hypothesis?
Test for normality
Table1: Descriptive analysis for Obstime time for novice and expert groups
Descriptive
Experience of observer Statistic Std. Error
Observation time to diagnosis Novice Mean 136.27 4.942
95% Confidence Interval for
Mean
Lower Bound 125.26
Upper Bound 147.28
5% Trimmed Mean 134.75
Median 136.00
Variance 268.618
Std. Deviation 16.390
Minimum 120
Maximum 180
Range 60
Interquartile Range 16
Skewness 2.064 .661
Kurtosis 5.463 1.279
Expert Mean 99.18 8.070
95% Confidence Interval for
Mean
Lower Bound 81.20
Upper Bound 117.16
5% Trimmed Mean 101.31
Median 110.00
Variance 716.364
Std. Deviation 26.765
Minimum 40
Maximum 120
Range 80
Interquartile Range 33
tabler-icon-diamond-filled.svg

Paraphrase This Document

Need a fresh take? Get an instant paraphrase of this document with our AI Paraphraser
Document Page
Skewness -1.499 .661
Kurtosis 1.310 1.279
From the analysis the skewness value for the novice group is given as 2.604 and a standard error
of 0.661. The quotient between the skewness and the standard error for the skewness i.e.
2.604/0.66 = 3.122, which is not present in range of -1.96 – 1.96, hence suggesting that the
novice Obstime measures are skewed. The skewness value for expert group is -1.49 with a
standard error of 0.661. The quotient value for the two statistical parameters skewness and
standard error -1.499/0.661 = 2.267, hence indicating that the expert Obstime values are not
normally distributed.
Table 1.1: Mean ranks for native and experts groups
Ranks
Experience of observer N Mean Rank Sum of Ranks
Observation time to diagnosis Novice 11 16.91 186.00
Expert 11 6.09 67.00
Total 22
Table 1.3: Mann-Whitney U-test summary output
Test Statisticsa
Observation time to diagnosis
Mann-Whitney U 1.000
Wilcoxon W 67.000
Z -3.911
Asymp. Sig. (2-tailed) .000
Exact Sig. [2*(1-tailed Sig.)] .000b
a. Grouping Variable: Experience of observer
b. Not corrected for ties.
From the resulst presented in table 1.3 above, the Mann-Whitney U-test is given as U = 1, p <
0.01 hence suggest that the test is sigfnificant at 0.05 level of significance and the null hypothesis
is rejected. The conclsuion for the test state that there is a sigificant difference in the mean
Obstime time for native and expert groups in the survey.
Document Page
Figure 1: Boxplot summary output for native and expert Obstime time
Example 2: Wilcoxon matched pairs signed rank test
A sports physiotherapist investigating the effects of a new mobilization treatment regimen on range of
movement at the ankle, records before and after ranges of movement for a set of 15 female participants.
The data are contained in the SPSS data file ‘Wilcoxon.sav’. There are three variables, Before, After and
Diff, which are ankle range of motion (ROM) before the therapy, ankle ROM after therapy and change in
ankle ROM (after-before).
The research hypothesis for the test are given as follows
H0: The two underlying populations are equivalent
H1: The two underlying populations are not equivalent.
Document Page
Table 2: Mean ranks summary output
Ranks
N Mean Rank Sum of Ranks
Ankle ROM - after - Ankle
ROM - before
Negative Ranks 2a 10.75 21.50
Positive Ranks 13b 7.58 98.50
Ties 0c
Total 15
a. Ankle ROM - after < Ankle ROM - before
b. Ankle ROM - after > Ankle ROM - before
c. Ankle ROM - after = Ankle ROM - before
Table 2.1: Wilcoxon test summary output
Test Statisticsa
Ankle ROM - after - Ankle ROM - before
Z -2.187b
Asymp. Sig. (2-tailed) .029
a. Wilcoxon Signed Ranks Test
b. Based on negative ranks.
The primary objective of the study is to investigate if the program has improved the range of
movement. From the results presented in table 2.1 above, the Wilcoxon value z = -2.187, p <0.05
hence the test is significant at 0.05 level of significance. The test indicate that the two underlying
populations are not equivalent, hence the program has either improved or decreased the range of
movement. From the analysis the mean rank after the program increased hence suggesting an
improvement in the range of movement.
Figure 2: Error plot summary output
tabler-icon-diamond-filled.svg

Paraphrase This Document

Need a fresh take? Get an instant paraphrase of this document with our AI Paraphraser
Document Page
Example 3: Kruskal-Wallis test (more than 2 independent groups)
Ranks
Group N Mean Rank
Change in sum of skinfolds (mm) Aerobics 10 12.25
Jogging 11 11.68
Control 10 24.50
Total 31
Test Statisticsa,b
Change in sum of skinfolds (mm)
Kruskal-Wallis H 12.946
df 2
Asymp. Sig. .002
a. Kruskal Wallis Test
b. Grouping Variable: Group
Document Page
Mann-Whitney Test
Ranks
Group N Mean Rank Sum of Ranks
Change in sum of skinfolds (mm) Aerobics 10 6.50 65.00
Control 10 14.50 145.00
Total 20
Test Statisticsa
Change in sum of skinfolds (mm)
Mann-Whitney U 10.000
Wilcoxon W 65.000
Z -3.032
Asymp. Sig. (2-tailed) .002
Exact Sig. [2*(1-tailed Sig.)] .002b
a. Grouping Variable: Group
b. Not corrected for ties.
Document Page
Example 4: Friedman test (Repeated measures, more than 2 dependent groups)
Ranks
Mean Rank
Reaction time (placebo) (ms) 1.59
Reaction time (treatment X) (ms) 1.59
Reaction time (treatment Y) (ms) 2.82
Test Statisticsa
N 17
Chi-Square 17.294
df 2
Asymp. Sig. .000
a. Friedman Test
tabler-icon-diamond-filled.svg

Paraphrase This Document

Need a fresh take? Get an instant paraphrase of this document with our AI Paraphraser
Document Page
Ranks
N Mean Rank Sum of Ranks
Reaction time (treatment X)
(ms) - Reaction time (placebo)
(ms)
Negative Ranks 7a 10.64 74.50
Positive Ranks 10b 7.85 78.50
Ties 0c
Document Page
Total 17
Reaction time (treatment Y)
(ms) - Reaction time (placebo)
(ms)
Negative Ranks 3d 9.67 29.00
Positive Ranks 14e 8.86 124.00
Ties 0f
Total 17
Reaction time (treatment X)
(ms) - Reaction time (treatment
Y) (ms)
Negative Ranks 17g 9.00 153.00
Positive Ranks 0h .00 .00
Ties 0i
Total 17
a. Reaction time (treatment X) (ms) < Reaction time (placebo) (ms)
b. Reaction time (treatment X) (ms) > Reaction time (placebo) (ms)
c. Reaction time (treatment X) (ms) = Reaction time (placebo) (ms)
d. Reaction time (treatment Y) (ms) < Reaction time (placebo) (ms)
e. Reaction time (treatment Y) (ms) > Reaction time (placebo) (ms)
f. Reaction time (treatment Y) (ms) = Reaction time (placebo) (ms)
g. Reaction time (treatment X) (ms) < Reaction time (treatment Y) (ms)
h. Reaction time (treatment X) (ms) > Reaction time (treatment Y) (ms)
i. Reaction time (treatment X) (ms) = Reaction time (treatment Y) (ms)
Test Statisticsa
Reaction time
(treatment X) (ms)
- Reaction time
(placebo) (ms)
Reaction time
(treatment Y) (ms)
- Reaction time
(placebo) (ms)
Reaction time
(treatment X) (ms)
- Reaction time
(treatment Y) (ms)
Z -.095b -2.249b -3.622c
Asymp. Sig. (2-tailed) .925 .025 .000
a. Wilcoxon Signed Ranks Test
b. Based on negative ranks.
c. Based on positive ranks.
chevron_up_icon
1 out of 9
circle_padding
hide_on_mobile
zoom_out_icon
[object Object]