MAT10251 Statistical Analysis Project: Used Car Price Analysis

Verified

Added on  2022/11/16

|7
|1512
|111
Project
AI Summary
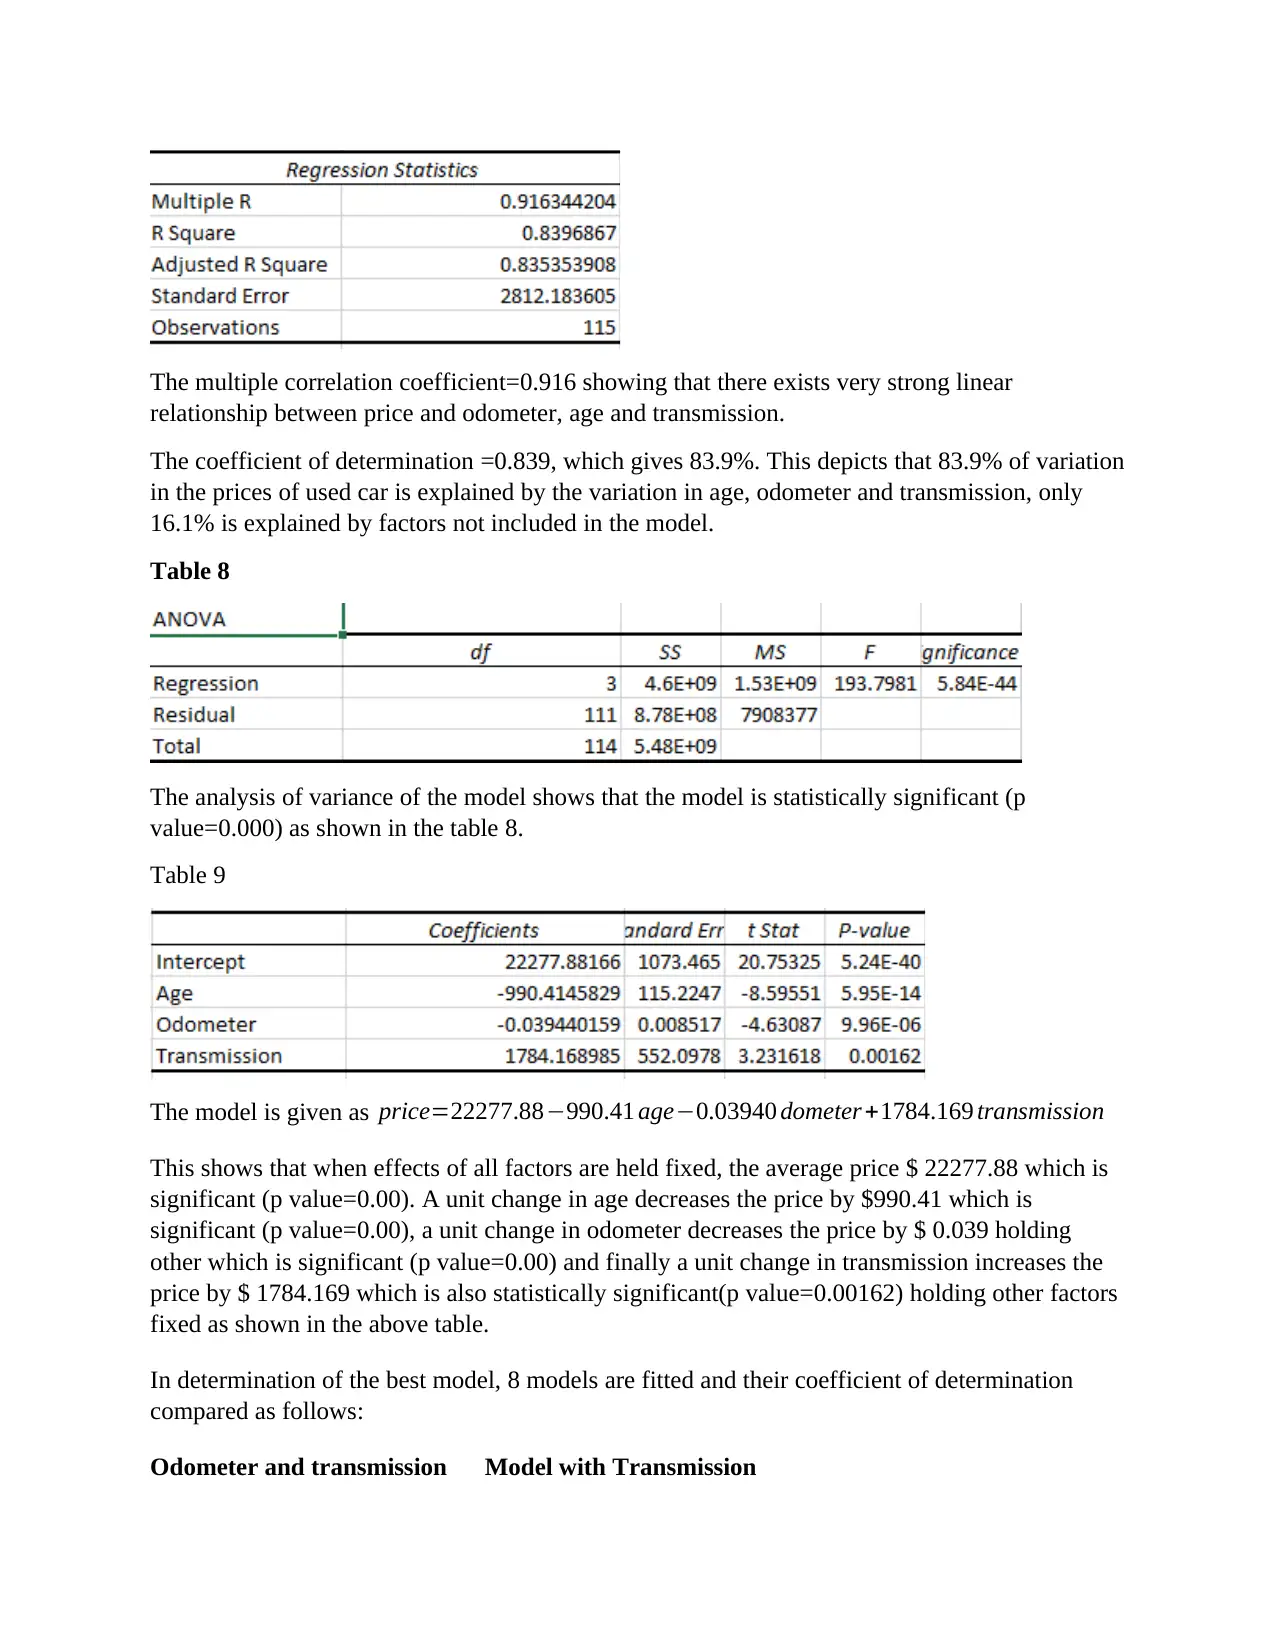
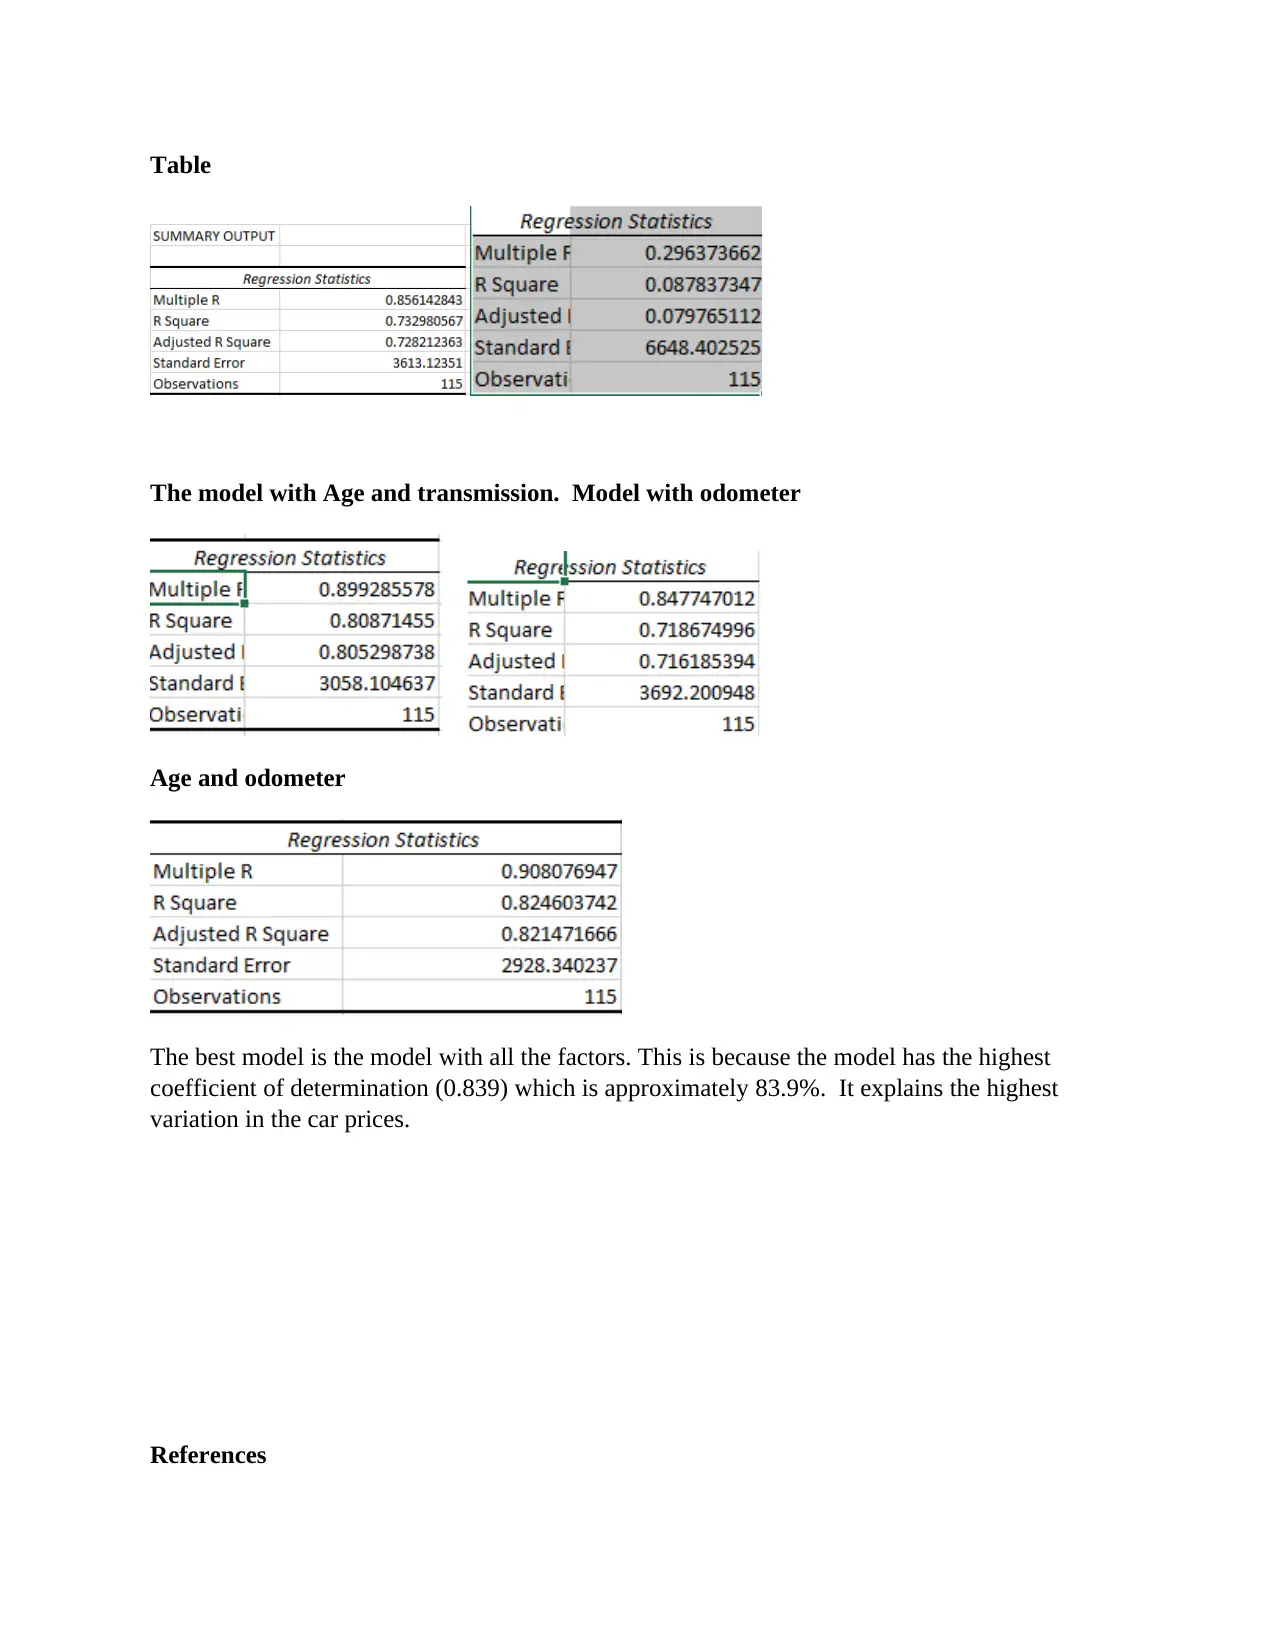
This project presents a comprehensive statistical analysis of used car prices in New South Wales. The analysis begins with descriptive statistics and confidence intervals to estimate the average price of 2016 and 2017 cars. Hypothesis testing is used to determine if restricting white cars limits buyer choice and if there's a price difference between privately sold cars and those from dealers. Linear regression explores the relationship between price and age, while multiple linear regression investigates the influence of age, odometer, and transmission on price. The project includes model comparisons and interpretations of statistical significance, providing insights into factors affecting used car prices. Various statistical techniques are applied, and the results are presented with tables and figures, offering a detailed understanding of the car market.
Document Page
Question one
Since many buyers wish to purchase a three or four year used car, there is need to estimate the
average price of 2016 and 2017 cars in New South Wales. The descriptive analysis and
confidence level can assist to calculated the sample average prices and estimation the range of
the average population price of used car in new South Wales. The confidence level can be
applied because of the large sample size of 115, thus the central limit theorem applies.
Table 1
The estimated average price of 2016 and 2017 is $ 22071.725 with the minimum price being $
14990 and maximum $ 28950. The average price has high variability as shown by high standard
deviation value of 3635.30. We are 95% confidence that the exact average current price of two or
three used cars in New South Wales lies in the range of $ (22071.725±1162.63).
Question two
Many buyers believe that white cars are safer since they are visible. Therefore, they wish to
purchase white car. This section gives the statistical finding of whether the restricting white cars
will limit buyer’s choice. Testing of the following pair of hypotheses can help us in this case:
H0: The proportion of the white car make and model for sale in in the New South Wales is less
than 30%.
H1: The proportion of the white car make and model for sale in in the New South Wales is less
than 30%.
The binomial test of proportionality out put bellow gives the findings of the analysis.
Table 2
tabler-icon-diamond-filled.svg

Paraphrase This Document

Need a fresh take? Get an instant paraphrase of this document with our AI Paraphraser
Document Page
The current estimated proportion of used white cars make and model in NEW South wales is
70%. The p value for the test=0.00 which is less than 0.05, thus Ho is rejected at 95% level of
significance. Therefore, we can conclude that the proportion of used white cars model and make
in New South Wales is more than 30%. Thus, the buyer’s choice is not limited.
Question three
Due to need to know whether the difference exists between prices of cars for sale by privately
and those for sale by car dealers. This section contains the statistical findings that can assist in
determining whether significant difference exists between the two prices. Testing the following
pair of hypotheses can assist in arriving at the finding:
Ho: The prices of cars for sale privately and by car dealers are the same
H1: The prices of cars for sale privately and by car dealers do differ
Two sample assuming unequal variances can be used because there is no population standard
deviation and the box plot which is not included here shows different variability of the two
prices.
Table 3
Even though average Dealer price ($17101.92) is higher than private ($ 14948.94), the difference
between the two is statistically insignificant at 95% level of significance (p value=0.0961) as
shown in the table 3 above.
Document Page
Question four
This section explores the relationship between price and age of the used car in New South Wales.
Simple linear regression assists in relating the two variables.
Before fitting a linear regression existence of linear relationship between the two and normality
of the error terms should be established. Scatter plot for checking this is as bellow:
Figure 1
Negative linear relationship exists between price and the age of the used car as shown in figure 1
above and the normality plot shows a gradient of 1 and y intercept=0 which implies normal
distribution.
The coefficient of determination and the multiple correlation coefficient are in the table below:
Table 4
Correlation coefficient= 0.887, this shows that there existed strong linear relationship between
price and age of the car which is shown by the scatter plot.
Coefficient of determination=0.787, which gives approximately 78.7%. meaning that 78.7% of
variation in the prices of used cars is explained by variation in the age of the car. The remaining
21.3% of variation is explained by other factors not included in the model.
Table 5
Document Page
The Analysis of variance table for the model above shows that the model is statistically
significant at 95% level of significance (p value= 0.0000).
Table 6
The simple linear regression model is Price=25311.0741475.987 age
This means that; when effect of age is eliminated, the average price is $ 25311.074 which is
significant at 95% level of significance (intercept p vale=0.000). A unit change in the age of the
car decreases the price by $ 1475.987 which is statistically significant at 95% level of
significance.
Question 5
This section explores the relationship between price and the three explanatory random variables
i.e. age, odometer and Transmission. The multiple linear regression is used to establish the
relationship.
There scatter plots are as below;
Figure two
The scatter plot in figure two above shows existence
linear pattern of scatter plots of Price against odometer
and Transmission, thus linear relationship exists.
Table 7
tabler-icon-diamond-filled.svg

Paraphrase This Document

Need a fresh take? Get an instant paraphrase of this document with our AI Paraphraser
Document Page
The multiple correlation coefficient=0.916 showing that there exists very strong linear
relationship between price and odometer, age and transmission.
The coefficient of determination =0.839, which gives 83.9%. This depicts that 83.9% of variation
in the prices of used car is explained by the variation in age, odometer and transmission, only
16.1% is explained by factors not included in the model.
Table 8
The analysis of variance of the model shows that the model is statistically significant (p
value=0.000) as shown in the table 8.
Table 9
The model is given as price=22277.88990.41 age0.03940 dometer +1784.169 transmission
This shows that when effects of all factors are held fixed, the average price $ 22277.88 which is
significant (p value=0.00). A unit change in age decreases the price by $990.41 which is
significant (p value=0.00), a unit change in odometer decreases the price by $ 0.039 holding
other which is significant (p value=0.00) and finally a unit change in transmission increases the
price by $ 1784.169 which is also statistically significant(p value=0.00162) holding other factors
fixed as shown in the above table.
In determination of the best model, 8 models are fitted and their coefficient of determination
compared as follows:
Odometer and transmission Model with Transmission
Document Page
Table
The model with Age and transmission. Model with odometer
Age and odometer
The best model is the model with all the factors. This is because the model has the highest
coefficient of determination (0.839) which is approximately 83.9%. It explains the highest
variation in the car prices.
References
Document Page
Junk, T. (1999). Confidence level computation for combining searches with small
statistics. Nuclear Instruments and Methods in Physics Research Section A: Accelerators,
Spectrometers, Detectors and Associated Equipment, 434(2-3), 435-443.
Moore, D. S., & Kirkland, S. (2007). The basic practice of statistics (Vol. 2). New York: WH
Freeman.
Gupta, S. K. (2012). The relevance of confidence interval and P-value in inferential
statistics. Indian journal of pharmacology, 44(1), 143.
Yamane, T. (1973). Statistics: An introductory analysis.
Levine, D. M., Berenson, M. L., Stephan, D., & Lysell, D. (1999). Statistics for managers using
Microsoft Excel (Vol. 660). Upper Saddle River, NJ: Prentice Hall.
Anderson, D. R., Sweeney, D. J., & Williams, T. A. (2014). Modern business statistics with
Microsoft Excel. Nelson Education.
Ruxton, G. D. (2006). The unequal variance t-test is an underused alternative to Student's t-test
and the Mann–Whitney U test. Behavioral Ecology, 17(4), 688-690.
Orlov, M. L. (1996). Multiple linear regression analysis using Microsoft Excel. Chemistry
Department, Oregon State University.
Seber, G. A., & Lee, A. J. (2012). Linear regression analysis(Vol. 329). John Wiley & Sons.
Neter, J., Wasserman, W., & Kutner, M. H. (1989). Applied linear regression models.
Fox, J. (1997). Applied regression analysis, linear models, and related methods. Sage
Publications, Inc.
Triola, M. F. (2013). Elementary statistics using Excel. Pearson.
chevron_up_icon
1 out of 7
circle_padding
hide_on_mobile
zoom_out_icon
[object Object]