Data Analysis: Frequency Distribution and Outlier Analysis
VerifiedAdded on 2022/08/27
|5
|579
|18
Homework Assignment
AI Summary
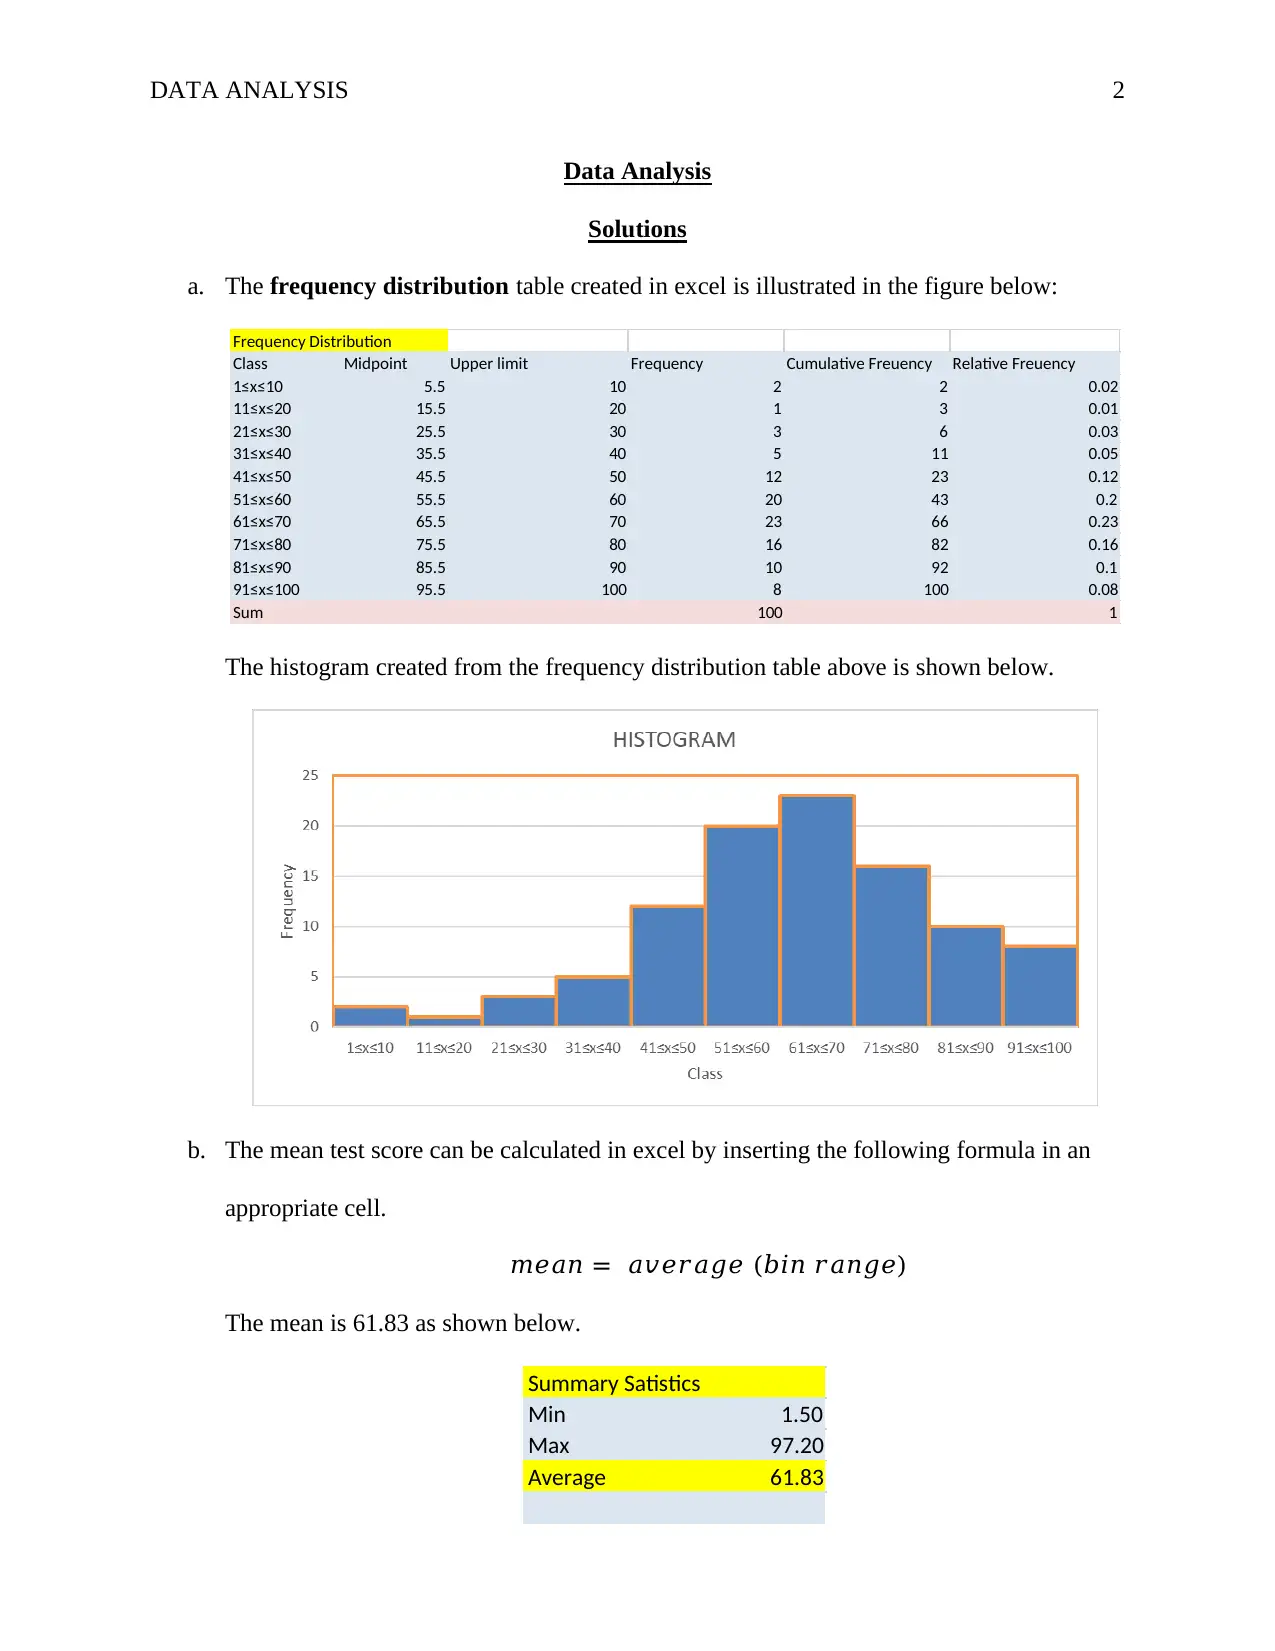
This document presents a complete solution to a data analysis assignment. The solution includes the construction of a frequency distribution table and histogram using Excel, with appropriate class boundaries. It calculates the mean test score using Excel and determines the first, second (median), and third quartiles using the common-sense rule. Based on the results, the solution explains whether the distribution is bell-shaped or skewed. Finally, it identifies and calculates any outliers in the dataset using the 1.5 IQR rule, demonstrating the application of these statistical concepts to real-world data analysis. The assignment is based on an aptitude test with a dataset of test scores.
1 out of 5
Related Documents


Your All-in-One AI-Powered Toolkit for Academic Success.
+13062052269
info@desklib.com
Available 24*7 on WhatsApp / Email
![[object Object]](/_next/static/media/star-bottom.7253800d.svg)
Copyright © 2020–2026 A2Z Services. All Rights Reserved. Developed and managed by ZUCOL.