Statistics Assignment: Analyzing Constipation Factors in Older Adults
VerifiedAdded on 2023/04/07
|17
|3003
|410
Homework Assignment
AI Summary
This statistics assignment analyzes factors affecting constipation in older adults, including age, gender, chronic laxative use, toileting level, fluid intake, and fiber intake. The analysis uses contingency tables and summary statistics to explore the relationships between these variables. A Pearson's r correlation test is conducted to assess the relationship between daily fiber intake and daily fluid intake, revealing a positive correlation. Furthermore, a t-test is performed to determine if there is a significant difference in mean functional ability between males and females. The findings are discussed in the context of nursing practice and research, with implications for developing dietary strategies to improve bowel health in older adults. Desklib offers this assignment as a resource for students studying statistics and related healthcare topics.
1
Running head: STATISTICS ASSIGNMENT 2
Prevention of Constipation in the Older Adult Population
Name of the Student
Name of the University
Running head: STATISTICS ASSIGNMENT 2
Prevention of Constipation in the Older Adult Population
Name of the Student
Name of the University
Paraphrase This Document
Need a fresh take? Get an instant paraphrase of this document with our AI Paraphraser
2
STATISTICS ASSIGNMENT 2
Question 1
a. Contingency tables for age group and gender, age group and history of chronic laxative
use, age group and history of chronic laxative use.
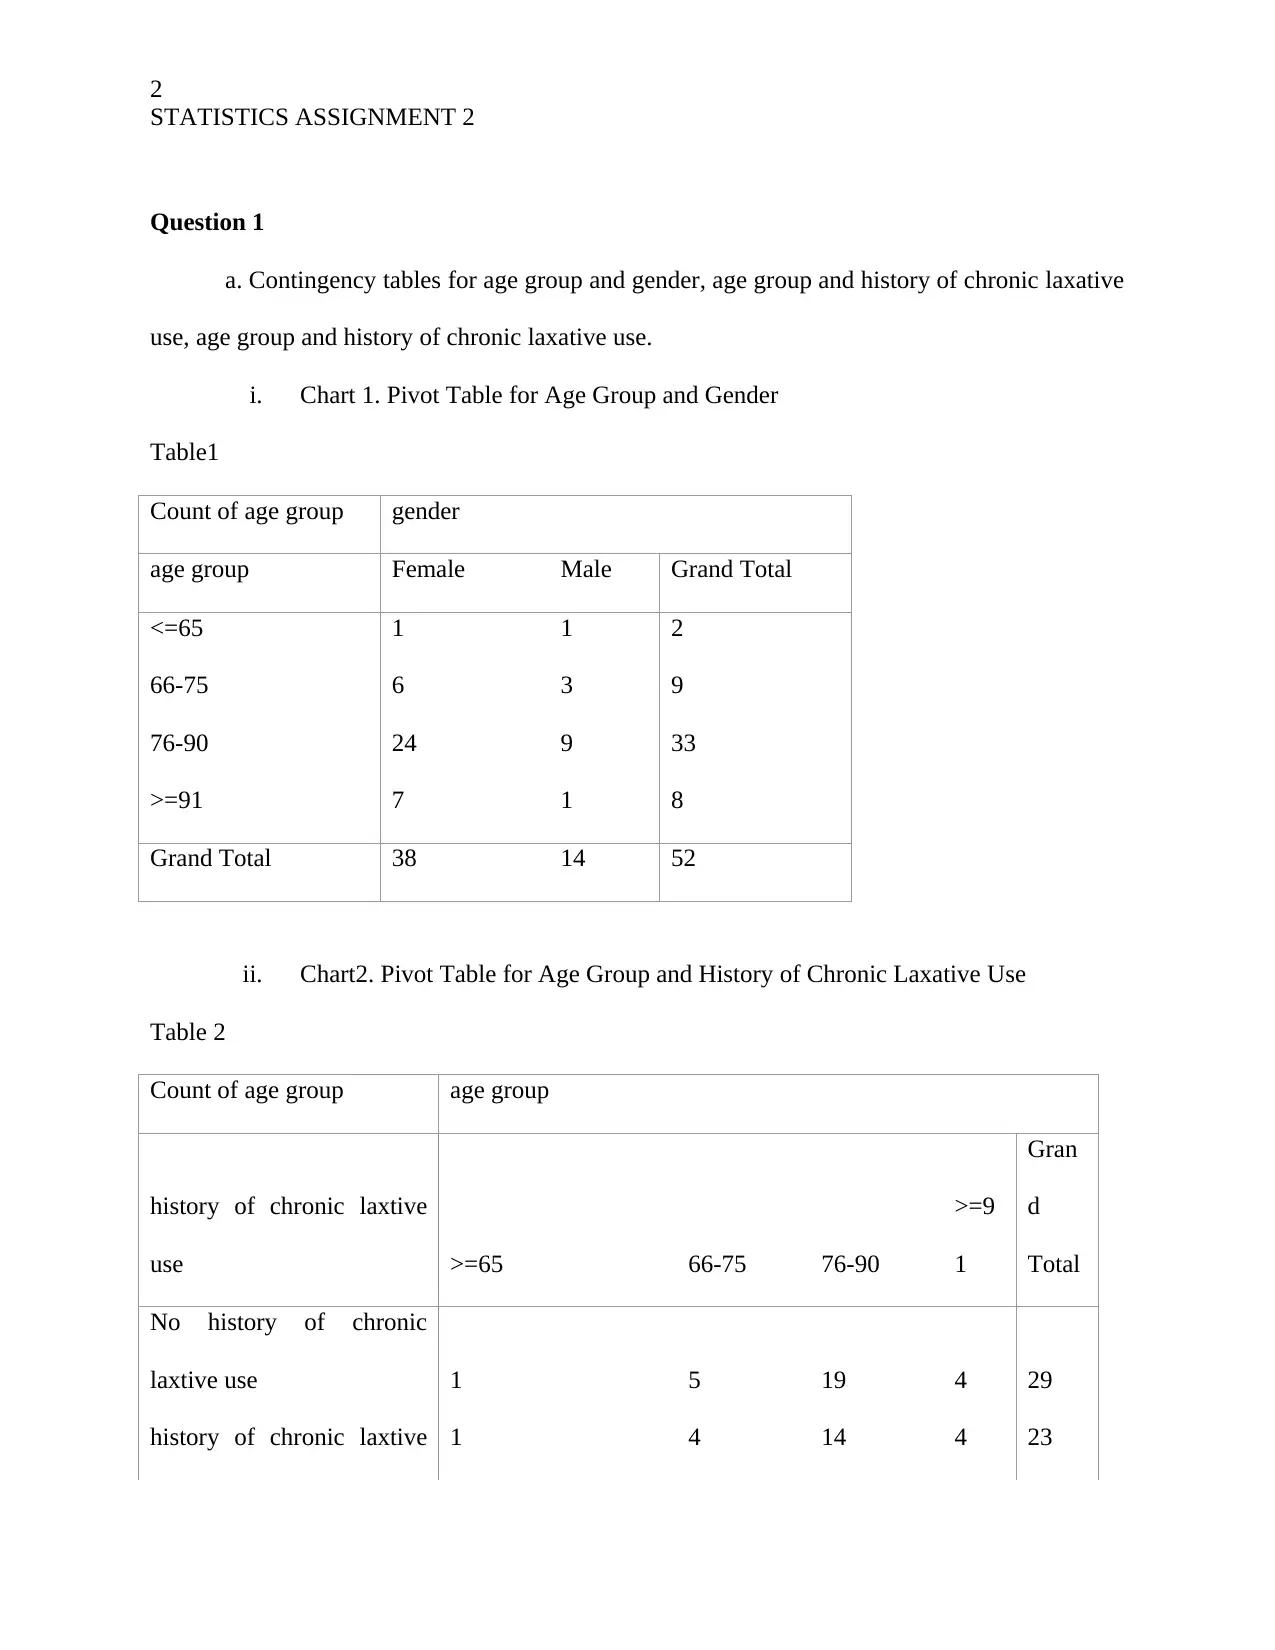
i. Chart 1. Pivot Table for Age Group and Gender
Table1
Count of age group gender
age group Female Male Grand Total
<=65 1 1 2
66-75 6 3 9
76-90 24 9 33
>=91 7 1 8
Grand Total 38 14 52
ii. Chart2. Pivot Table for Age Group and History of Chronic Laxative Use
Table 2
Count of age group age group
history of chronic laxtive
use >=65 66-75 76-90
>=9
1
Gran
d
Total
No history of chronic
laxtive use 1 5 19 4 29
history of chronic laxtive 1 4 14 4 23
STATISTICS ASSIGNMENT 2
Question 1
a. Contingency tables for age group and gender, age group and history of chronic laxative
use, age group and history of chronic laxative use.
i. Chart 1. Pivot Table for Age Group and Gender
Table1
Count of age group gender
age group Female Male Grand Total
<=65 1 1 2
66-75 6 3 9
76-90 24 9 33
>=91 7 1 8
Grand Total 38 14 52
ii. Chart2. Pivot Table for Age Group and History of Chronic Laxative Use
Table 2
Count of age group age group
history of chronic laxtive
use >=65 66-75 76-90
>=9
1
Gran
d
Total
No history of chronic
laxtive use 1 5 19 4 29
history of chronic laxtive 1 4 14 4 23
3
STATISTICS ASSIGNMENT 2
use
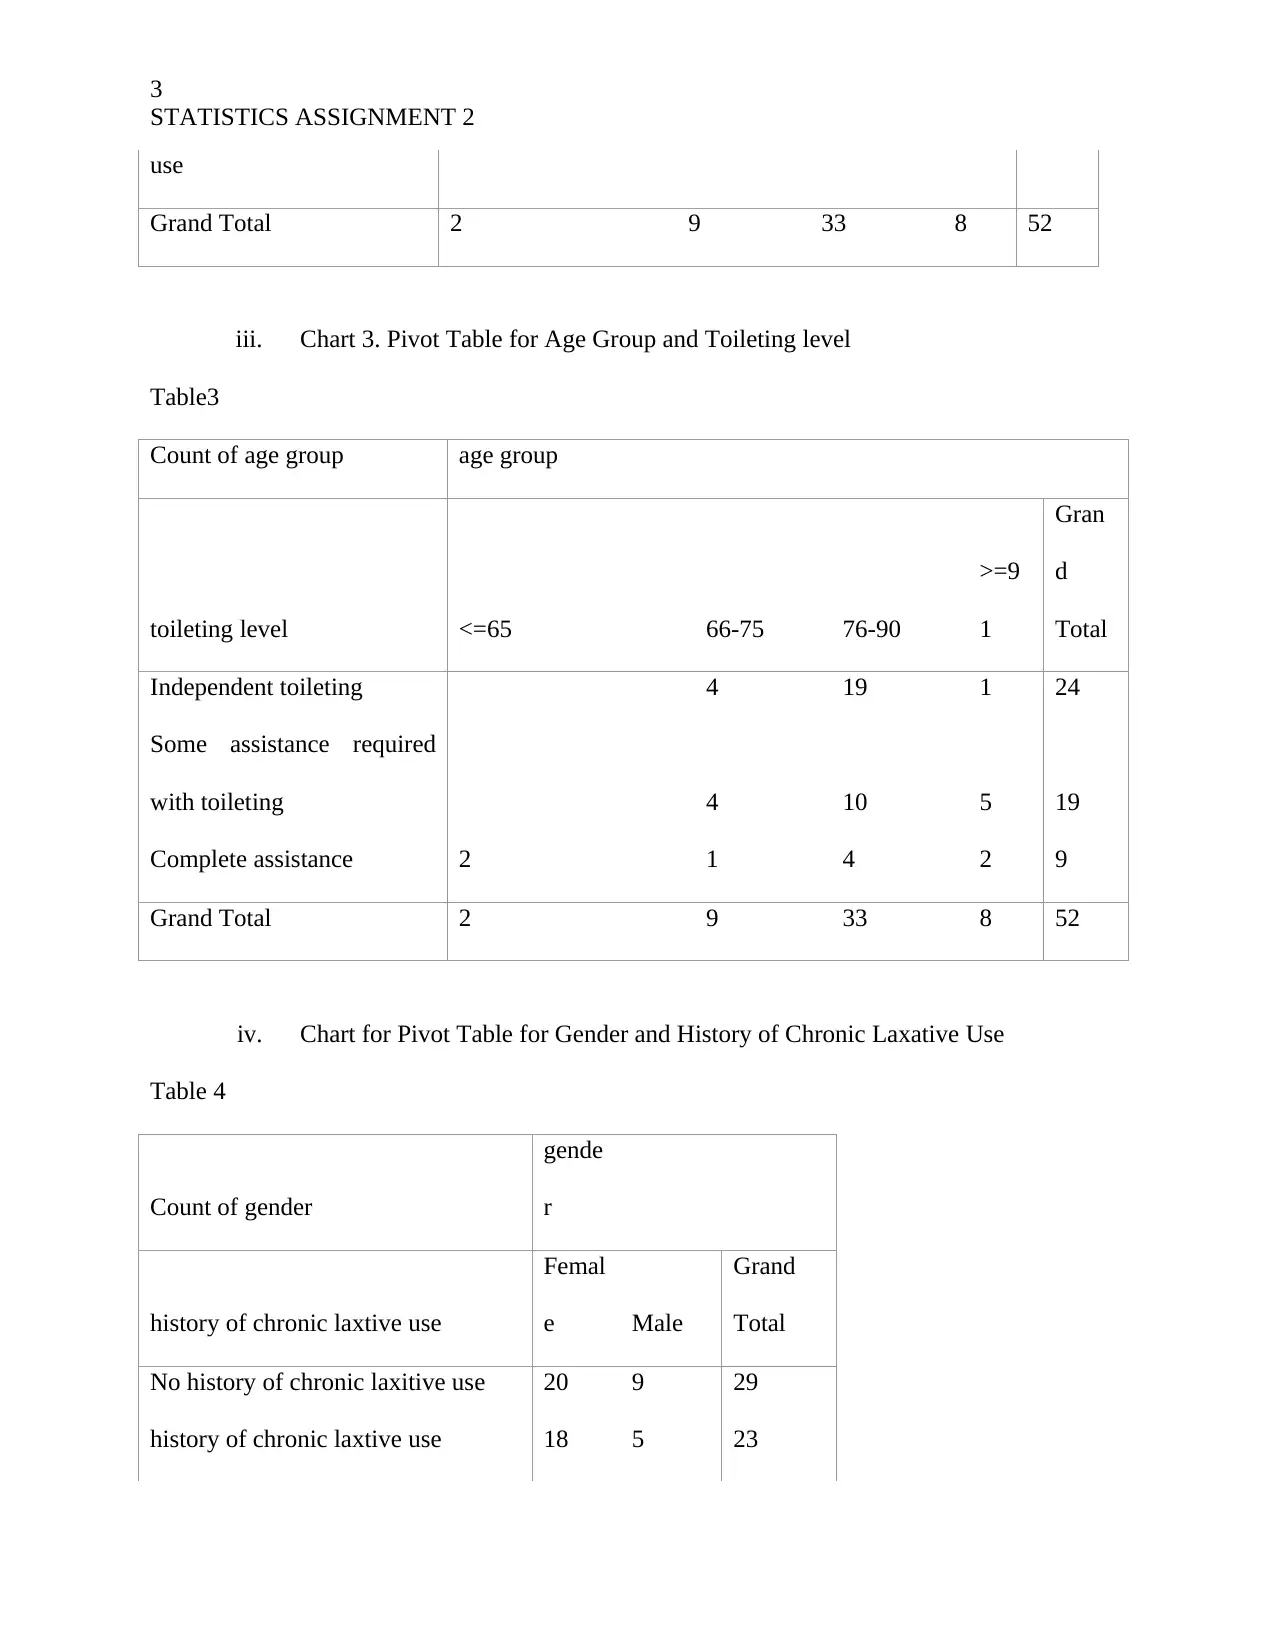
Grand Total 2 9 33 8 52
iii. Chart 3. Pivot Table for Age Group and Toileting level
Table3
Count of age group age group
toileting level <=65 66-75 76-90
>=9
1
Gran
d
Total
Independent toileting 4 19 1 24
Some assistance required
with toileting 4 10 5 19
Complete assistance 2 1 4 2 9
Grand Total 2 9 33 8 52
iv. Chart for Pivot Table for Gender and History of Chronic Laxative Use
Table 4
Count of gender
gende
r
history of chronic laxtive use
Femal
e Male
Grand
Total
No history of chronic laxitive use 20 9 29
history of chronic laxtive use 18 5 23
STATISTICS ASSIGNMENT 2
use
Grand Total 2 9 33 8 52
iii. Chart 3. Pivot Table for Age Group and Toileting level
Table3
Count of age group age group
toileting level <=65 66-75 76-90
>=9
1
Gran
d
Total
Independent toileting 4 19 1 24
Some assistance required
with toileting 4 10 5 19
Complete assistance 2 1 4 2 9
Grand Total 2 9 33 8 52
iv. Chart for Pivot Table for Gender and History of Chronic Laxative Use
Table 4
Count of gender
gende
r
history of chronic laxtive use
Femal
e Male
Grand
Total
No history of chronic laxitive use 20 9 29
history of chronic laxtive use 18 5 23
⊘ This is a preview!⊘
Do you want full access?
Subscribe today to unlock all pages.
Trusted by 1+ million students worldwide
4
STATISTICS ASSIGNMENT 2
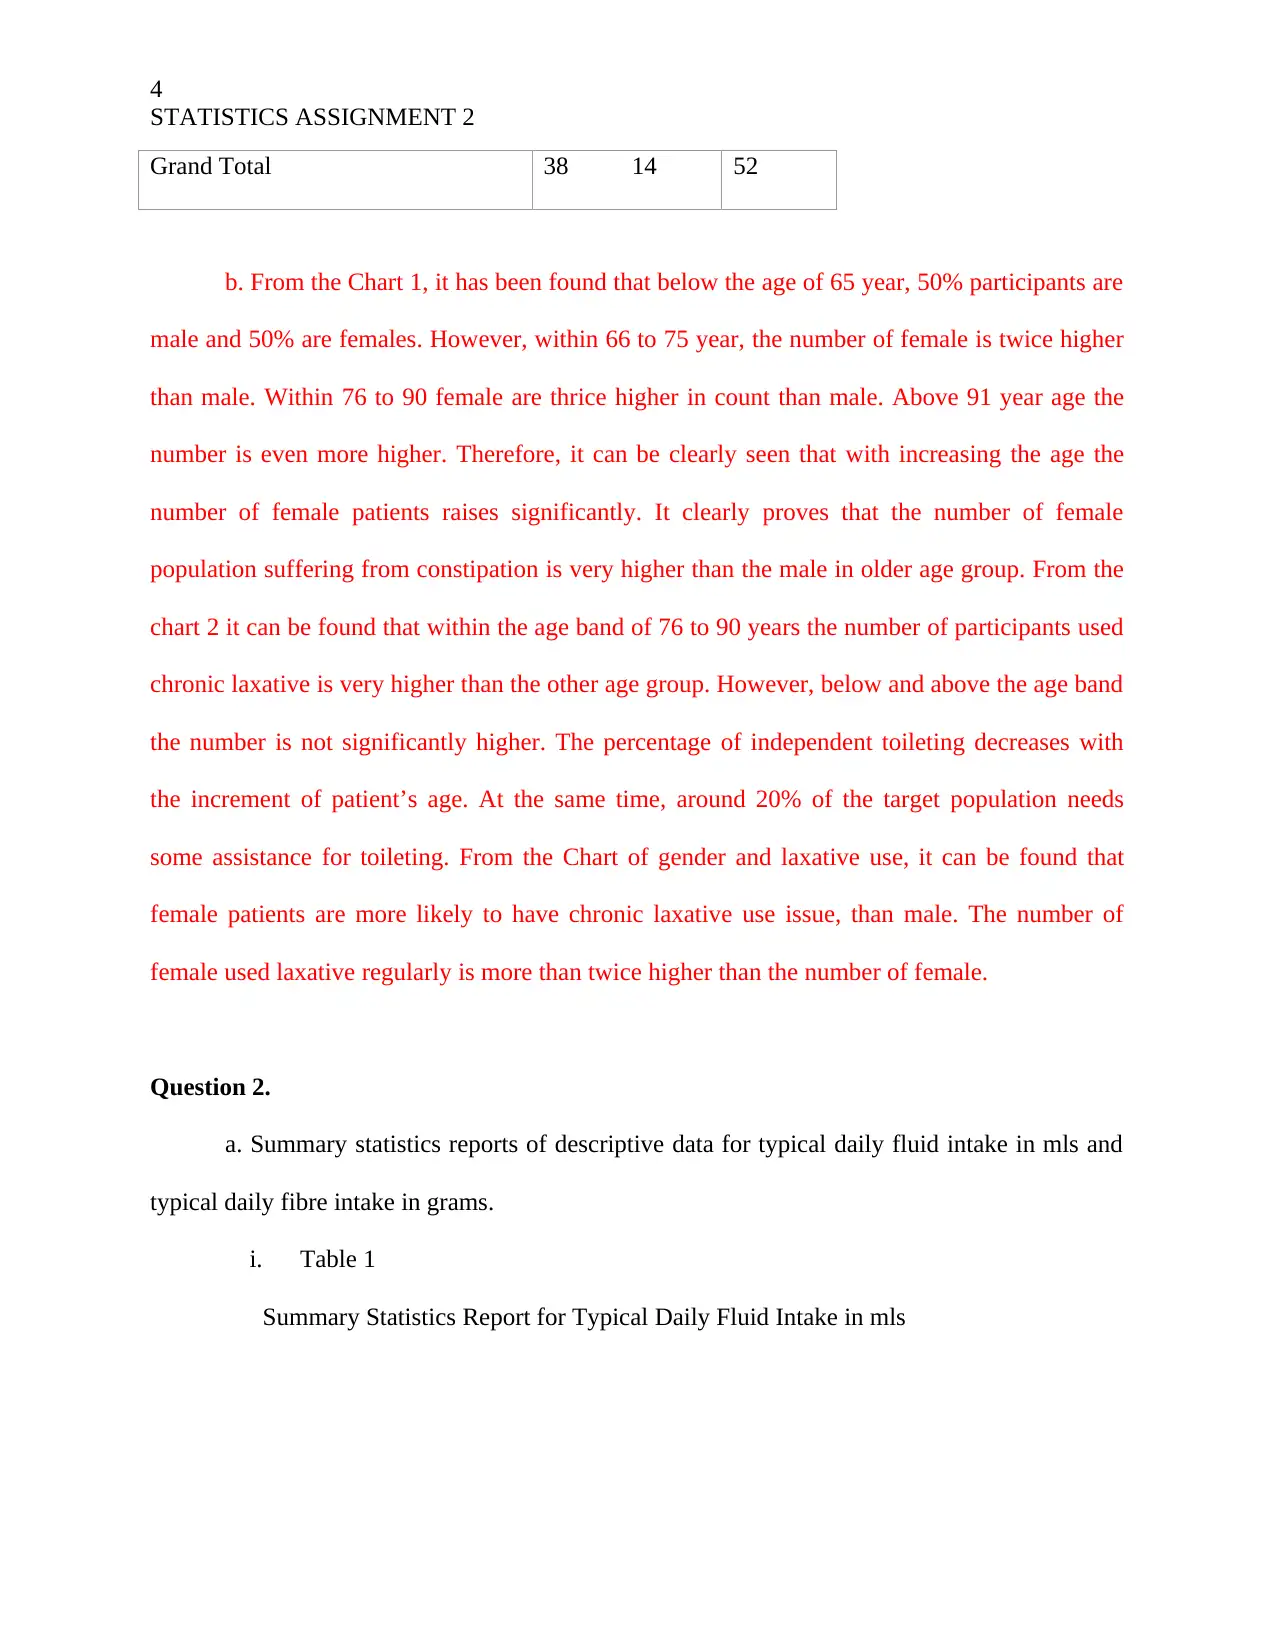
Grand Total 38 14 52
b. From the Chart 1, it has been found that below the age of 65 year, 50% participants are
male and 50% are females. However, within 66 to 75 year, the number of female is twice higher
than male. Within 76 to 90 female are thrice higher in count than male. Above 91 year age the
number is even more higher. Therefore, it can be clearly seen that with increasing the age the
number of female patients raises significantly. It clearly proves that the number of female
population suffering from constipation is very higher than the male in older age group. From the
chart 2 it can be found that within the age band of 76 to 90 years the number of participants used
chronic laxative is very higher than the other age group. However, below and above the age band
the number is not significantly higher. The percentage of independent toileting decreases with
the increment of patient’s age. At the same time, around 20% of the target population needs
some assistance for toileting. From the Chart of gender and laxative use, it can be found that
female patients are more likely to have chronic laxative use issue, than male. The number of
female used laxative regularly is more than twice higher than the number of female.
Question 2.
a. Summary statistics reports of descriptive data for typical daily fluid intake in mls and
typical daily fibre intake in grams.
i. Table 1
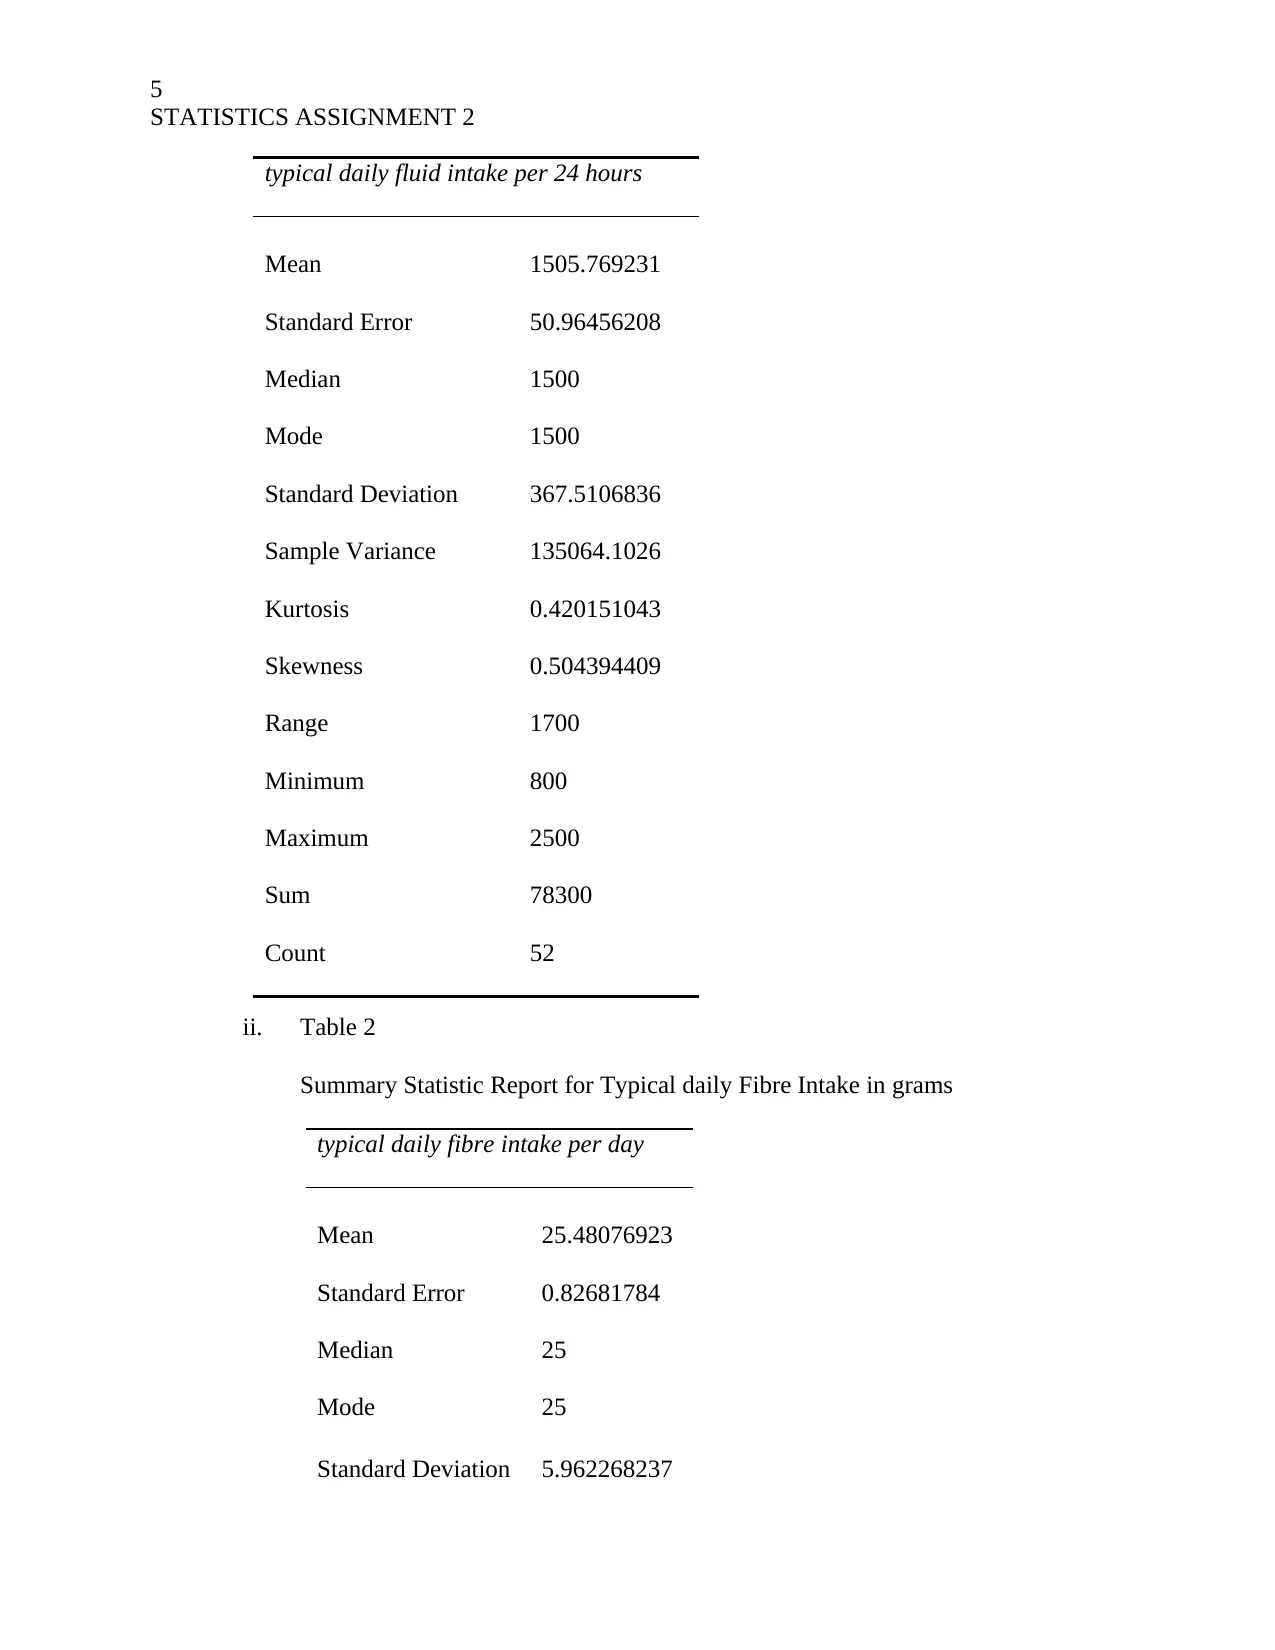
Summary Statistics Report for Typical Daily Fluid Intake in mls
STATISTICS ASSIGNMENT 2
Grand Total 38 14 52
b. From the Chart 1, it has been found that below the age of 65 year, 50% participants are
male and 50% are females. However, within 66 to 75 year, the number of female is twice higher
than male. Within 76 to 90 female are thrice higher in count than male. Above 91 year age the
number is even more higher. Therefore, it can be clearly seen that with increasing the age the
number of female patients raises significantly. It clearly proves that the number of female
population suffering from constipation is very higher than the male in older age group. From the
chart 2 it can be found that within the age band of 76 to 90 years the number of participants used
chronic laxative is very higher than the other age group. However, below and above the age band
the number is not significantly higher. The percentage of independent toileting decreases with
the increment of patient’s age. At the same time, around 20% of the target population needs
some assistance for toileting. From the Chart of gender and laxative use, it can be found that
female patients are more likely to have chronic laxative use issue, than male. The number of
female used laxative regularly is more than twice higher than the number of female.
Question 2.
a. Summary statistics reports of descriptive data for typical daily fluid intake in mls and
typical daily fibre intake in grams.
i. Table 1
Summary Statistics Report for Typical Daily Fluid Intake in mls
Paraphrase This Document
Need a fresh take? Get an instant paraphrase of this document with our AI Paraphraser
5
STATISTICS ASSIGNMENT 2
ii. Table 2
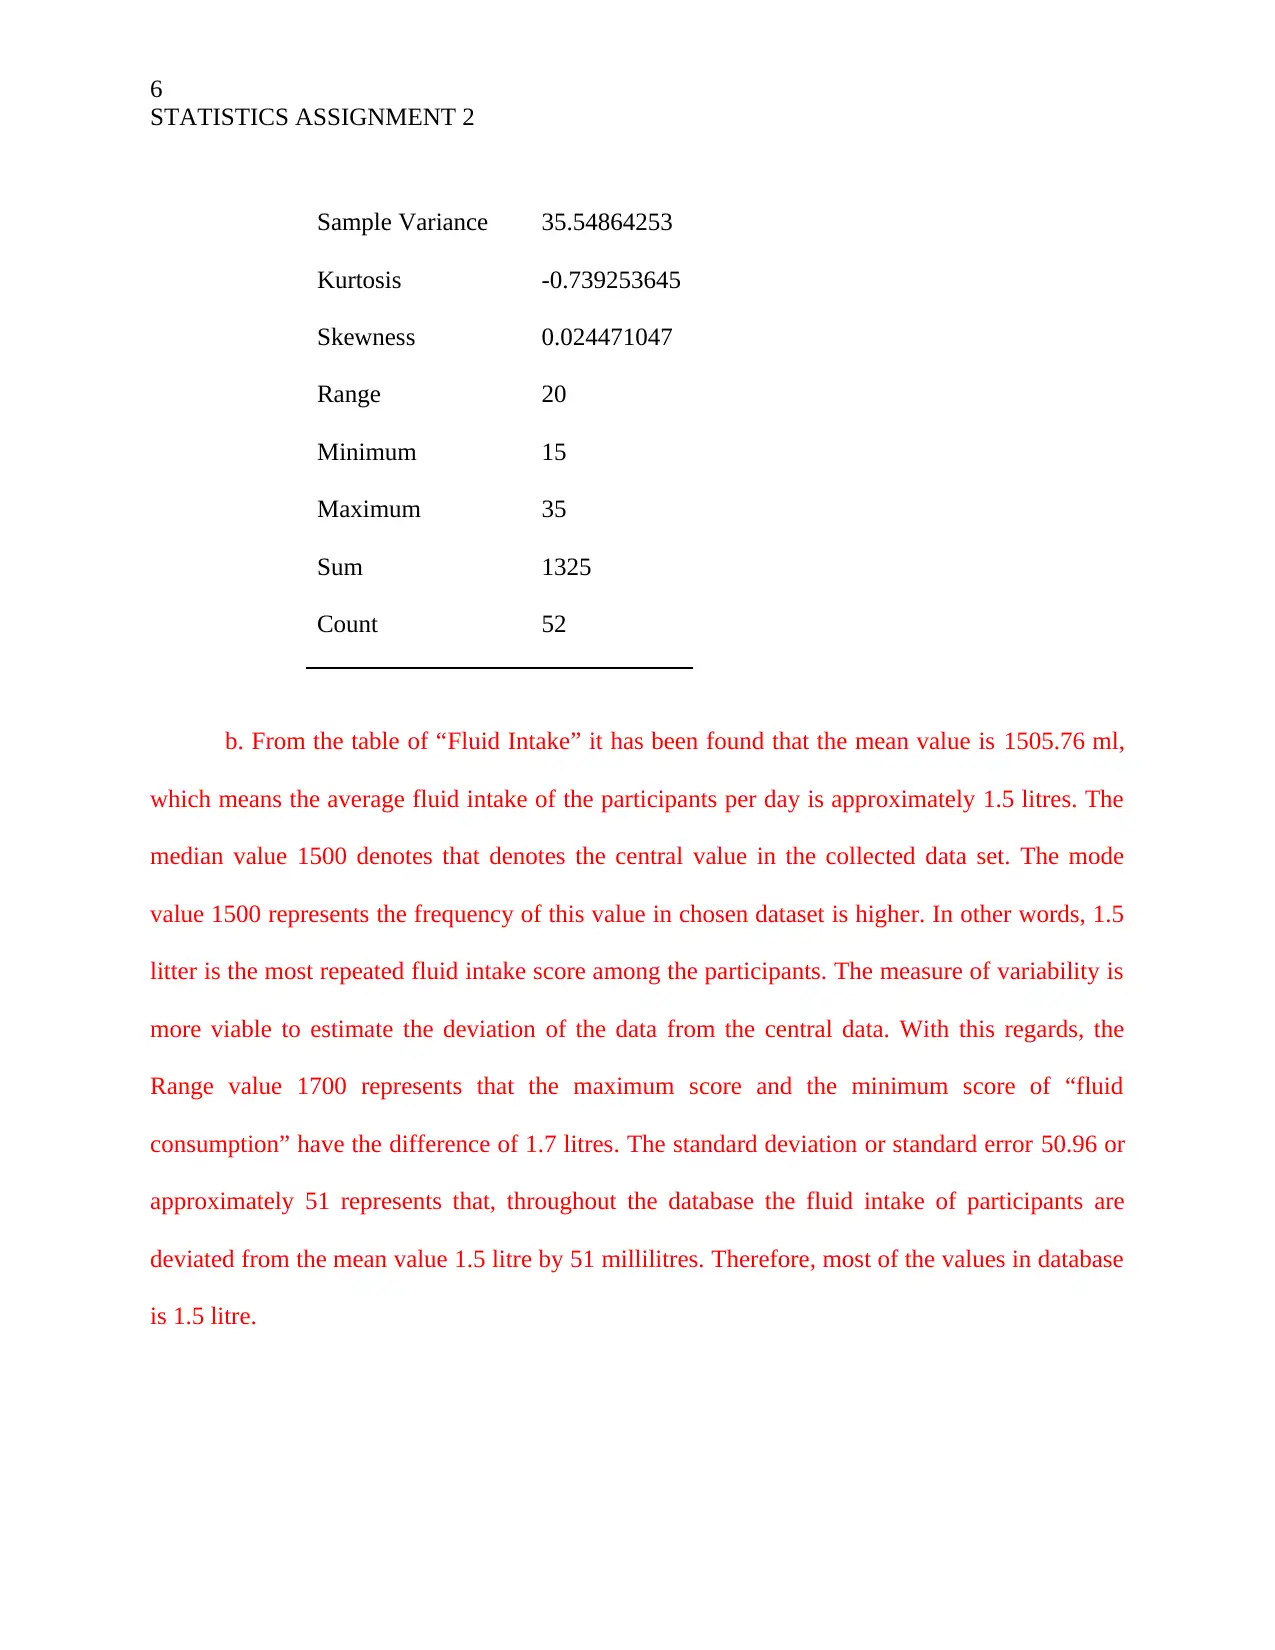
Summary Statistic Report for Typical daily Fibre Intake in grams
typical daily fibre intake per day
Mean 25.48076923
Standard Error 0.82681784
Median 25
Mode 25
Standard Deviation 5.962268237
typical daily fluid intake per 24 hours
Mean 1505.769231
Standard Error 50.96456208
Median 1500
Mode 1500
Standard Deviation 367.5106836
Sample Variance 135064.1026
Kurtosis 0.420151043
Skewness 0.504394409
Range 1700
Minimum 800
Maximum 2500
Sum 78300
Count 52
STATISTICS ASSIGNMENT 2
ii. Table 2
Summary Statistic Report for Typical daily Fibre Intake in grams
typical daily fibre intake per day
Mean 25.48076923
Standard Error 0.82681784
Median 25
Mode 25
Standard Deviation 5.962268237
typical daily fluid intake per 24 hours
Mean 1505.769231
Standard Error 50.96456208
Median 1500
Mode 1500
Standard Deviation 367.5106836
Sample Variance 135064.1026
Kurtosis 0.420151043
Skewness 0.504394409
Range 1700
Minimum 800
Maximum 2500
Sum 78300
Count 52
6
STATISTICS ASSIGNMENT 2
Sample Variance 35.54864253
Kurtosis -0.739253645
Skewness 0.024471047
Range 20
Minimum 15
Maximum 35
Sum 1325
Count 52
b. From the table of “Fluid Intake” it has been found that the mean value is 1505.76 ml,
which means the average fluid intake of the participants per day is approximately 1.5 litres. The
median value 1500 denotes that denotes the central value in the collected data set. The mode
value 1500 represents the frequency of this value in chosen dataset is higher. In other words, 1.5
litter is the most repeated fluid intake score among the participants. The measure of variability is
more viable to estimate the deviation of the data from the central data. With this regards, the
Range value 1700 represents that the maximum score and the minimum score of “fluid
consumption” have the difference of 1.7 litres. The standard deviation or standard error 50.96 or
approximately 51 represents that, throughout the database the fluid intake of participants are
deviated from the mean value 1.5 litre by 51 millilitres. Therefore, most of the values in database
is 1.5 litre.
⊘ This is a preview!⊘
Do you want full access?
Subscribe today to unlock all pages.
Trusted by 1+ million students worldwide
7
STATISTICS ASSIGNMENT 2
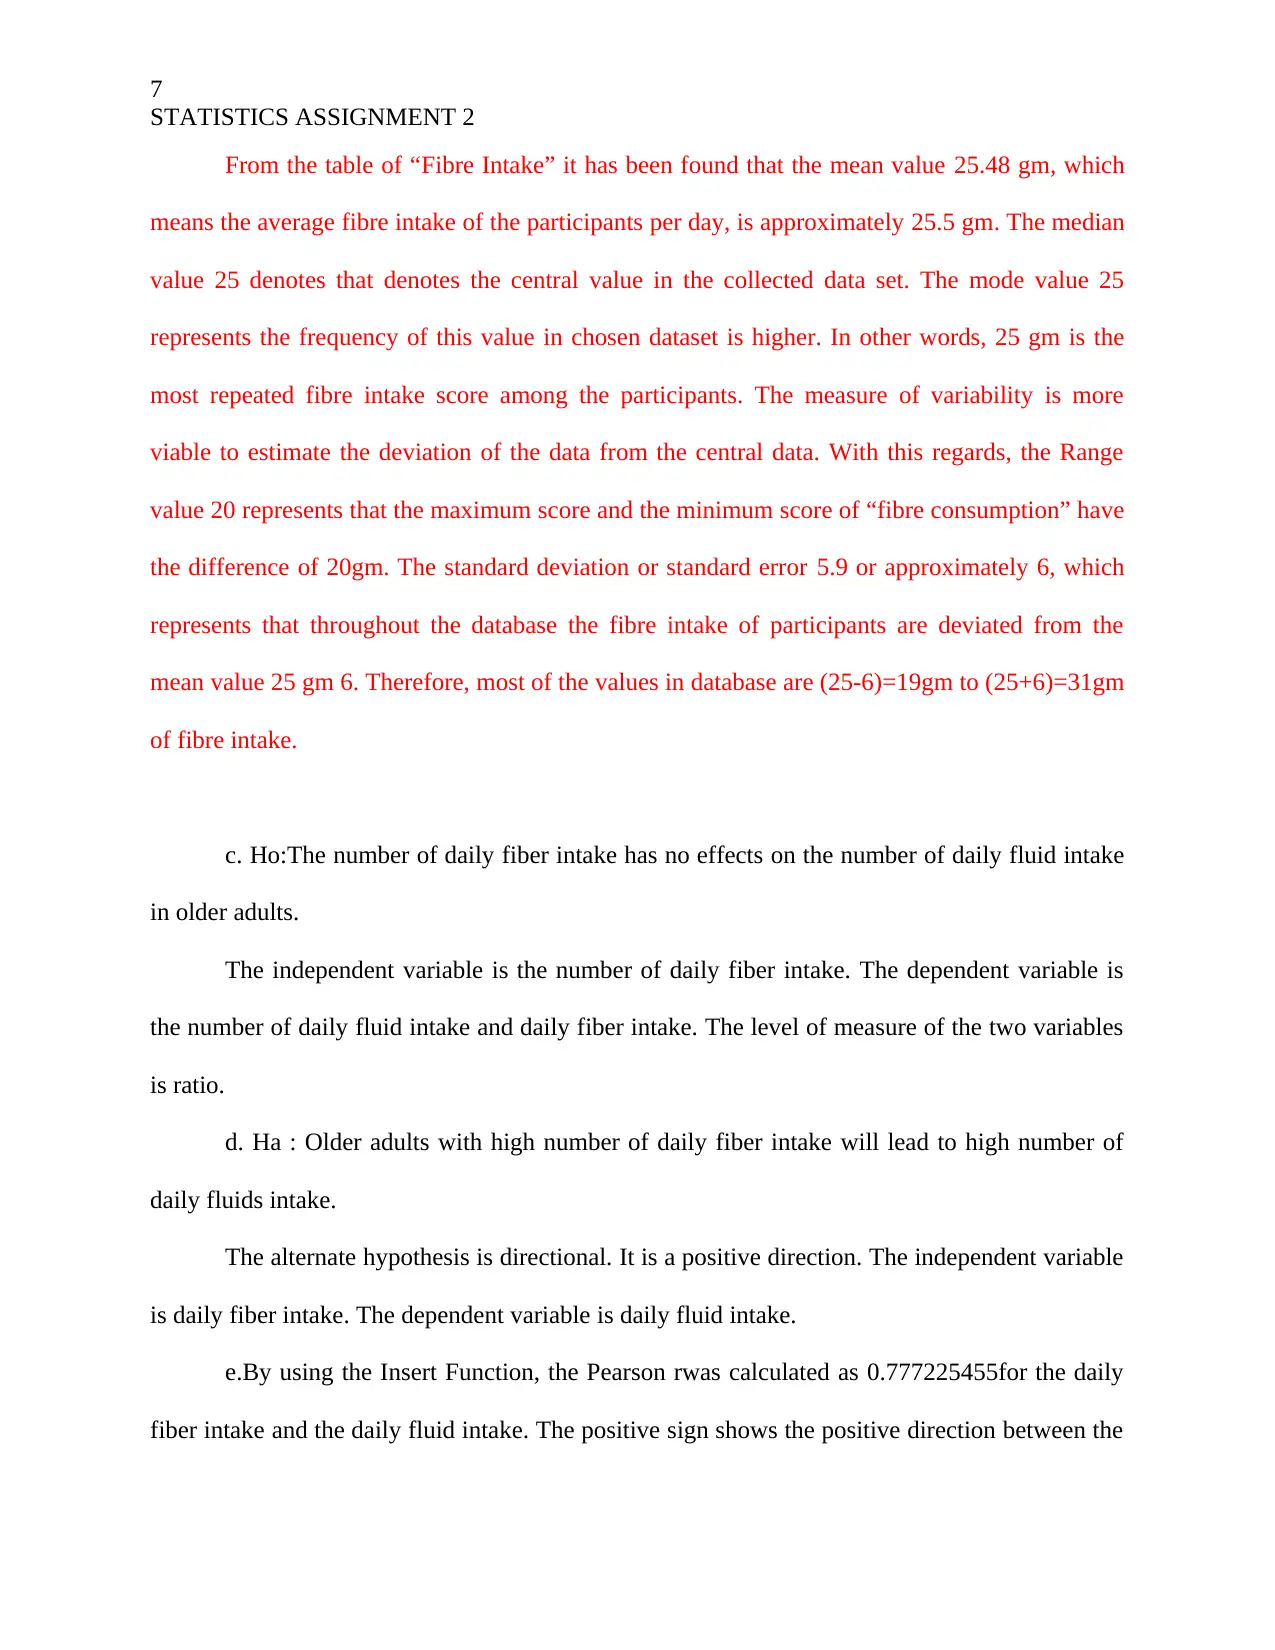
From the table of “Fibre Intake” it has been found that the mean value 25.48 gm, which
means the average fibre intake of the participants per day, is approximately 25.5 gm. The median
value 25 denotes that denotes the central value in the collected data set. The mode value 25
represents the frequency of this value in chosen dataset is higher. In other words, 25 gm is the
most repeated fibre intake score among the participants. The measure of variability is more
viable to estimate the deviation of the data from the central data. With this regards, the Range
value 20 represents that the maximum score and the minimum score of “fibre consumption” have
the difference of 20gm. The standard deviation or standard error 5.9 or approximately 6, which
represents that throughout the database the fibre intake of participants are deviated from the
mean value 25 gm 6. Therefore, most of the values in database are (25-6)=19gm to (25+6)=31gm
of fibre intake.
c. Ho:The number of daily fiber intake has no effects on the number of daily fluid intake
in older adults.
The independent variable is the number of daily fiber intake. The dependent variable is
the number of daily fluid intake and daily fiber intake. The level of measure of the two variables
is ratio.
d. Ha : Older adults with high number of daily fiber intake will lead to high number of
daily fluids intake.
The alternate hypothesis is directional. It is a positive direction. The independent variable
is daily fiber intake. The dependent variable is daily fluid intake.
e.By using the Insert Function, the Pearson rwas calculated as 0.777225455for the daily
fiber intake and the daily fluid intake. The positive sign shows the positive direction between the
STATISTICS ASSIGNMENT 2
From the table of “Fibre Intake” it has been found that the mean value 25.48 gm, which
means the average fibre intake of the participants per day, is approximately 25.5 gm. The median
value 25 denotes that denotes the central value in the collected data set. The mode value 25
represents the frequency of this value in chosen dataset is higher. In other words, 25 gm is the
most repeated fibre intake score among the participants. The measure of variability is more
viable to estimate the deviation of the data from the central data. With this regards, the Range
value 20 represents that the maximum score and the minimum score of “fibre consumption” have
the difference of 20gm. The standard deviation or standard error 5.9 or approximately 6, which
represents that throughout the database the fibre intake of participants are deviated from the
mean value 25 gm 6. Therefore, most of the values in database are (25-6)=19gm to (25+6)=31gm
of fibre intake.
c. Ho:The number of daily fiber intake has no effects on the number of daily fluid intake
in older adults.
The independent variable is the number of daily fiber intake. The dependent variable is
the number of daily fluid intake and daily fiber intake. The level of measure of the two variables
is ratio.
d. Ha : Older adults with high number of daily fiber intake will lead to high number of
daily fluids intake.
The alternate hypothesis is directional. It is a positive direction. The independent variable
is daily fiber intake. The dependent variable is daily fluid intake.
e.By using the Insert Function, the Pearson rwas calculated as 0.777225455for the daily
fiber intake and the daily fluid intake. The positive sign shows the positive direction between the
Paraphrase This Document
Need a fresh take? Get an instant paraphrase of this document with our AI Paraphraser
8
STATISTICS ASSIGNMENT 2
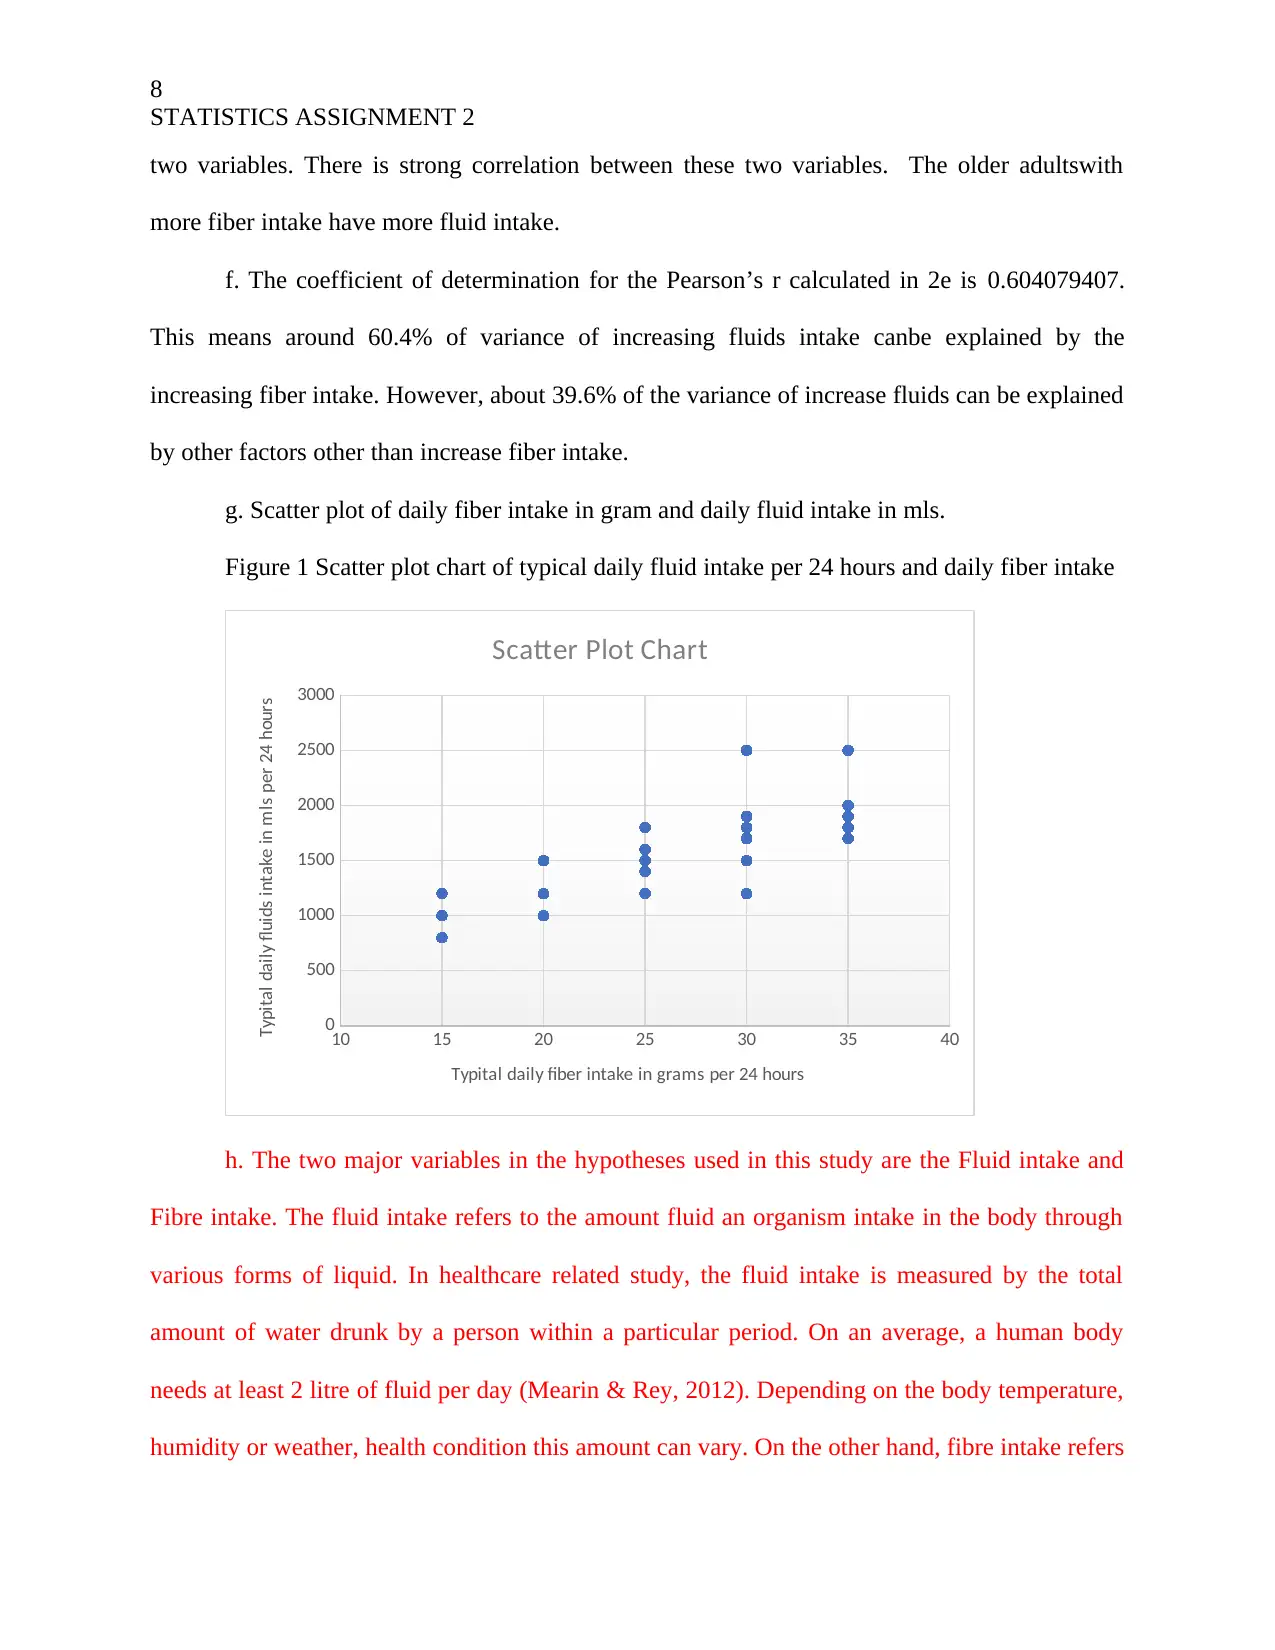
two variables. There is strong correlation between these two variables. The older adultswith
more fiber intake have more fluid intake.
f. The coefficient of determination for the Pearson’s r calculated in 2e is 0.604079407.
This means around 60.4% of variance of increasing fluids intake canbe explained by the
increasing fiber intake. However, about 39.6% of the variance of increase fluids can be explained
by other factors other than increase fiber intake.
g. Scatter plot of daily fiber intake in gram and daily fluid intake in mls.
Figure 1 Scatter plot chart of typical daily fluid intake per 24 hours and daily fiber intake
10 15 20 25 30 35 40
0
500
1000
1500
2000
2500
3000
Scatter Plot Chart
Typital daily fiber intake in grams per 24 hours
Typital daily fluids intake in mls per 24 hours
h. The two major variables in the hypotheses used in this study are the Fluid intake and
Fibre intake. The fluid intake refers to the amount fluid an organism intake in the body through
various forms of liquid. In healthcare related study, the fluid intake is measured by the total
amount of water drunk by a person within a particular period. On an average, a human body
needs at least 2 litre of fluid per day (Mearin & Rey, 2012). Depending on the body temperature,
humidity or weather, health condition this amount can vary. On the other hand, fibre intake refers
STATISTICS ASSIGNMENT 2
two variables. There is strong correlation between these two variables. The older adultswith
more fiber intake have more fluid intake.
f. The coefficient of determination for the Pearson’s r calculated in 2e is 0.604079407.
This means around 60.4% of variance of increasing fluids intake canbe explained by the
increasing fiber intake. However, about 39.6% of the variance of increase fluids can be explained
by other factors other than increase fiber intake.
g. Scatter plot of daily fiber intake in gram and daily fluid intake in mls.
Figure 1 Scatter plot chart of typical daily fluid intake per 24 hours and daily fiber intake
10 15 20 25 30 35 40
0
500
1000
1500
2000
2500
3000
Scatter Plot Chart
Typital daily fiber intake in grams per 24 hours
Typital daily fluids intake in mls per 24 hours
h. The two major variables in the hypotheses used in this study are the Fluid intake and
Fibre intake. The fluid intake refers to the amount fluid an organism intake in the body through
various forms of liquid. In healthcare related study, the fluid intake is measured by the total
amount of water drunk by a person within a particular period. On an average, a human body
needs at least 2 litre of fluid per day (Mearin & Rey, 2012). Depending on the body temperature,
humidity or weather, health condition this amount can vary. On the other hand, fibre intake refers
9
STATISTICS ASSIGNMENT 2
to the amount of fibre an organism consumes through food. Most of the adults eat only 18 gram
per day, where the daily fibre consumption amount should be 30 gram per day. Both fuel intake
and fibre intake improves the constipation and other related issues. Similar to the fluid, fibre can
soften and enlarge the stool and decrease the amount of time that faecal material spends in the
large intestine. Dietary fibre needs water to be digested properly. For this reason it creates urge
to drink liquid. Soluble fibre however absorbs water to become semi-liquid form. Therefore,
soluble fibre makes more urge to intake fluid in human body (K. Bailes & Reeve, 2013). On the
other hand, the insoluble fibre does not absorb water. However, it trap and retain water and
moisture from the small and large intestine. Hence, after consumption of insoluble fibre, a body
can also experience the urge of drinking liquid (Mearin & Rey, 2012). Therefore, theoretically
the fibre consumption has a major role to regulate the fluid consumption level. From the
Pearson’s r test in correlation, it is clearly found that for the sample population the fibber
consumption regulates the fluid intake frequency.
In nursing practice, the relation between fluid intake and fibre intake can be used as a
strategic approach to improve the bowl quality of the patients. Therefore, the dietary chart can be
developed to increase the soluble fibre consumption to increase the amount of fluid intake. In
further research, the exact relation between the consumption soluble and insoluble fibre with the
fluid intake can be analysed for more comprehensive implication plan.
Question 3.
The research question is:
Is functional ability gender specific?
a. Conduct the inferential test as of following steps:
⊘ This is a preview!⊘
Do you want full access?
Subscribe today to unlock all pages.
Trusted by 1+ million students worldwide
10
STATISTICS ASSIGNMENT 2
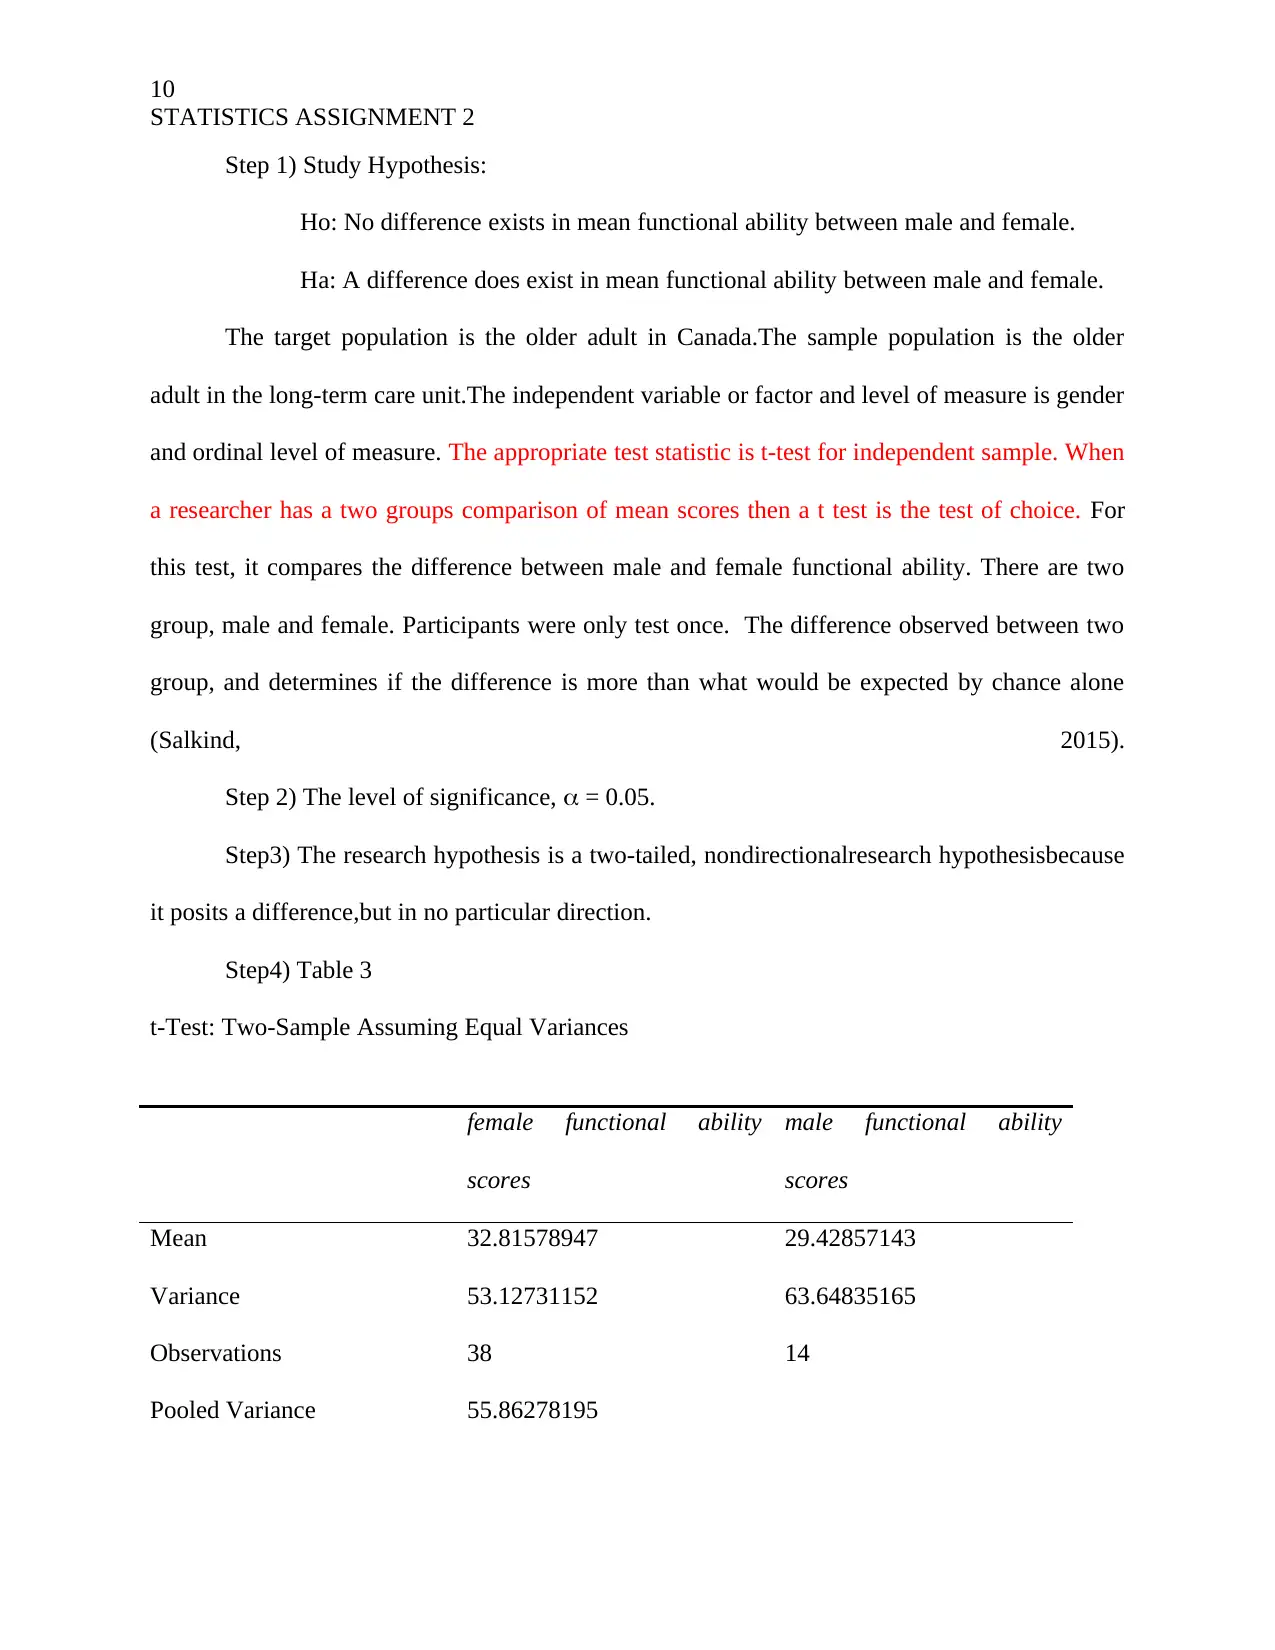
Step 1) Study Hypothesis:
Ho: No difference exists in mean functional ability between male and female.
Ha: A difference does exist in mean functional ability between male and female.
The target population is the older adult in Canada.The sample population is the older
adult in the long-term care unit.The independent variable or factor and level of measure is gender
and ordinal level of measure. The appropriate test statistic is t-test for independent sample. When
a researcher has a two groups comparison of mean scores then a t test is the test of choice. For
this test, it compares the difference between male and female functional ability. There are two
group, male and female. Participants were only test once. The difference observed between two
group, and determines if the difference is more than what would be expected by chance alone
(Salkind, 2015).
Step 2) The level of significance, = 0.05.
Step3) The research hypothesis is a two-tailed, nondirectionalresearch hypothesisbecause
it posits a difference,but in no particular direction.
Step4) Table 3
t-Test: Two-Sample Assuming Equal Variances
female functional ability
scores
male functional ability
scores
Mean 32.81578947 29.42857143
Variance 53.12731152 63.64835165
Observations 38 14
Pooled Variance 55.86278195
STATISTICS ASSIGNMENT 2
Step 1) Study Hypothesis:
Ho: No difference exists in mean functional ability between male and female.
Ha: A difference does exist in mean functional ability between male and female.
The target population is the older adult in Canada.The sample population is the older
adult in the long-term care unit.The independent variable or factor and level of measure is gender
and ordinal level of measure. The appropriate test statistic is t-test for independent sample. When
a researcher has a two groups comparison of mean scores then a t test is the test of choice. For
this test, it compares the difference between male and female functional ability. There are two
group, male and female. Participants were only test once. The difference observed between two
group, and determines if the difference is more than what would be expected by chance alone
(Salkind, 2015).
Step 2) The level of significance, = 0.05.
Step3) The research hypothesis is a two-tailed, nondirectionalresearch hypothesisbecause
it posits a difference,but in no particular direction.
Step4) Table 3
t-Test: Two-Sample Assuming Equal Variances
female functional ability
scores
male functional ability
scores
Mean 32.81578947 29.42857143
Variance 53.12731152 63.64835165
Observations 38 14
Pooled Variance 55.86278195
Paraphrase This Document
Need a fresh take? Get an instant paraphrase of this document with our AI Paraphraser
11
STATISTICS ASSIGNMENT 2
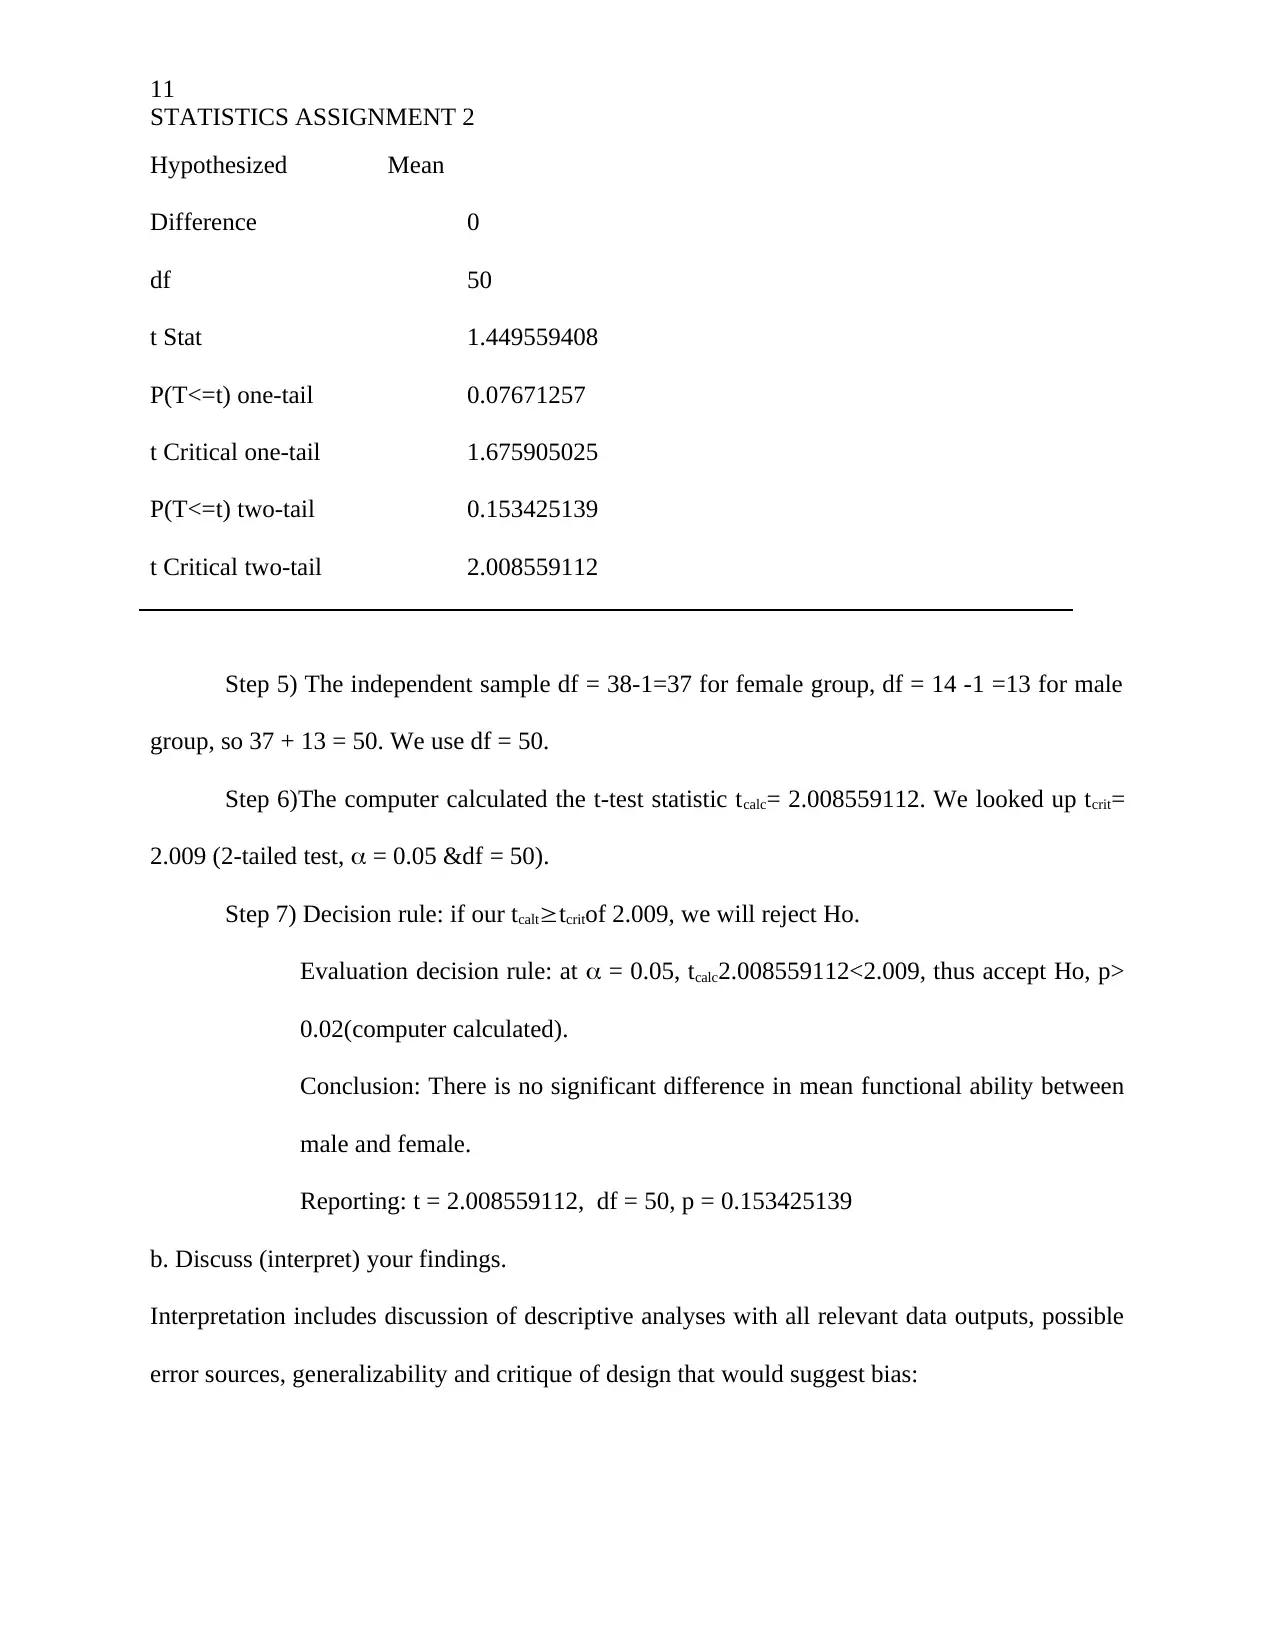
Hypothesized Mean
Difference 0
df 50
t Stat 1.449559408
P(T<=t) one-tail 0.07671257
t Critical one-tail 1.675905025
P(T<=t) two-tail 0.153425139
t Critical two-tail 2.008559112
Step 5) The independent sample df = 38-1=37 for female group, df = 14 -1 =13 for male
group, so 37 + 13 = 50. We use df = 50.
Step 6)The computer calculated the t-test statistic tcalc= 2.008559112. We looked up tcrit=
2.009 (2-tailed test, = 0.05 &df = 50).
Step 7) Decision rule: if our tcalttcritof 2.009, we will reject Ho.
Evaluation decision rule: at = 0.05, tcalc2.008559112<2.009, thus accept Ho, p>
0.02(computer calculated).
Conclusion: There is no significant difference in mean functional ability between
male and female.
Reporting: t = 2.008559112, df = 50, p = 0.153425139
b. Discuss (interpret) your findings.
Interpretation includes discussion of descriptive analyses with all relevant data outputs, possible
error sources, generalizability and critique of design that would suggest bias:
STATISTICS ASSIGNMENT 2
Hypothesized Mean
Difference 0
df 50
t Stat 1.449559408
P(T<=t) one-tail 0.07671257
t Critical one-tail 1.675905025
P(T<=t) two-tail 0.153425139
t Critical two-tail 2.008559112
Step 5) The independent sample df = 38-1=37 for female group, df = 14 -1 =13 for male
group, so 37 + 13 = 50. We use df = 50.
Step 6)The computer calculated the t-test statistic tcalc= 2.008559112. We looked up tcrit=
2.009 (2-tailed test, = 0.05 &df = 50).
Step 7) Decision rule: if our tcalttcritof 2.009, we will reject Ho.
Evaluation decision rule: at = 0.05, tcalc2.008559112<2.009, thus accept Ho, p>
0.02(computer calculated).
Conclusion: There is no significant difference in mean functional ability between
male and female.
Reporting: t = 2.008559112, df = 50, p = 0.153425139
b. Discuss (interpret) your findings.
Interpretation includes discussion of descriptive analyses with all relevant data outputs, possible
error sources, generalizability and critique of design that would suggest bias:
12
STATISTICS ASSIGNMENT 2
Discuss the nursing practice and research implications based on the results from the analysis of
this research question.
Include a discussion of any of the demographic data that you have analyzed in previous
assignment
From the statistical data on “functional ability for eating drinking and ambulation”, it has been
found that the functional ability of an average person from the target population group has the
functional ability of 23 to 28. Therefore, most of the target patient group are unable to drink and
eat properly with the half efficiency score. From the data analysis and T-test, it has been found
that there is no significant difference in mean functional ability between male and female.
Therefore, for nursing practice the caregivers should not develop the assessment plan for
functionality with any gender biased treatment. On the other hand, the viability of a particular
assessment plan for improving functionality can be tested by any random sampling size
irrespective of the gender.
Question 4:
The research question was:
Do clients who require total assistance with toileting have fewer weekly bowel movement
s(ie. less regularity and therefore more constipation) then clients who are independent or require
only some assistance with toileting?
a. Conduct the inferential test as of following steps:
Step 1)Study hypothesis:
⊘ This is a preview!⊘
Do you want full access?
Subscribe today to unlock all pages.
Trusted by 1+ million students worldwide
1 out of 17
Related Documents


Your All-in-One AI-Powered Toolkit for Academic Success.
+13062052269
info@desklib.com
Available 24*7 on WhatsApp / Email
![[object Object]](/_next/static/media/star-bottom.7253800d.svg)
Unlock your academic potential
Copyright © 2020–2026 A2Z Services. All Rights Reserved. Developed and managed by ZUCOL.