Statistics Report: University Descriptive Statistics Analysis

Verified

Added on  2020/05/28

|6
|725
|132
Report
AI Summary
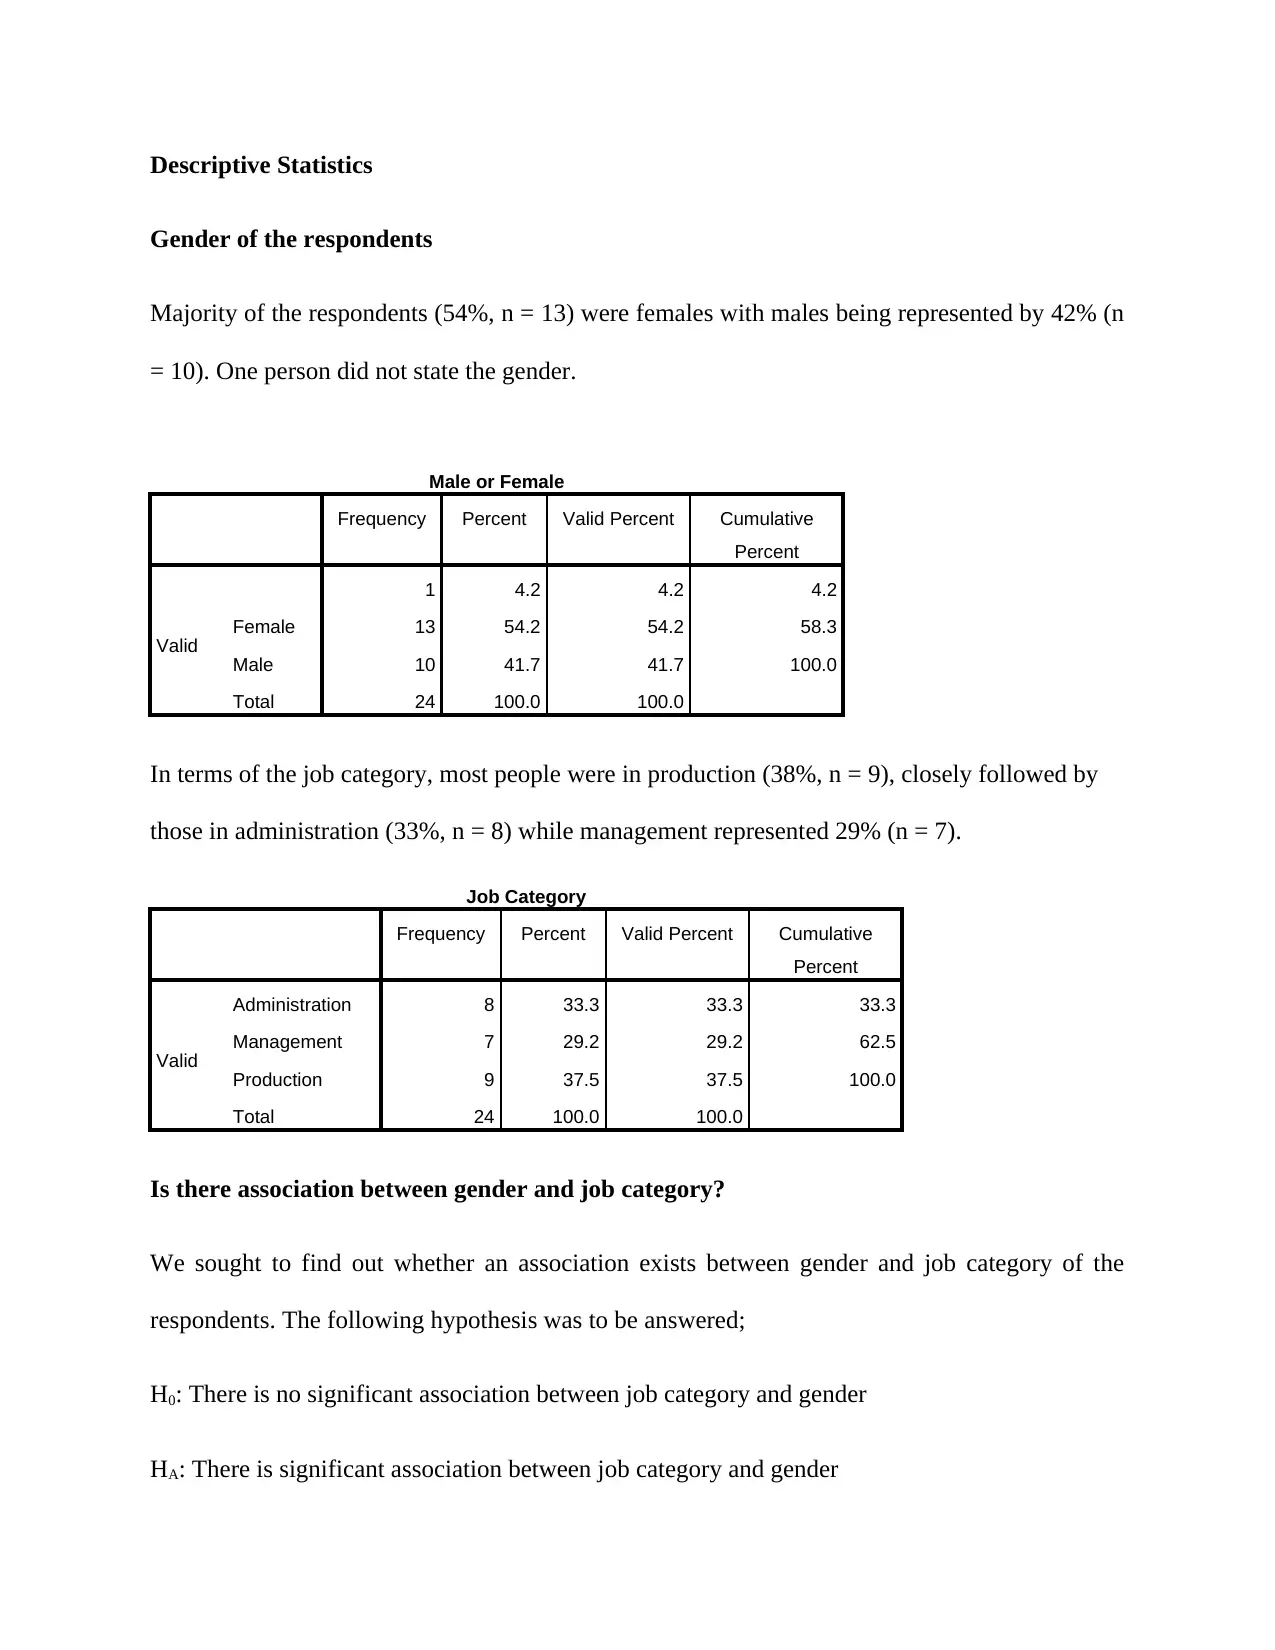
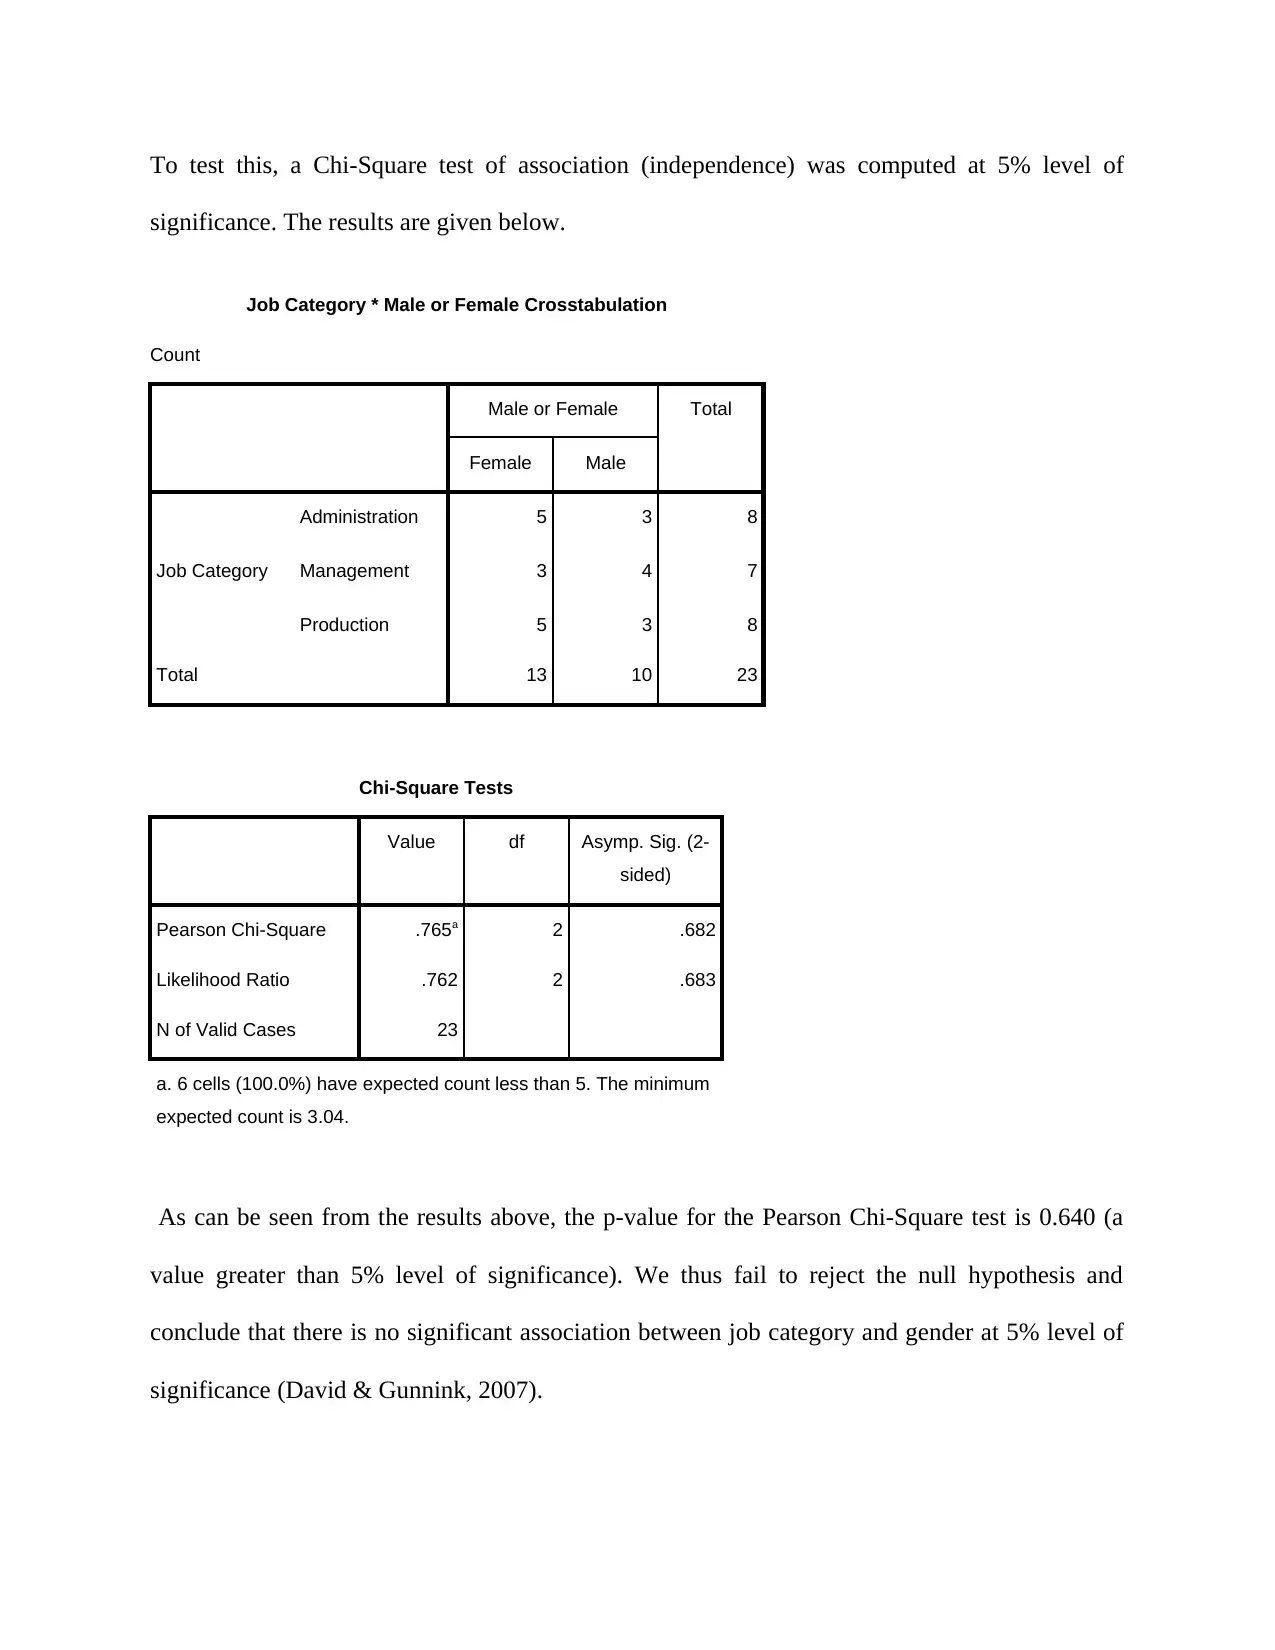
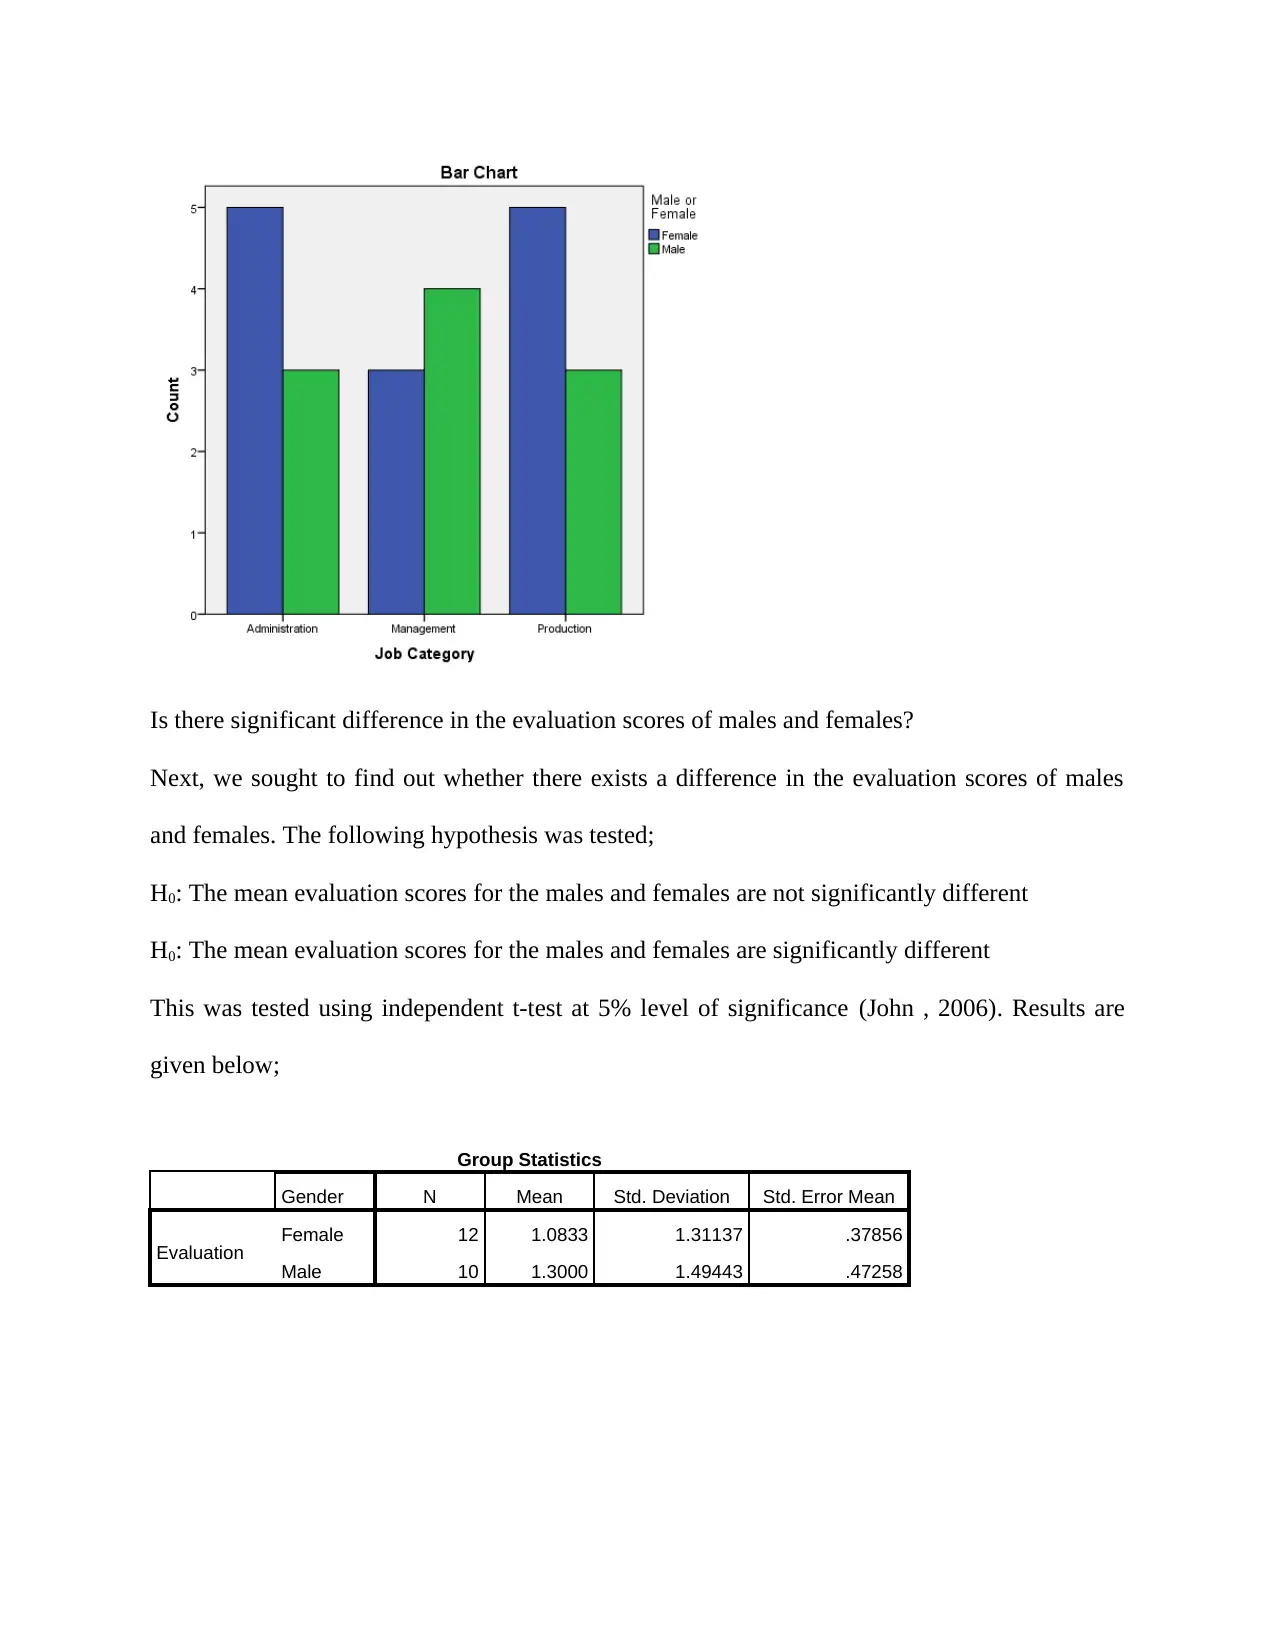
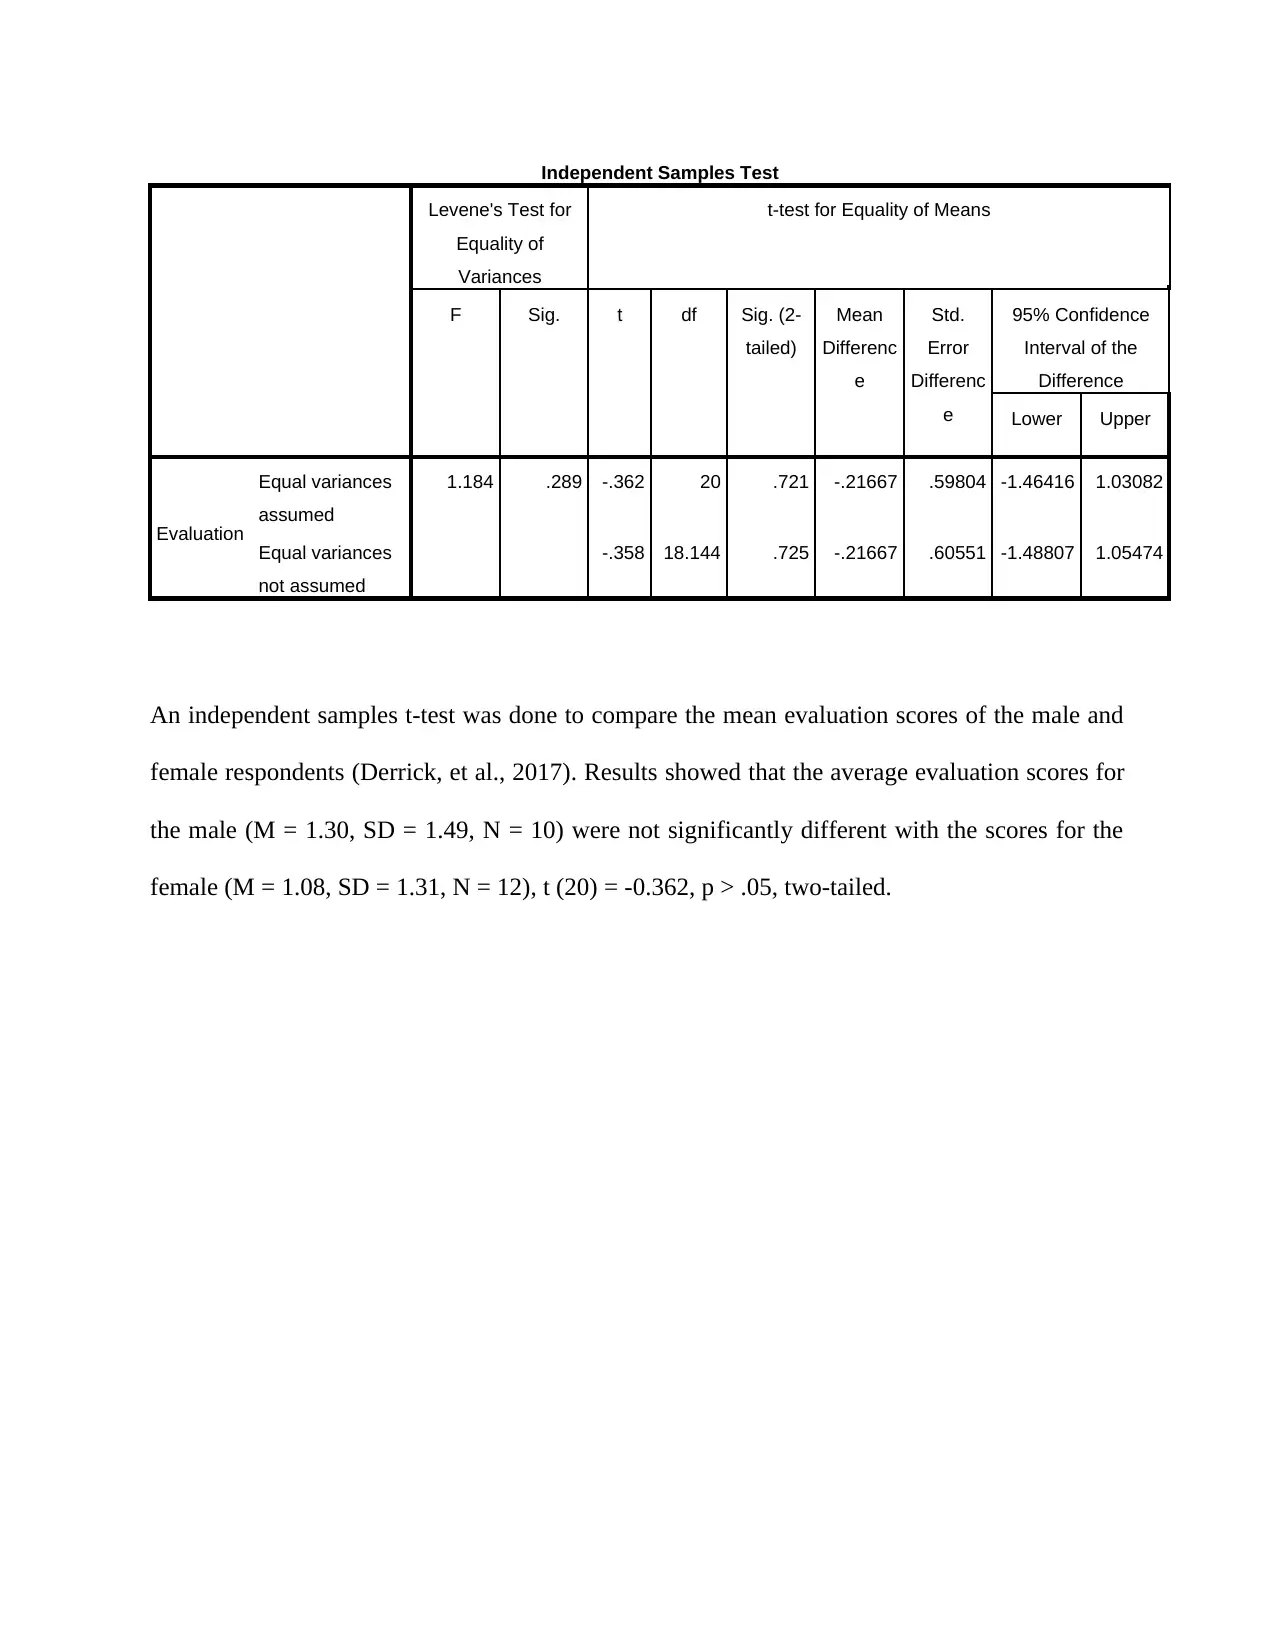
This report presents a descriptive statistical analysis of a dataset, focusing on the relationships between gender, job category, and evaluation scores. The analysis begins with a breakdown of the gender distribution of respondents, followed by an examination of their job categories. The study investigates whether there is a significant association between gender and job category using a Chi-Square test of association, concluding that there is no significant relationship at the 5% level. Furthermore, the report explores the difference in evaluation scores between males and females using an independent t-test, revealing no significant difference in the mean evaluation scores between the two groups. The findings are supported by relevant statistical tests and cited references, providing a comprehensive overview of the data analysis process and the conclusions drawn from it.
tabler-icon-diamond-filled.svg

Contribute Materials

Your contribution can guide someone’s learning journey. Share your documents today.
Document Page
Statistics
Student Name:
University
11th January 2018
tabler-icon-diamond-filled.svg

Secure Best Marks with AI Grader

Need help grading? Try our AI Grader for instant feedback on your assignments.
Document Page
Descriptive Statistics
Gender of the respondents
Majority of the respondents (54%, n = 13) were females with males being represented by 42% (n
= 10). One person did not state the gender.
Male or Female
Frequency Percent Valid Percent Cumulative
Percent
Valid
1 4.2 4.2 4.2
Female 13 54.2 54.2 58.3
Male 10 41.7 41.7 100.0
Total 24 100.0 100.0
In terms of the job category, most people were in production (38%, n = 9), closely followed by
those in administration (33%, n = 8) while management represented 29% (n = 7).
Job Category
Frequency Percent Valid Percent Cumulative
Percent
Valid
Administration 8 33.3 33.3 33.3
Management 7 29.2 29.2 62.5
Production 9 37.5 37.5 100.0
Total 24 100.0 100.0
Is there association between gender and job category?
We sought to find out whether an association exists between gender and job category of the
respondents. The following hypothesis was to be answered;
H0: There is no significant association between job category and gender
HA: There is significant association between job category and gender
Document Page
To test this, a Chi-Square test of association (independence) was computed at 5% level of
significance. The results are given below.
Job Category * Male or Female Crosstabulation
Count
Male or Female Total
Female Male
Job Category
Administration 5 3 8
Management 3 4 7
Production 5 3 8
Total 13 10 23
Chi-Square Tests
Value df Asymp. Sig. (2-
sided)
Pearson Chi-Square .765a 2 .682
Likelihood Ratio .762 2 .683
N of Valid Cases 23
a. 6 cells (100.0%) have expected count less than 5. The minimum
expected count is 3.04.
As can be seen from the results above, the p-value for the Pearson Chi-Square test is 0.640 (a
value greater than 5% level of significance). We thus fail to reject the null hypothesis and
conclude that there is no significant association between job category and gender at 5% level of
significance (David & Gunnink, 2007).
Document Page
Is there significant difference in the evaluation scores of males and females?
Next, we sought to find out whether there exists a difference in the evaluation scores of males
and females. The following hypothesis was tested;
H0: The mean evaluation scores for the males and females are not significantly different
H0: The mean evaluation scores for the males and females are significantly different
This was tested using independent t-test at 5% level of significance (John , 2006). Results are
given below;
Group Statistics
Gender N Mean Std. Deviation Std. Error Mean
Evaluation Female 12 1.0833 1.31137 .37856
Male 10 1.3000 1.49443 .47258
tabler-icon-diamond-filled.svg

Secure Best Marks with AI Grader

Need help grading? Try our AI Grader for instant feedback on your assignments.
Document Page
Independent Samples Test
Levene's Test for
Equality of
Variances
t-test for Equality of Means
F Sig. t df Sig. (2-
tailed)
Mean
Differenc
e
Std.
Error
Differenc
e
95% Confidence
Interval of the
Difference
Lower Upper
Evaluation
Equal variances
assumed
1.184 .289 -.362 20 .721 -.21667 .59804 -1.46416 1.03082
Equal variances
not assumed
-.358 18.144 .725 -.21667 .60551 -1.48807 1.05474
An independent samples t-test was done to compare the mean evaluation scores of the male and
female respondents (Derrick, et al., 2017). Results showed that the average evaluation scores for
the male (M = 1.30, SD = 1.49, N = 10) were not significantly different with the scores for the
female (M = 1.08, SD = 1.31, N = 12), t (20) = -0.362, p > .05, two-tailed.
Document Page
References
David, H. A. & Gunnink, J. L., 2007. The Paired t Test Under Artificial Pairing. The American
Statistician, 51(1), pp. 9-12.
Derrick, N., Toher, D. & White, P., 2017. How to compare the means of two samples that
include paired observations and independent observations.
John , A. R., 2006. Mathematical Statistics and Data Analysis.
chevron_up_icon
1 out of 6
circle_padding
hide_on_mobile
zoom_out_icon
logo.png

Your All-in-One AI-Powered Toolkit for Academic Success.

Available 24*7 on WhatsApp / Email

[object Object]