Statistics for Management: Comprehensive Analysis Report
VerifiedAdded on 2021/01/03
|21
|4631
|478
Report
AI Summary
This report presents a statistical analysis of management data, focusing on various aspects of employment and economic indicators. The report begins with an analysis of annual earnings in the private and public sectors, examining gender pay gaps and changes over time. It utilizes statistical tools to calculate and compare earnings, presenting data in tables and charts. The analysis extends to hourly payments, calculating mean, median, and standard deviation. The report also delves into the application of EOQ (Economic Order Quantity) for assessing deliveries and order policies. Graphical representations, such as line charts and ogive charts, are used to illustrate the data effectively. The report provides insights into the choice of graphical methods and concludes with a summary of the findings and references used.

STATISTICS FOR
MANAGEMENT
MANAGEMENT
Paraphrase This Document
Need a fresh take? Get an instant paraphrase of this document with our AI Paraphraser
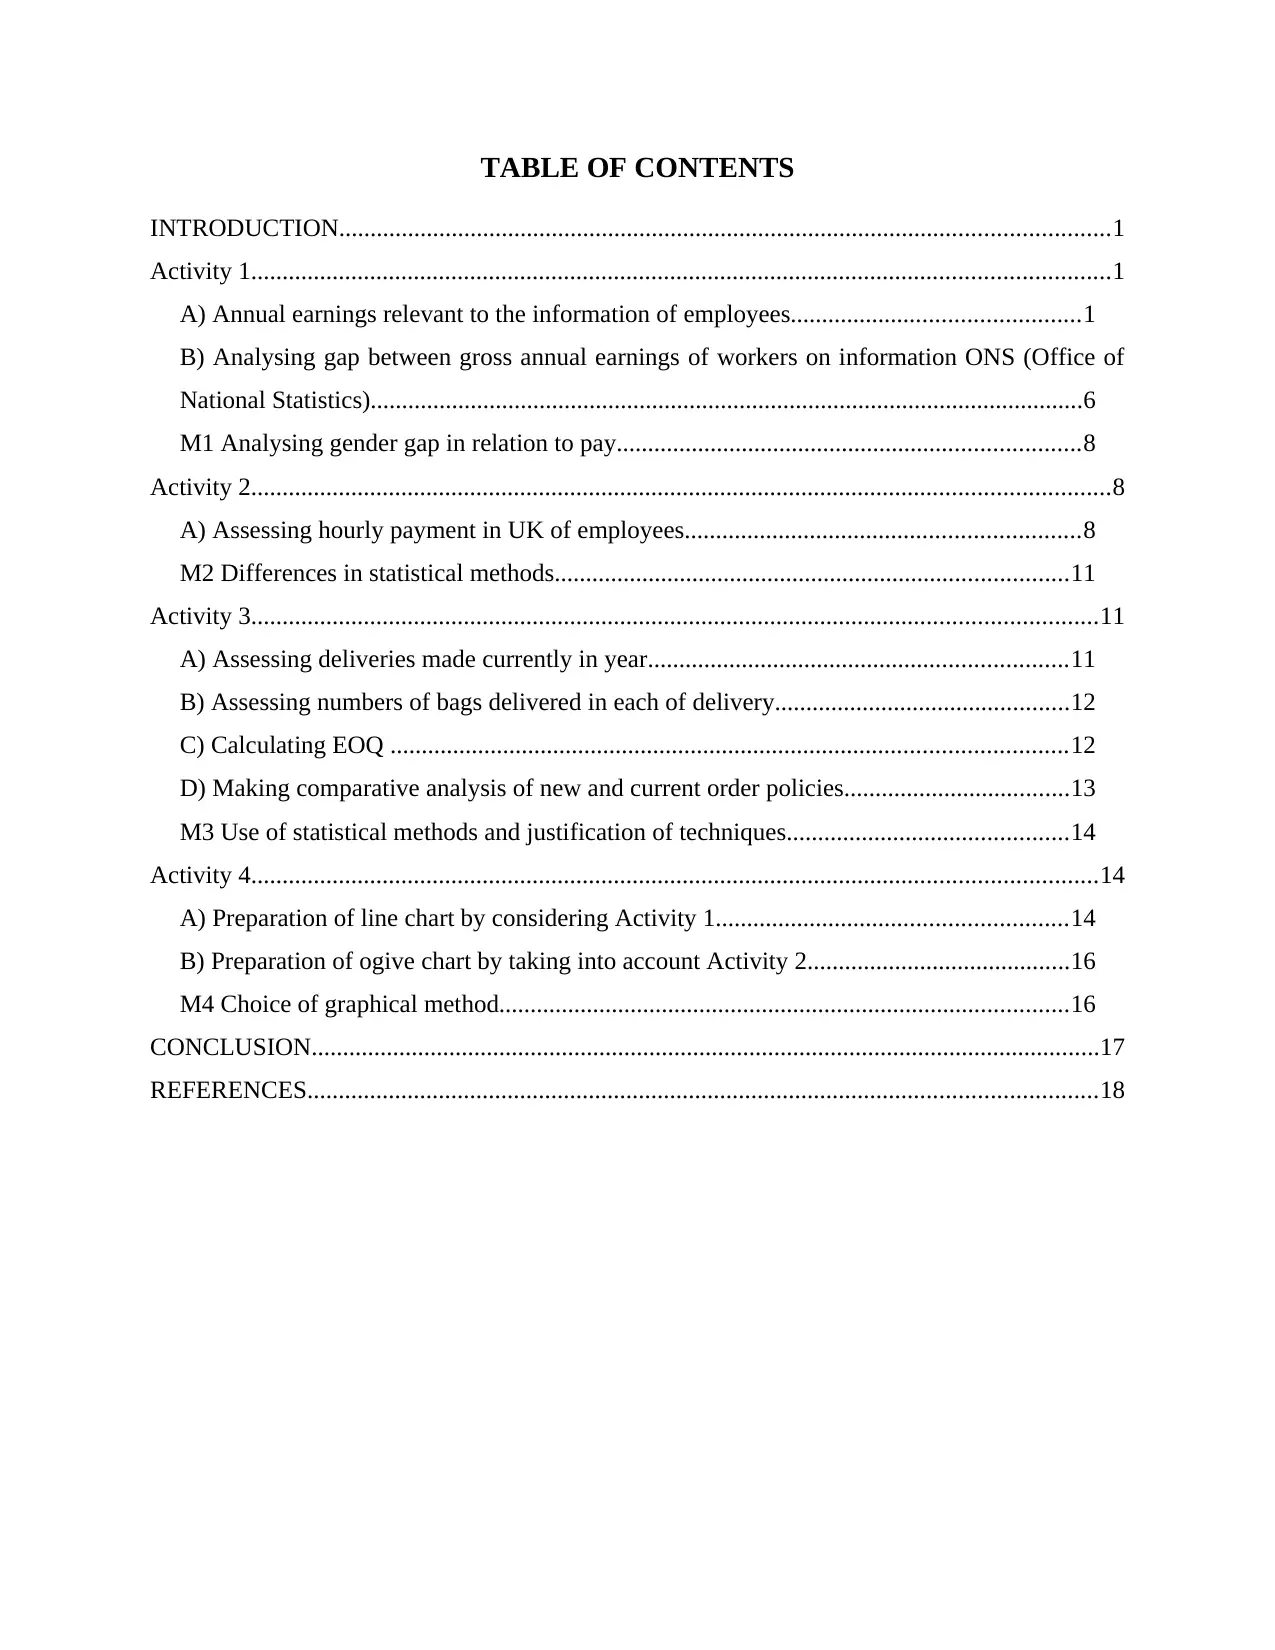
TABLE OF CONTENTS
INTRODUCTION...........................................................................................................................1
Activity 1.........................................................................................................................................1
A) Annual earnings relevant to the information of employees..............................................1
B) Analysing gap between gross annual earnings of workers on information ONS (Office of
National Statistics)..................................................................................................................6
M1 Analysing gender gap in relation to pay..........................................................................8
Activity 2.........................................................................................................................................8
A) Assessing hourly payment in UK of employees...............................................................8
M2 Differences in statistical methods..................................................................................11
Activity 3.......................................................................................................................................11
A) Assessing deliveries made currently in year...................................................................11
B) Assessing numbers of bags delivered in each of delivery...............................................12
C) Calculating EOQ ............................................................................................................12
D) Making comparative analysis of new and current order policies....................................13
M3 Use of statistical methods and justification of techniques.............................................14
Activity 4.......................................................................................................................................14
A) Preparation of line chart by considering Activity 1........................................................14
B) Preparation of ogive chart by taking into account Activity 2..........................................16
M4 Choice of graphical method...........................................................................................16
CONCLUSION..............................................................................................................................17
REFERENCES..............................................................................................................................18
INTRODUCTION
Statistics for management is crucial which helps in taking enhanced decisions with the
help of tools. Present report deals with applying statistical tools in various scenarios' given. The
gap is analysed between male and females in private and public sector. Mean, median and
standard deviation are calculated for analysing hourly earnings of workers in regions of UK.
EOQ is used to assess rice bags and deliveries in particular year. Hence, statistical tools are
applied and charts are prepared to present data in meaningful format.
Activity 1
A) Annual earnings relevant to the information of employees
1. Assessing changes in relation to gross annual earning in both sectors
The gross annual earnings or salaries of workers in private and public sector has been
considerably changed since 2010. These facts are highlighted in statistical tools drawn which are
prepared below-
Male Workers
Year Private sector
Annual salary
change in % Public sector
Annual salary
change in %
2010 31264 27000
2011 31380 0.40% 27233 0.86%
2012 31816 1.39% 27705 1.73%
2013 32541 2.28% 28201 1.79%
2014 32878 1.04% 28442 0.85%
2015 33685 2.45% 28881 1.54%
2016 34011 0.97% 29679 2.76%
1
⊘ This is a preview!⊘
Do you want full access?
Subscribe today to unlock all pages.
Trusted by 1+ million students worldwide
2010 2011 2012 2013 2014 2015 2016
0
5000
10000
15000
20000
25000
30000
35000
Private
Public
It can be interpreted from the above table prepared of earnings of male employees has changed
drastically as provided in data. From financial year 2010 to 2016, data is drawn showing that
earnings in both sector is increased up to a high extent. The earnings of private sector employees
is more in quantum in comparison to public sector (Wang and Calvano, 2015). It is evident from
the fact that earnings in private sector were 31264 in 2010 which increased to 31380 in next year.
Moreover, in 2012, figure reached to 31816 and further maximised to 32541 in 2013. It was
further increased to 32878 in 2014, 33685 in next year and then 34011 in 2016. This clearly
shows that salaries has been multiplied quite effectually. On the other hand, earnings in public
sector were 27000 in 2010, maximised in 2011 to 27233, 28201 in 2012. While, it reached to
28442 in 2014, 28881 figures in 2015 and 29679 in 2016. Thus, gross annual earnings are
increased in private sector as compared to public sector up to a high extent.
Female Workers
Year Private sector
Annual salary
change in % Public sector
Annual salary
change in %
2010 26113 19532
2011 26470 1.37% 19565 0.17%
2012 26636 0.63% 20313 3.82%
2
Paraphrase This Document
Need a fresh take? Get an instant paraphrase of this document with our AI Paraphraser
2013 27338 2.64% 20698 1.90%
2014 27705 1.34% 21017 1.54%
2015 27900 0.70% 21403 1.84%
2016 28053 0.55% 22251 3.96%
2010 2011 2012 2013 2014 2015 2016
0
5000
10000
15000
20000
25000
30000
Private
Public
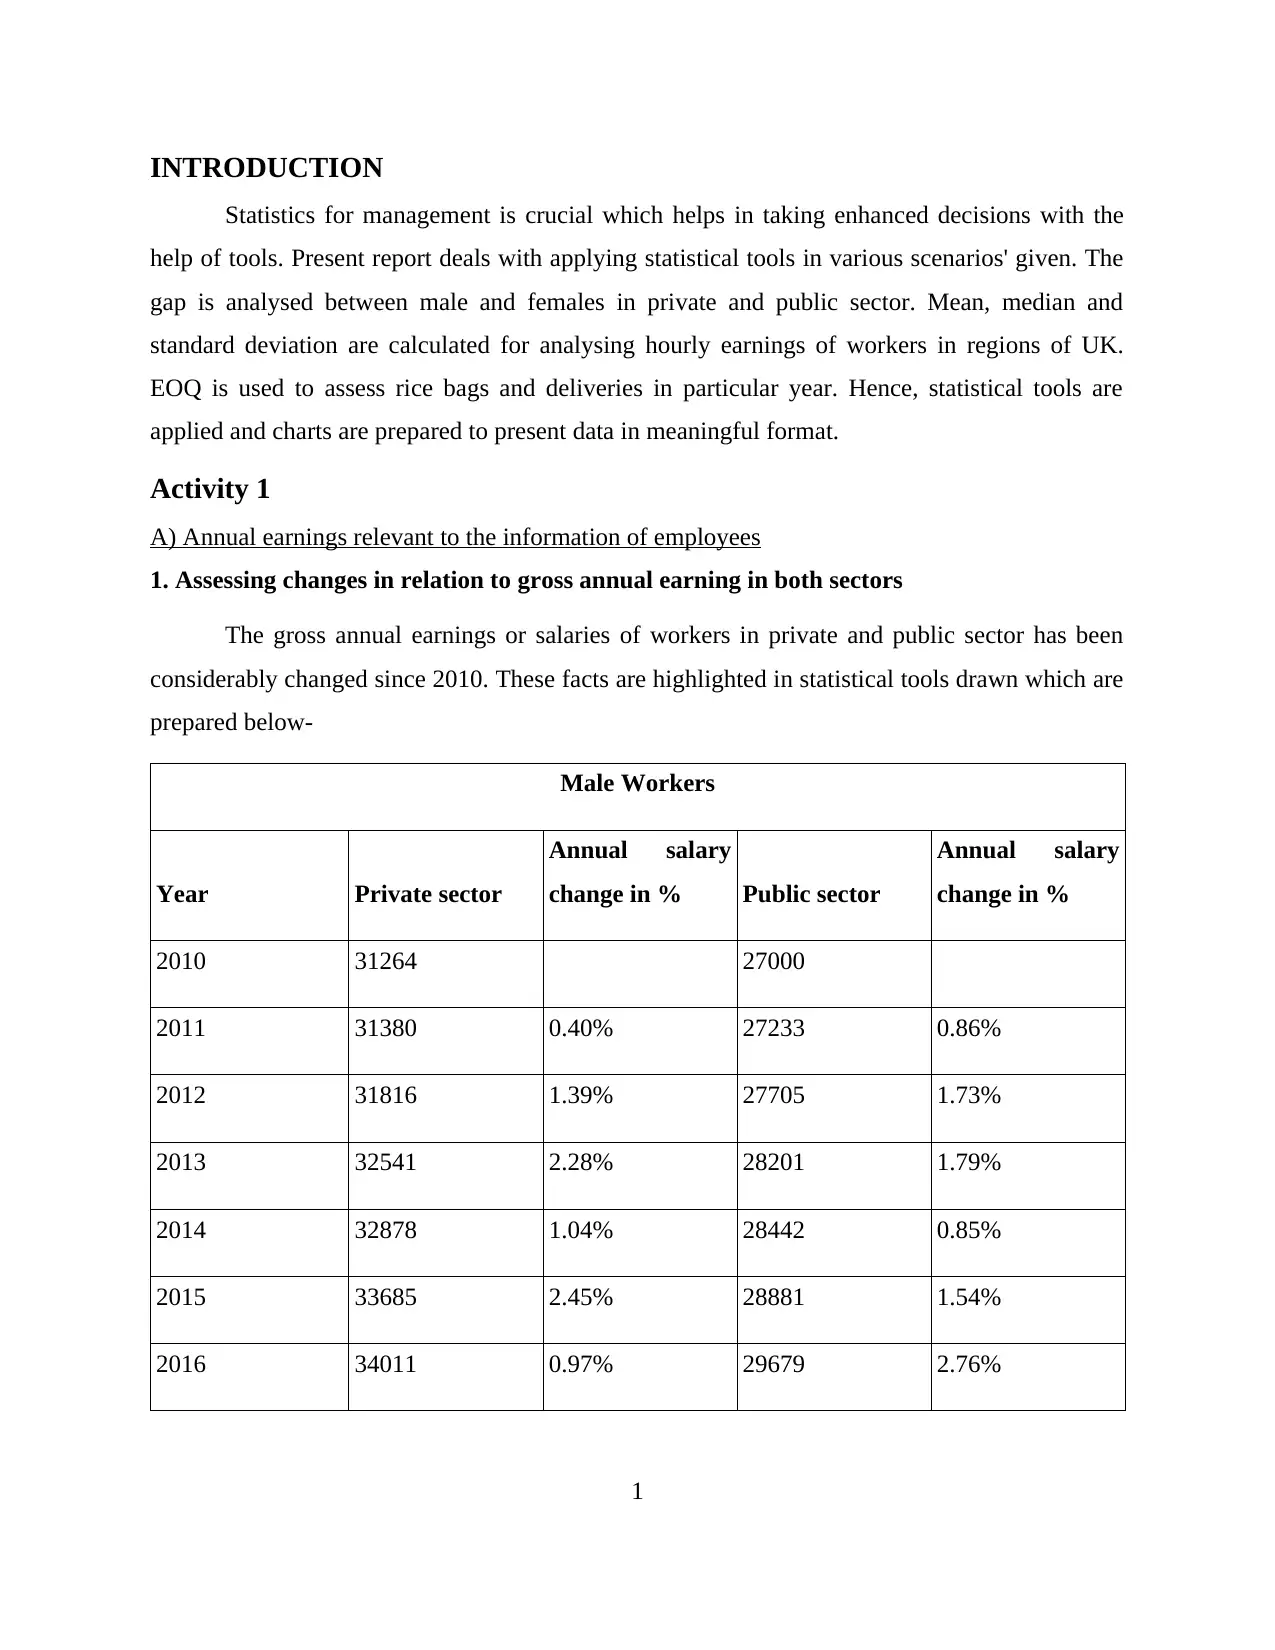
It can be analysed from the table drawn above that earnings of female workers in both the
sectors such as private and public sector has been increased quite effectually. It is evident from
the fact that % change in income of females in sectors is considerably maximised year after year.
It can be interpreted that gross annual earnings in private sector were 26113 in 2010, increased to
26470 in 2011 and further maximised in 2012 to 26636. While, figure in 2013 were hiked to
27338 and reached to 27705 in next year. Furthermore, amount increased to 27900 in 2015 and
maximised to 28053 in 2016. On the other side, earnings in public sector has undergone change
as well. The figure was 19532 and 19565 in 2010 and 2011 respectively. It elevated to 20313 in
next year and 20698 in 2013 which hiked to 21017 in 2014. Moreover, earnings were 21403 and
3
2014 27705 1.34% 21017 1.54%
2015 27900 0.70% 21403 1.84%
2016 28053 0.55% 22251 3.96%
2010 2011 2012 2013 2014 2015 2016
0
5000
10000
15000
20000
25000
30000
Private
Public
It can be analysed from the table drawn above that earnings of female workers in both the
sectors such as private and public sector has been increased quite effectually. It is evident from
the fact that % change in income of females in sectors is considerably maximised year after year.
It can be interpreted that gross annual earnings in private sector were 26113 in 2010, increased to
26470 in 2011 and further maximised in 2012 to 26636. While, figure in 2013 were hiked to
27338 and reached to 27705 in next year. Furthermore, amount increased to 27900 in 2015 and
maximised to 28053 in 2016. On the other side, earnings in public sector has undergone change
as well. The figure was 19532 and 19565 in 2010 and 2011 respectively. It elevated to 20313 in
next year and 20698 in 2013 which hiked to 21017 in 2014. Moreover, earnings were 21403 and
3
22251 in 2015 and 2016 respectively. These figures clearly shows that females have more
quantum of earnings in private sector than those of public sector.
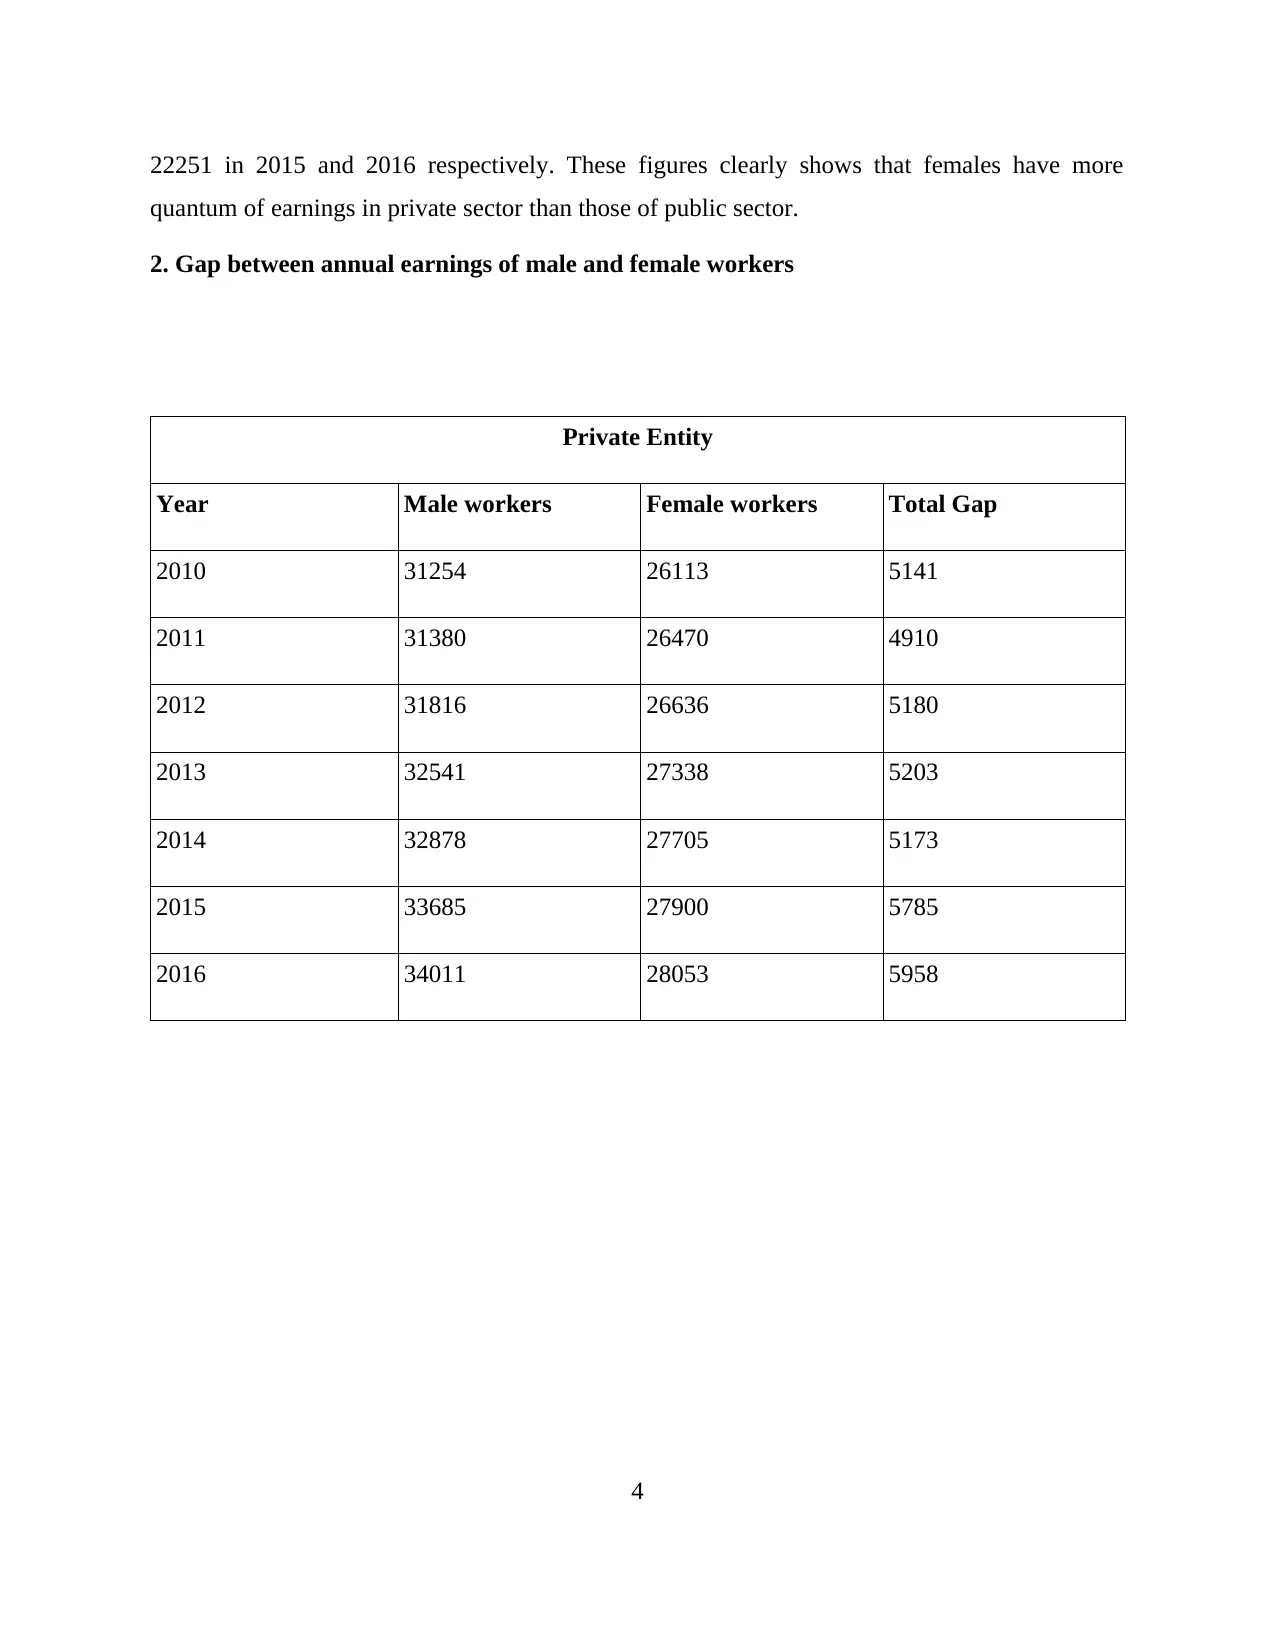
2. Gap between annual earnings of male and female workers
Private Entity
Year Male workers Female workers Total Gap
2010 31254 26113 5141
2011 31380 26470 4910
2012 31816 26636 5180
2013 32541 27338 5203
2014 32878 27705 5173
2015 33685 27900 5785
2016 34011 28053 5958
4
quantum of earnings in private sector than those of public sector.
2. Gap between annual earnings of male and female workers
Private Entity
Year Male workers Female workers Total Gap
2010 31254 26113 5141
2011 31380 26470 4910
2012 31816 26636 5180
2013 32541 27338 5203
2014 32878 27705 5173
2015 33685 27900 5785
2016 34011 28053 5958
4
⊘ This is a preview!⊘
Do you want full access?
Subscribe today to unlock all pages.
Trusted by 1+ million students worldwide
2010 2011 2012 2013 2014 2015 2016
0
1000
2000
3000
4000
5000
6000
The above table shows total gap observed in male and female workforces in private
entity. It can be analysed from table that earnings of male employees are more in comparison to
that with females in the same sector. The figures are considerably increased of males and females
in the period starting from 2010 to 2016. Total gap can be easily recognised as it was 5141 in
2010, decreased to 4910 in 2011. While, it reached to 5180 in next period and then maximised to
5203 in 2013 and then to 5173 in 2014. The figure was 5785 in 2015 and 5958 in 2016 which
shows that productivity of total workforces has been elevated up to a high extent. This clearly
implies both male and female are performing in accordance to the standards set and helping UK
in accelerating overall growth in the best possible manner. The capacity of workforce
considering female and male employees is hiked in case of private sector.
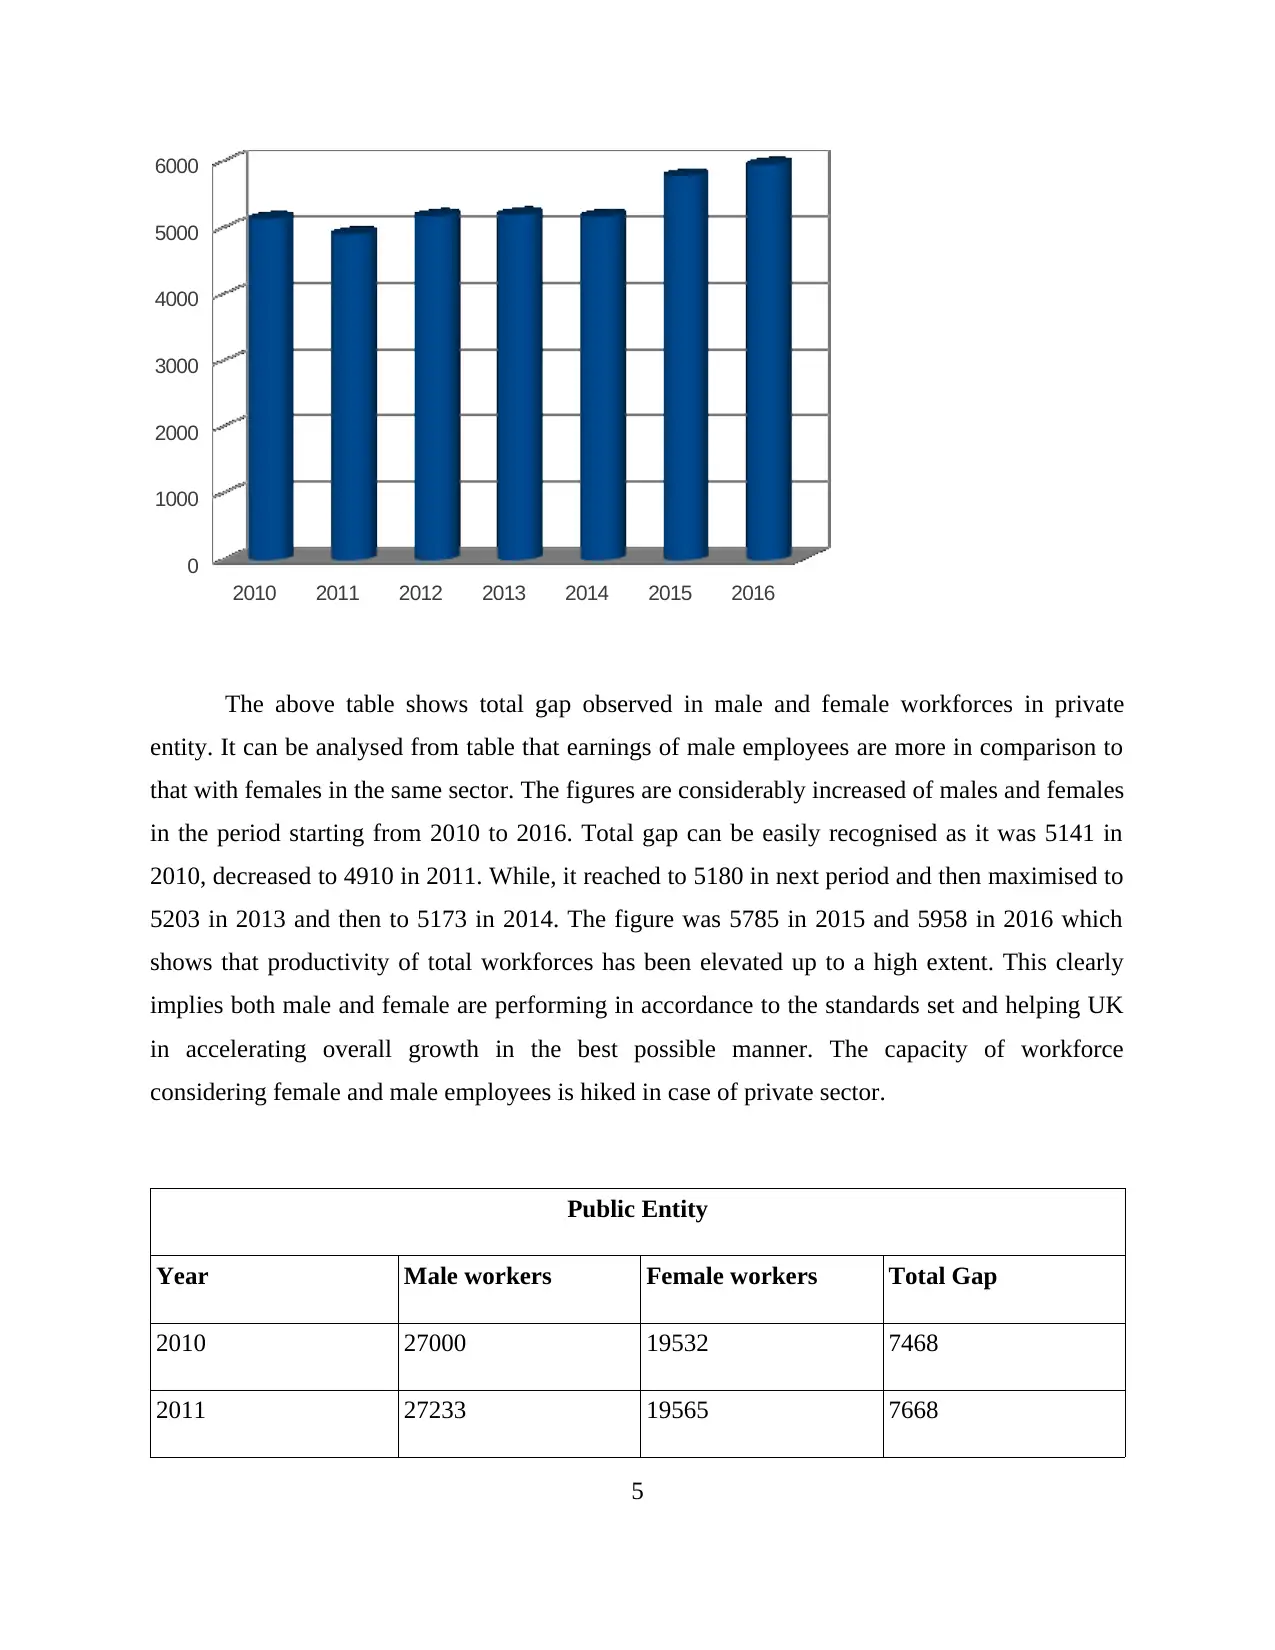
Public Entity
Year Male workers Female workers Total Gap
2010 27000 19532 7468
2011 27233 19565 7668
5
0
1000
2000
3000
4000
5000
6000
The above table shows total gap observed in male and female workforces in private
entity. It can be analysed from table that earnings of male employees are more in comparison to
that with females in the same sector. The figures are considerably increased of males and females
in the period starting from 2010 to 2016. Total gap can be easily recognised as it was 5141 in
2010, decreased to 4910 in 2011. While, it reached to 5180 in next period and then maximised to
5203 in 2013 and then to 5173 in 2014. The figure was 5785 in 2015 and 5958 in 2016 which
shows that productivity of total workforces has been elevated up to a high extent. This clearly
implies both male and female are performing in accordance to the standards set and helping UK
in accelerating overall growth in the best possible manner. The capacity of workforce
considering female and male employees is hiked in case of private sector.
Public Entity
Year Male workers Female workers Total Gap
2010 27000 19532 7468
2011 27233 19565 7668
5
Paraphrase This Document
Need a fresh take? Get an instant paraphrase of this document with our AI Paraphraser
2012 27705 20313 7392
2013 28201 20698 7503
2014 28442 21017 7425
2015 28881 21403 7478
2016 29679 22251 7428
2010 2011 2012 2013 2014 2015 2016
7250
7300
7350
7400
7450
7500
7550
7600
7650
7700
It can be interpreted that from table that earnings attained by both male and female is also
maximised in case of public sector. This is evident from the fact that workforces are performing
well and as such, economic growth is enhanced in a better way. The total gap in 2010 between
male and female was 7468 in 2010 which increased to 7668 in 2011 and then decreased to 7392
in 2012. The figure reached to 7503 in 2013 and reduced to 7425 in 2014. While, it was 7478 in
next year and decreased to 7428 in 2016. This clearly shows that average difference in earnings
is around 7500 between both workers in public sector. In all, it can be said that higher amount is
gap is found in public sector than private sector.
6
B) Analysing gap between gross annual earnings of workers on information ONS (Office of
National Statistics)
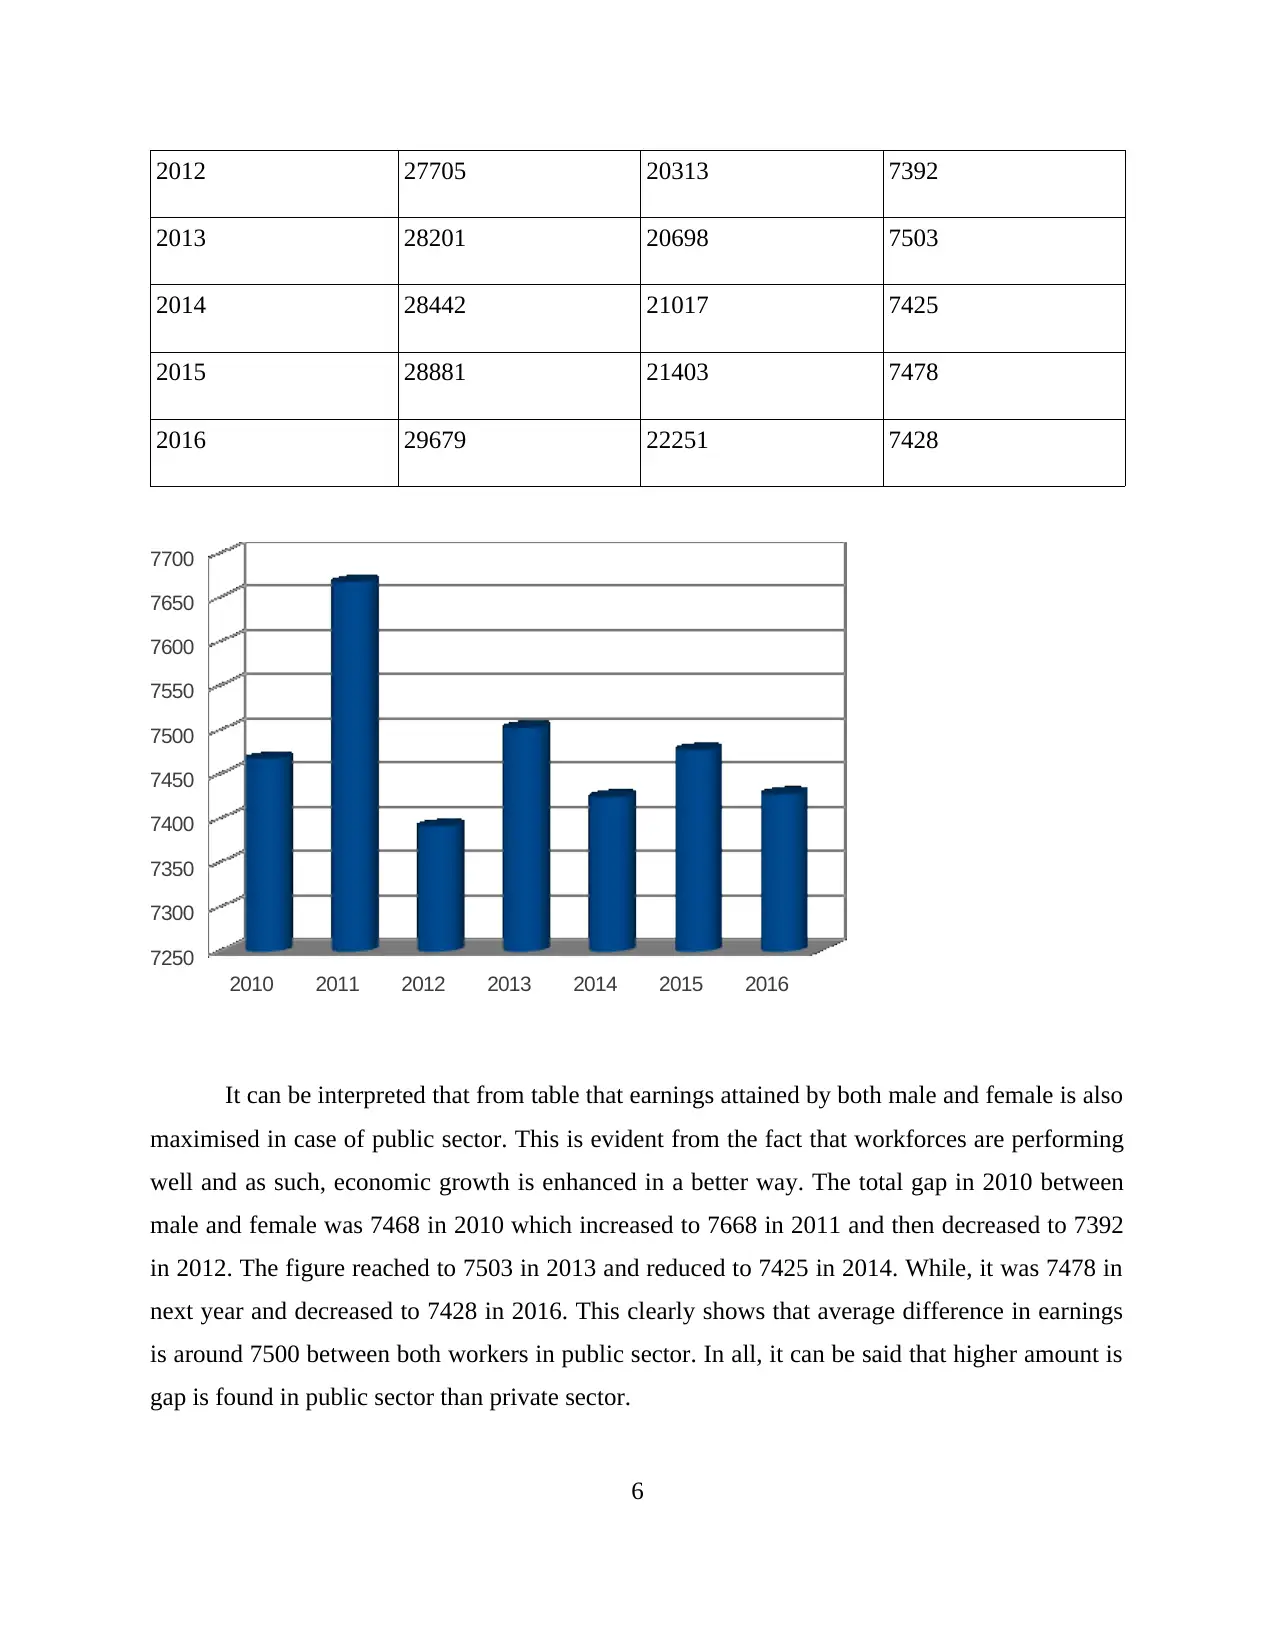
1. Gap between finance and education in UK
Illustration 1: UK Employment sector Source: Trends in self-employment in the UK: 2001 to
2015, 2018)
It can be analysed from the above chart that gap between finance and educational sector
is more or huge as depicted by it. The UK government has implemented various policies and
plans which was needed after the adverse impact of GFC (Global Financial Crisis). Thus, plans
have been implemented in order to inject overall efficiency and economic growth of nation in the
best possible manner. The employees are working in the fields such as part-time and full-time in
sectors. It is highlighted that educational sector is lacking growth as compared to financial sector
and as such, full-time employment is on the top of list carried out from the statistical data
provided by ONS in effective manner.
2. Assessing health and social care and administration staff
7
National Statistics)
1. Gap between finance and education in UK
Illustration 1: UK Employment sector Source: Trends in self-employment in the UK: 2001 to
2015, 2018)
It can be analysed from the above chart that gap between finance and educational sector
is more or huge as depicted by it. The UK government has implemented various policies and
plans which was needed after the adverse impact of GFC (Global Financial Crisis). Thus, plans
have been implemented in order to inject overall efficiency and economic growth of nation in the
best possible manner. The employees are working in the fields such as part-time and full-time in
sectors. It is highlighted that educational sector is lacking growth as compared to financial sector
and as such, full-time employment is on the top of list carried out from the statistical data
provided by ONS in effective manner.
2. Assessing health and social care and administration staff
7
⊘ This is a preview!⊘
Do you want full access?
Subscribe today to unlock all pages.
Trusted by 1+ million students worldwide
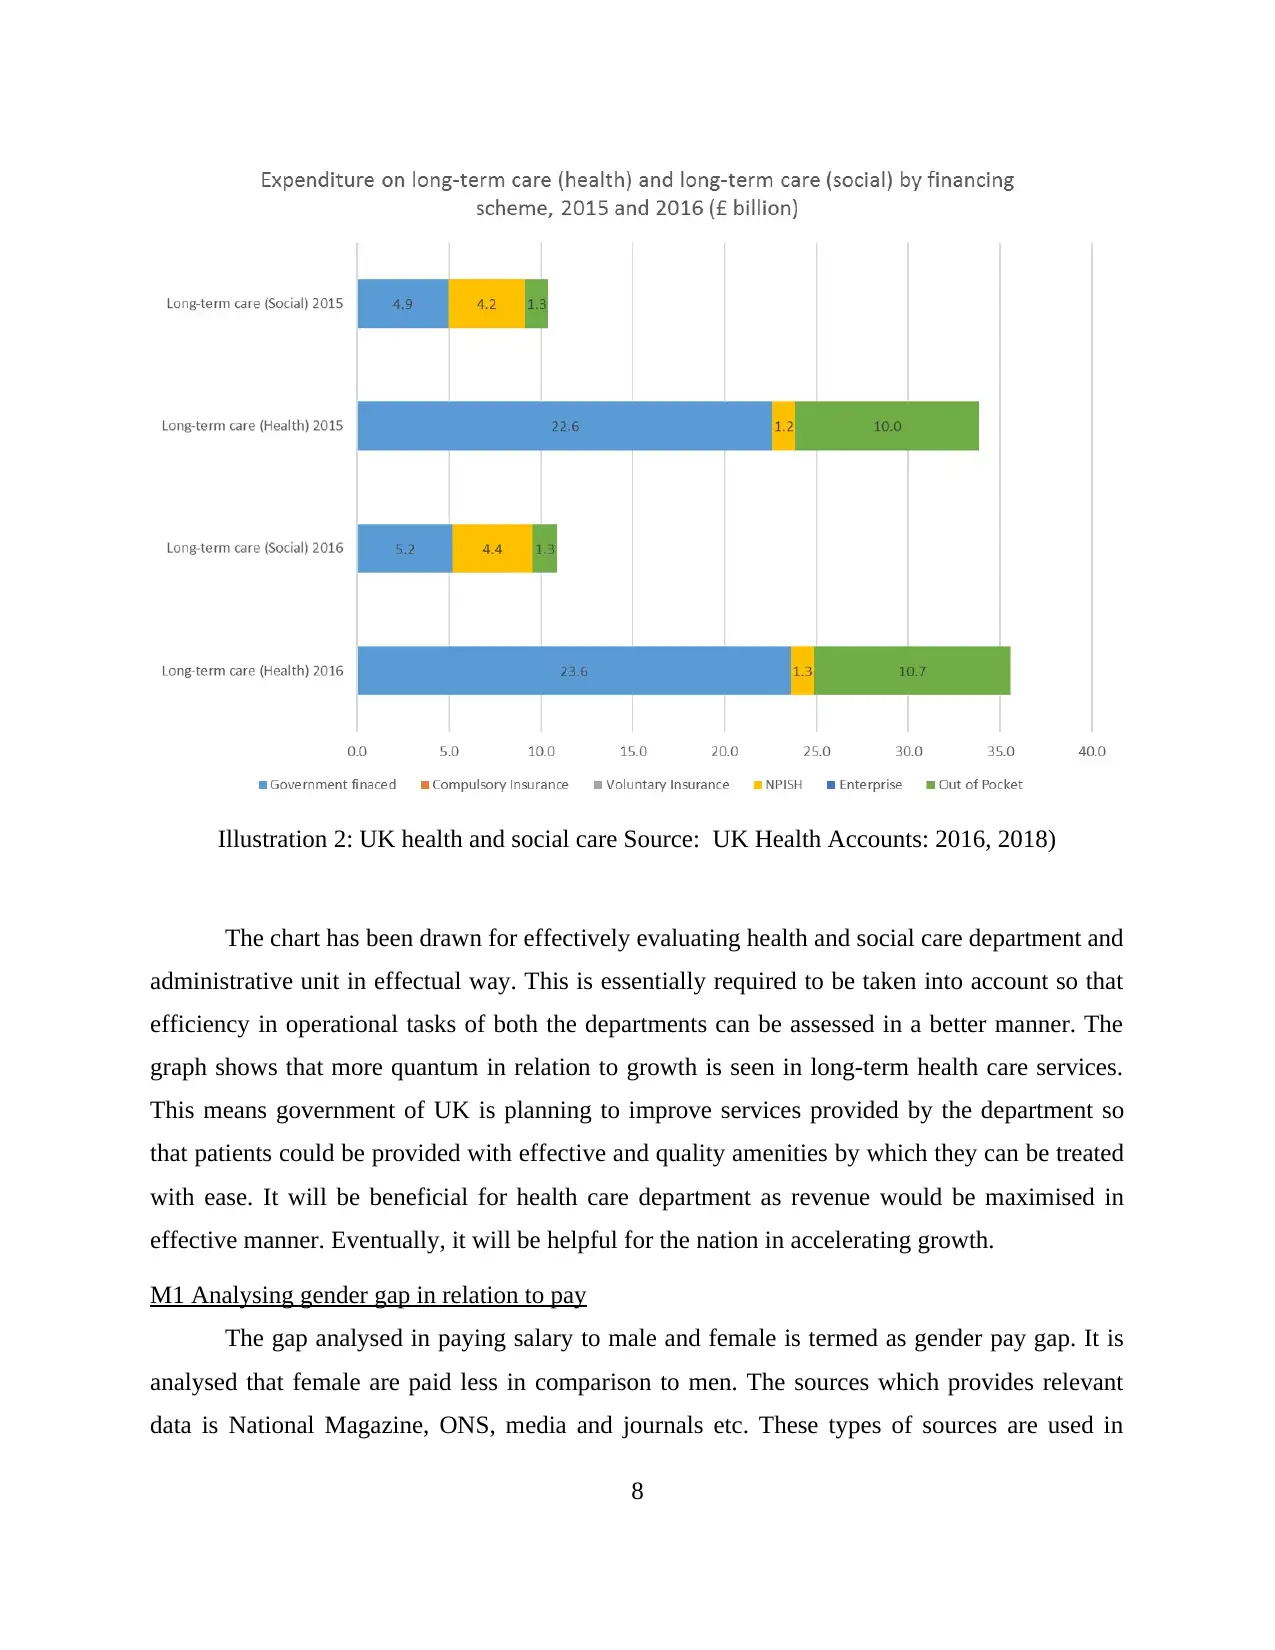
Illustration 2: UK health and social care Source: UK Health Accounts: 2016, 2018)
The chart has been drawn for effectively evaluating health and social care department and
administrative unit in effectual way. This is essentially required to be taken into account so that
efficiency in operational tasks of both the departments can be assessed in a better manner. The
graph shows that more quantum in relation to growth is seen in long-term health care services.
This means government of UK is planning to improve services provided by the department so
that patients could be provided with effective and quality amenities by which they can be treated
with ease. It will be beneficial for health care department as revenue would be maximised in
effective manner. Eventually, it will be helpful for the nation in accelerating growth.
M1 Analysing gender gap in relation to pay
The gap analysed in paying salary to male and female is termed as gender pay gap. It is
analysed that female are paid less in comparison to men. The sources which provides relevant
data is National Magazine, ONS, media and journals etc. These types of sources are used in
8
Paraphrase This Document
Need a fresh take? Get an instant paraphrase of this document with our AI Paraphraser
order to collect data which is secondary data and thus, it is used by researcher in attaining
outcome of research.
Activity 2
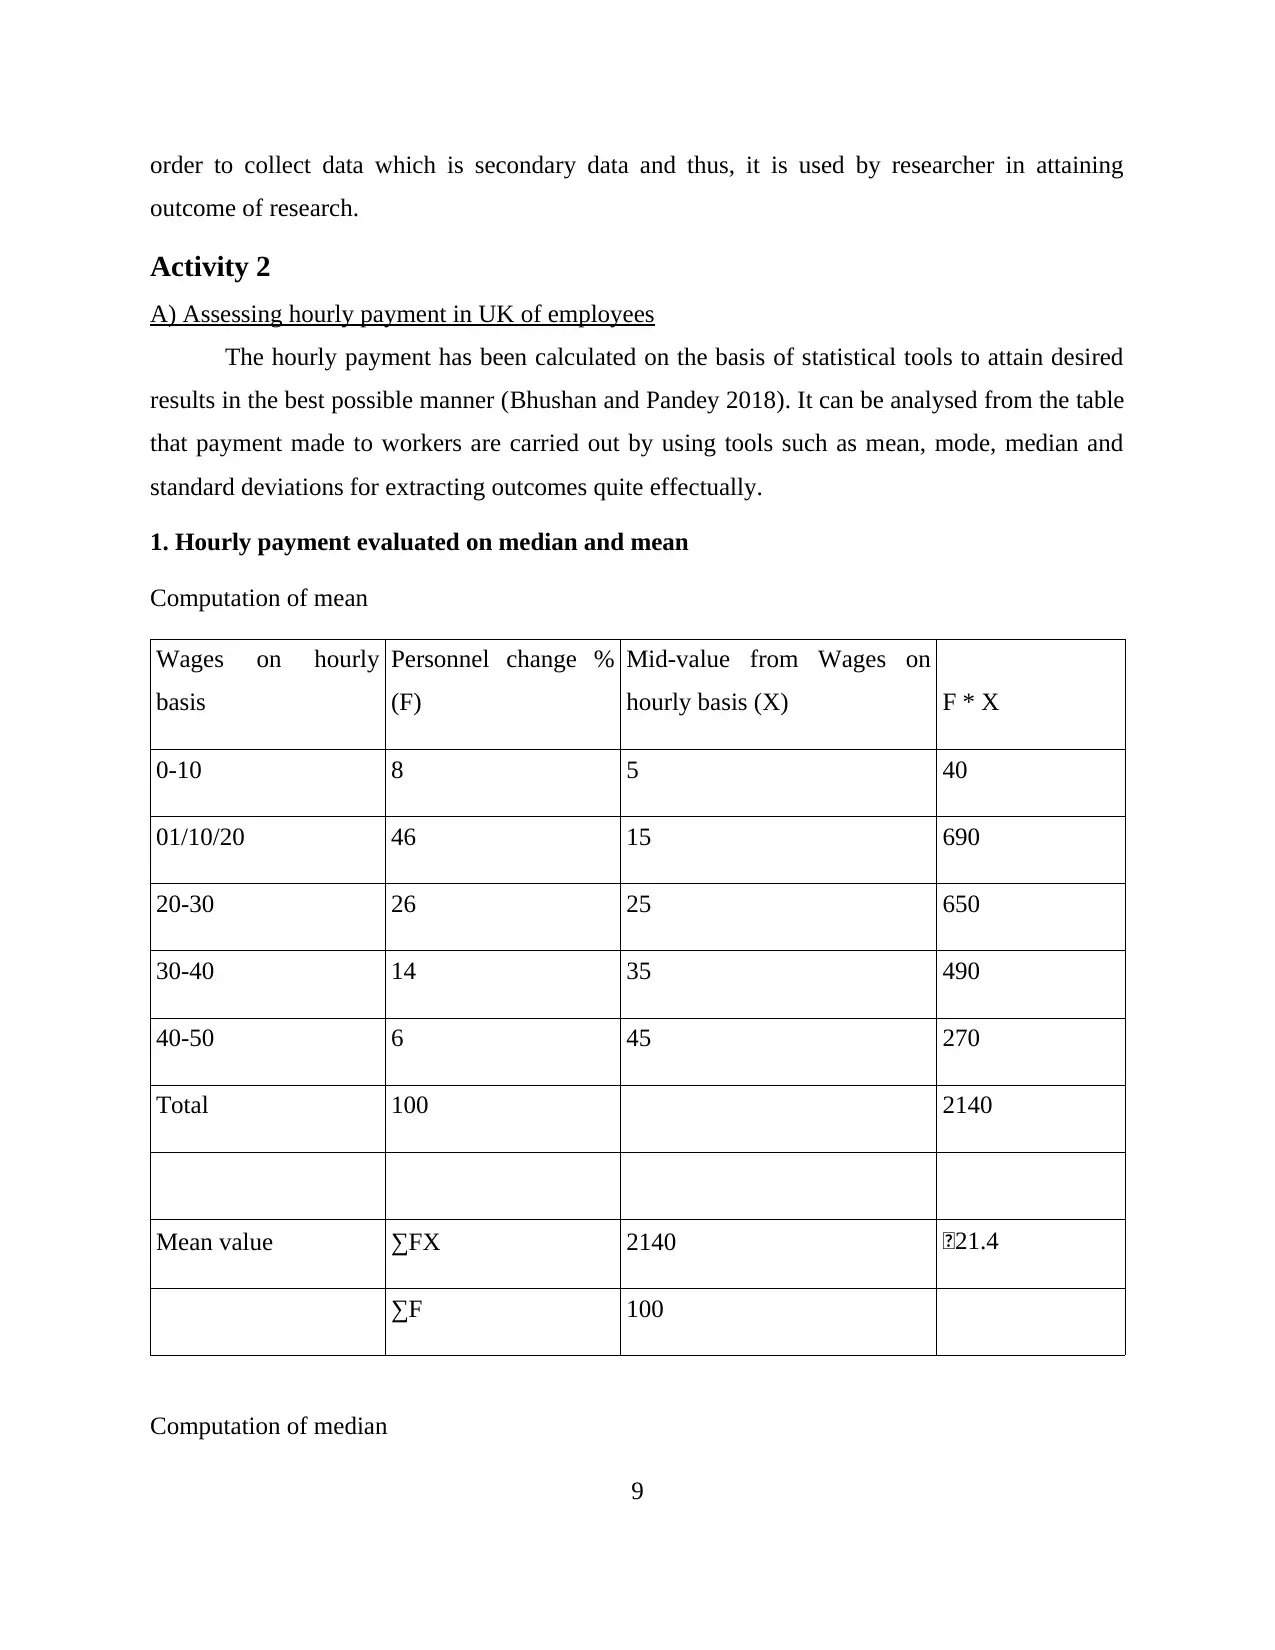
A) Assessing hourly payment in UK of employees
The hourly payment has been calculated on the basis of statistical tools to attain desired
results in the best possible manner (Bhushan and Pandey 2018). It can be analysed from the table
that payment made to workers are carried out by using tools such as mean, mode, median and
standard deviations for extracting outcomes quite effectually.
1. Hourly payment evaluated on median and mean
Computation of mean
Wages on hourly
basis
Personnel change %
(F)
Mid-value from Wages on
hourly basis (X) F * X
0-10 8 5 40
01/10/20 46 15 690
20-30 26 25 650
30-40 14 35 490
40-50 6 45 270
Total 100 2140
Mean value ∑FX 2140 £21.4
∑F 100
Computation of median
9
outcome of research.
Activity 2
A) Assessing hourly payment in UK of employees
The hourly payment has been calculated on the basis of statistical tools to attain desired
results in the best possible manner (Bhushan and Pandey 2018). It can be analysed from the table
that payment made to workers are carried out by using tools such as mean, mode, median and
standard deviations for extracting outcomes quite effectually.
1. Hourly payment evaluated on median and mean
Computation of mean
Wages on hourly
basis
Personnel change %
(F)
Mid-value from Wages on
hourly basis (X) F * X
0-10 8 5 40
01/10/20 46 15 690
20-30 26 25 650
30-40 14 35 490
40-50 6 45 270
Total 100 2140
Mean value ∑FX 2140 £21.4
∑F 100
Computation of median
9
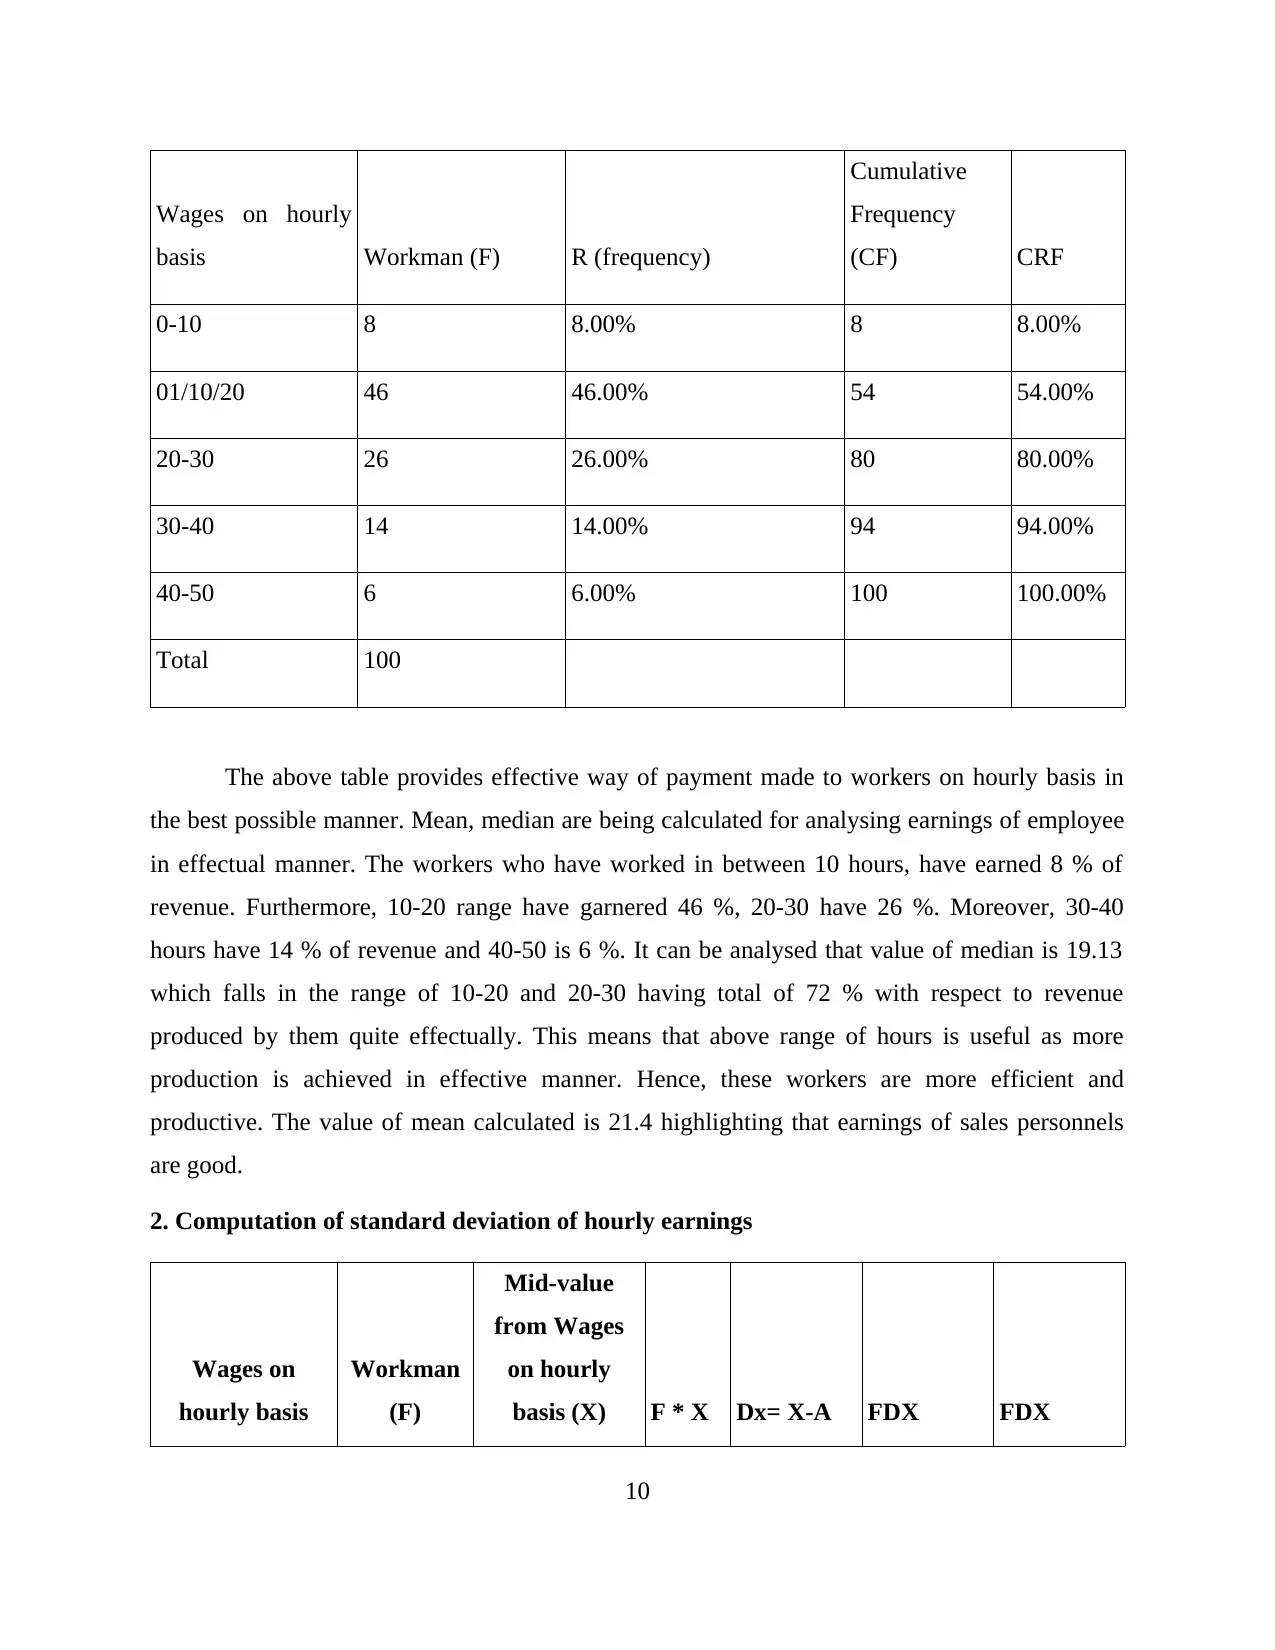
Wages on hourly
basis Workman (F) R (frequency)
Cumulative
Frequency
(CF) CRF
0-10 8 8.00% 8 8.00%
01/10/20 46 46.00% 54 54.00%
20-30 26 26.00% 80 80.00%
30-40 14 14.00% 94 94.00%
40-50 6 6.00% 100 100.00%
Total 100
The above table provides effective way of payment made to workers on hourly basis in
the best possible manner. Mean, median are being calculated for analysing earnings of employee
in effectual manner. The workers who have worked in between 10 hours, have earned 8 % of
revenue. Furthermore, 10-20 range have garnered 46 %, 20-30 have 26 %. Moreover, 30-40
hours have 14 % of revenue and 40-50 is 6 %. It can be analysed that value of median is 19.13
which falls in the range of 10-20 and 20-30 having total of 72 % with respect to revenue
produced by them quite effectually. This means that above range of hours is useful as more
production is achieved in effective manner. Hence, these workers are more efficient and
productive. The value of mean calculated is 21.4 highlighting that earnings of sales personnels
are good.
2. Computation of standard deviation of hourly earnings
Wages on
hourly basis
Workman
(F)
Mid-value
from Wages
on hourly
basis (X) F * X Dx= X-A FDX FDX
10
⊘ This is a preview!⊘
Do you want full access?
Subscribe today to unlock all pages.
Trusted by 1+ million students worldwide
1 out of 21
Related Documents


Your All-in-One AI-Powered Toolkit for Academic Success.
+13062052269
info@desklib.com
Available 24*7 on WhatsApp / Email
![[object Object]](/_next/static/media/star-bottom.7253800d.svg)
Unlock your academic potential
Copyright © 2020–2026 A2Z Services. All Rights Reserved. Developed and managed by ZUCOL.