Statistics for Management Decision Assignment - II: Analysis Report

Verified

Added on  2020/04/01

|14
|886
|39
Homework Assignment
AI Summary
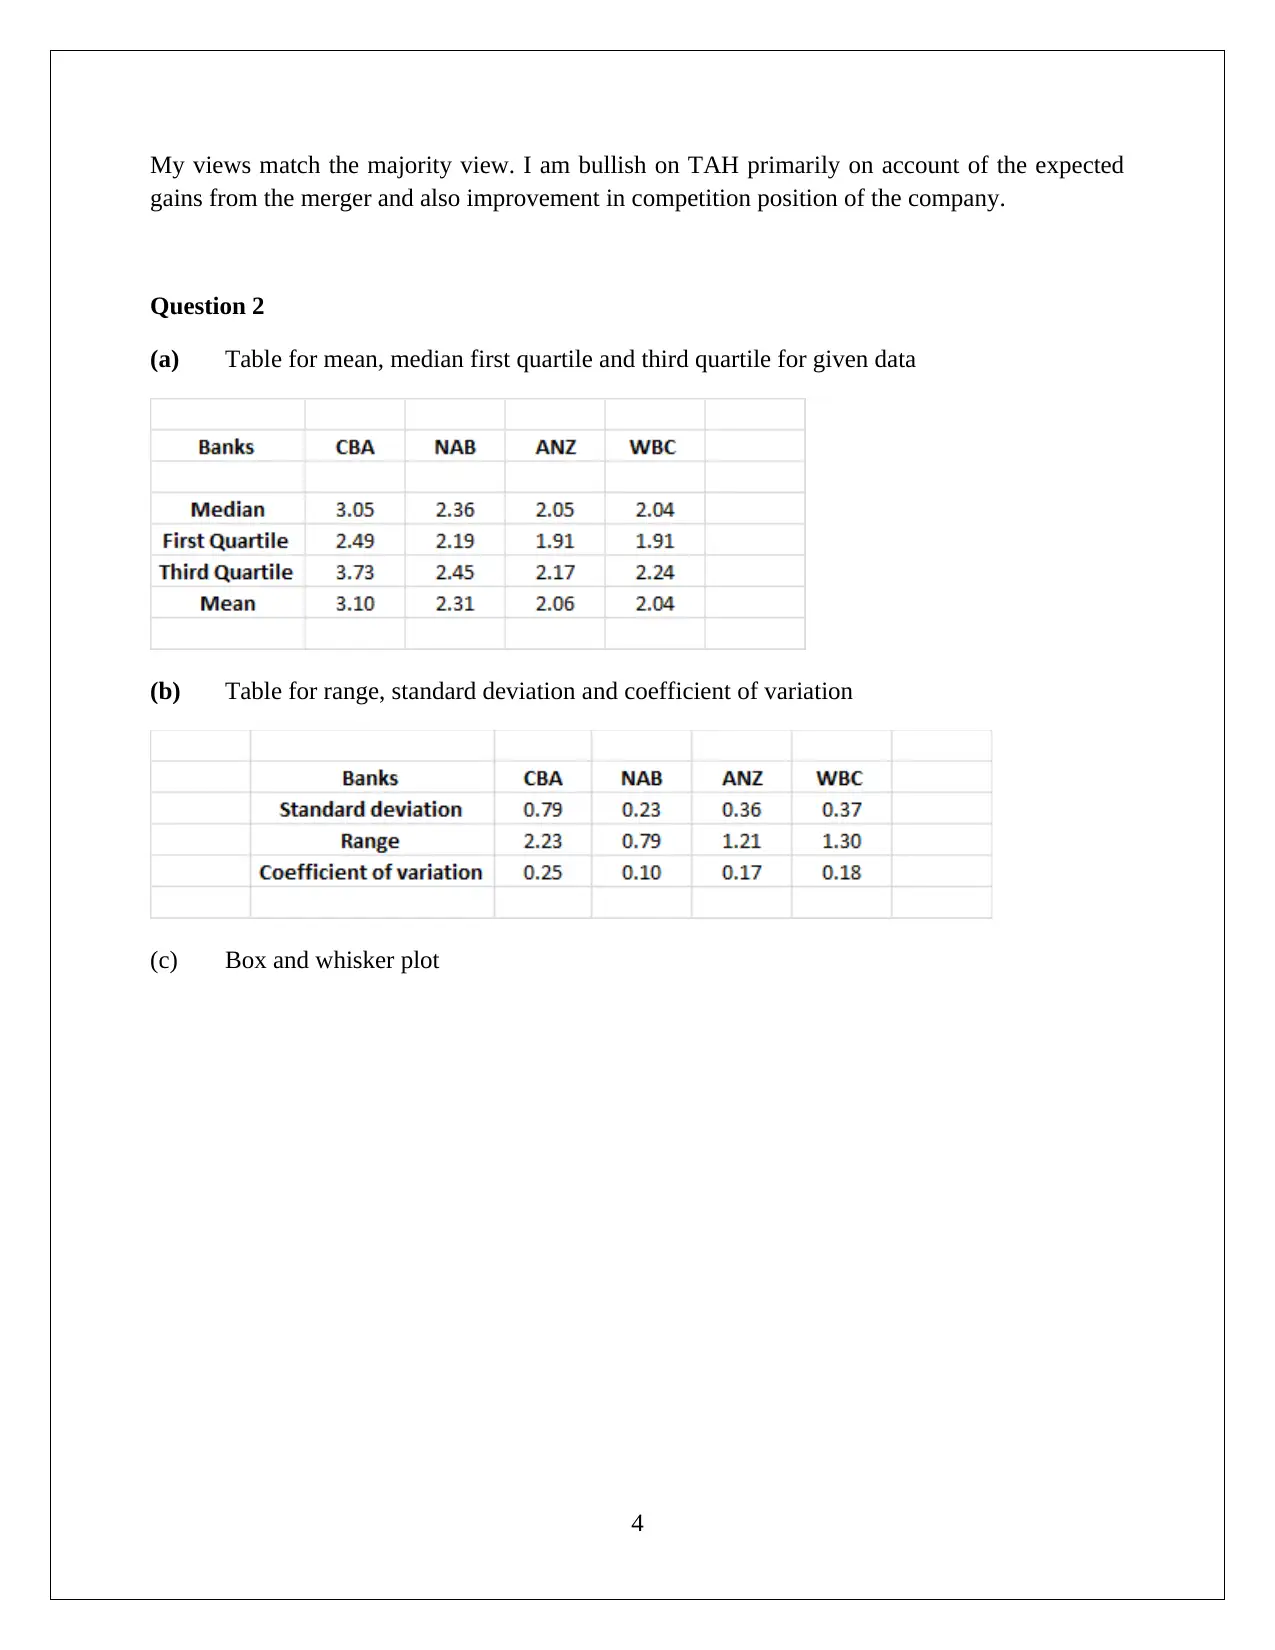
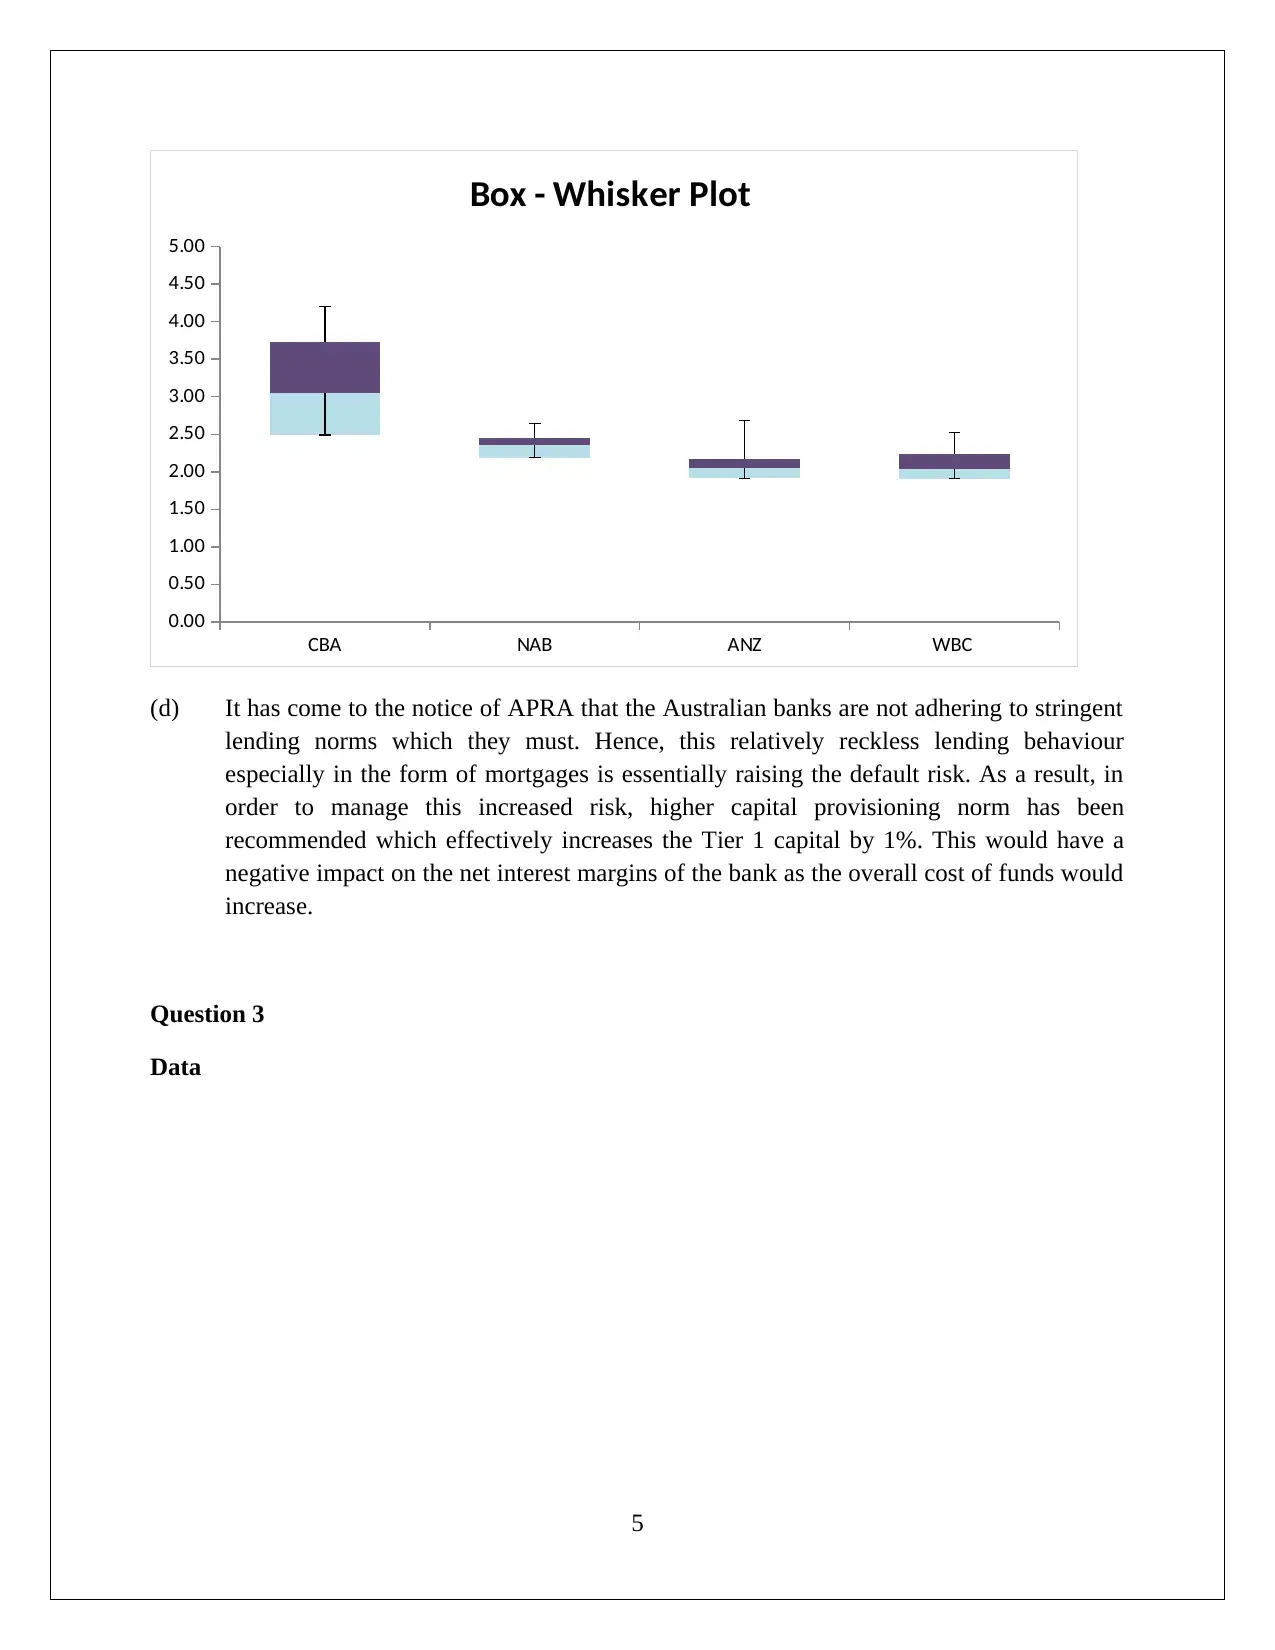
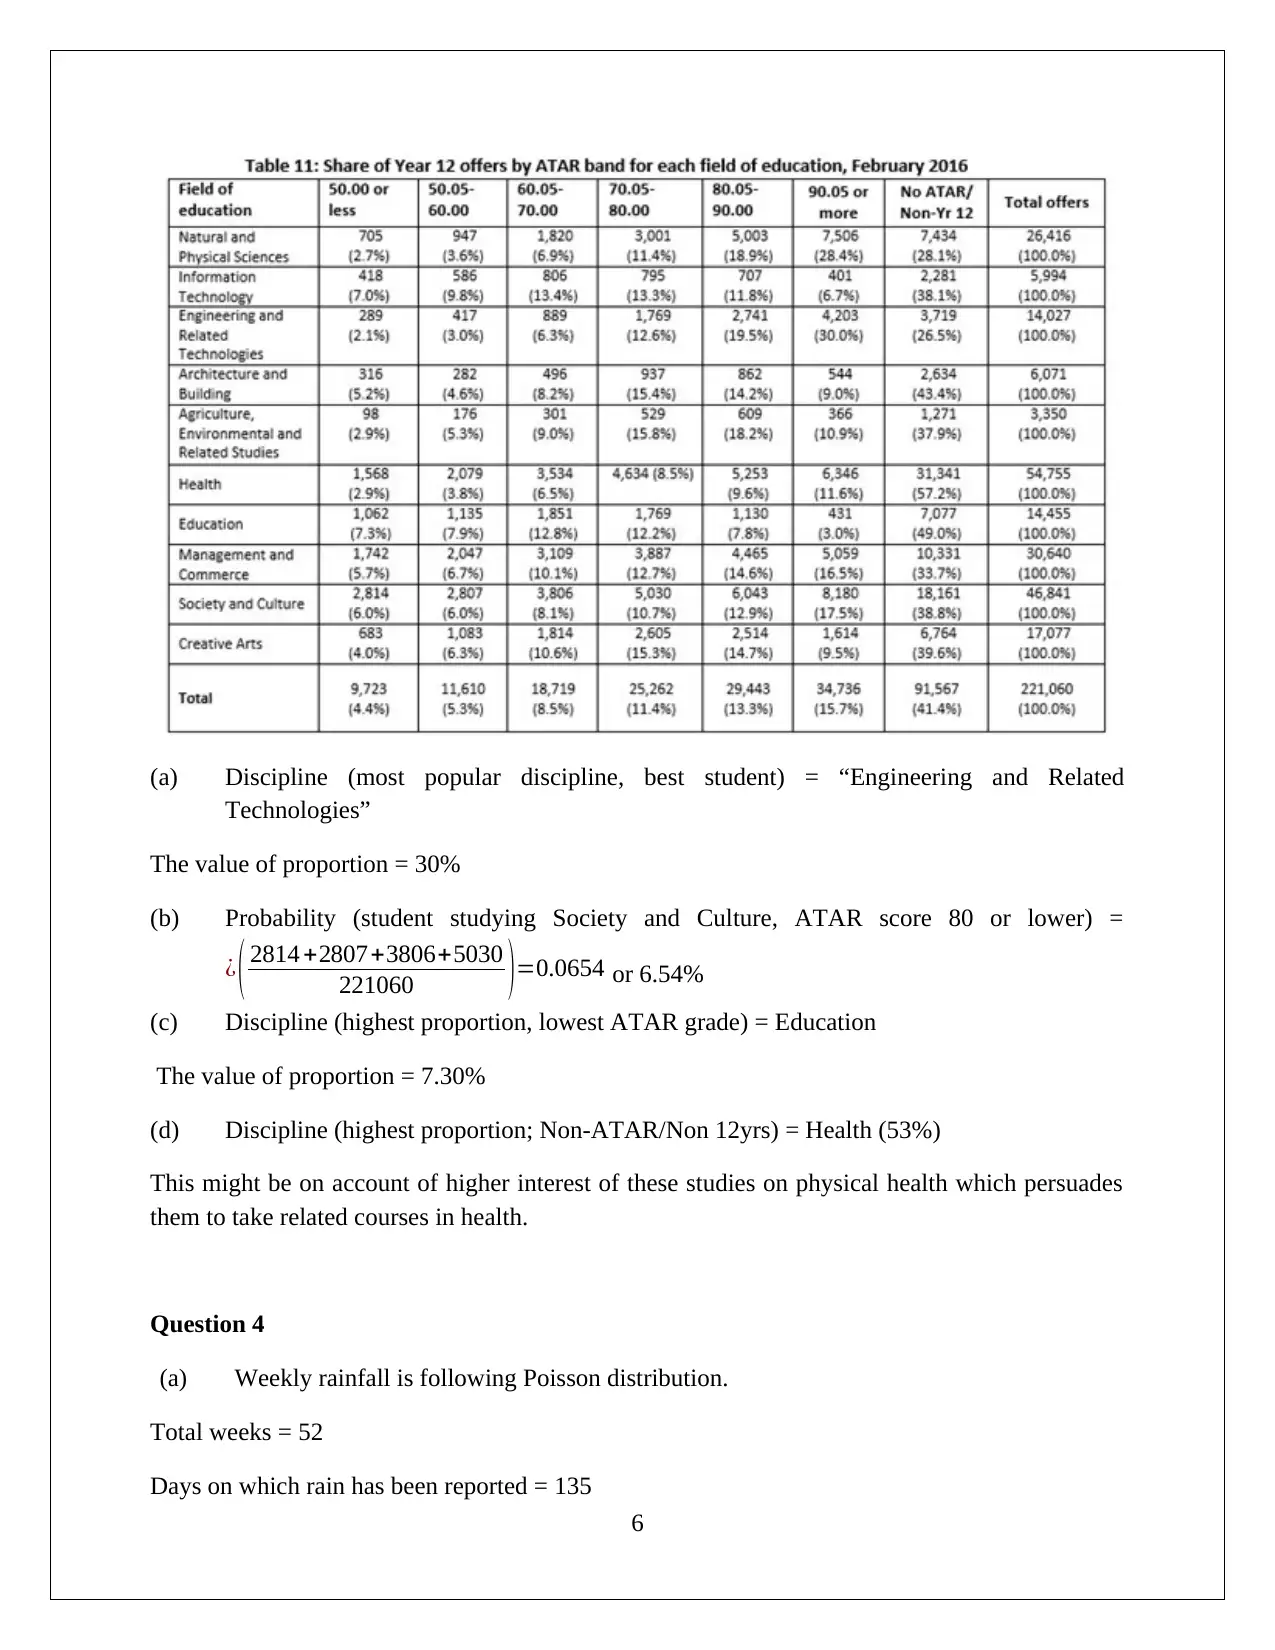
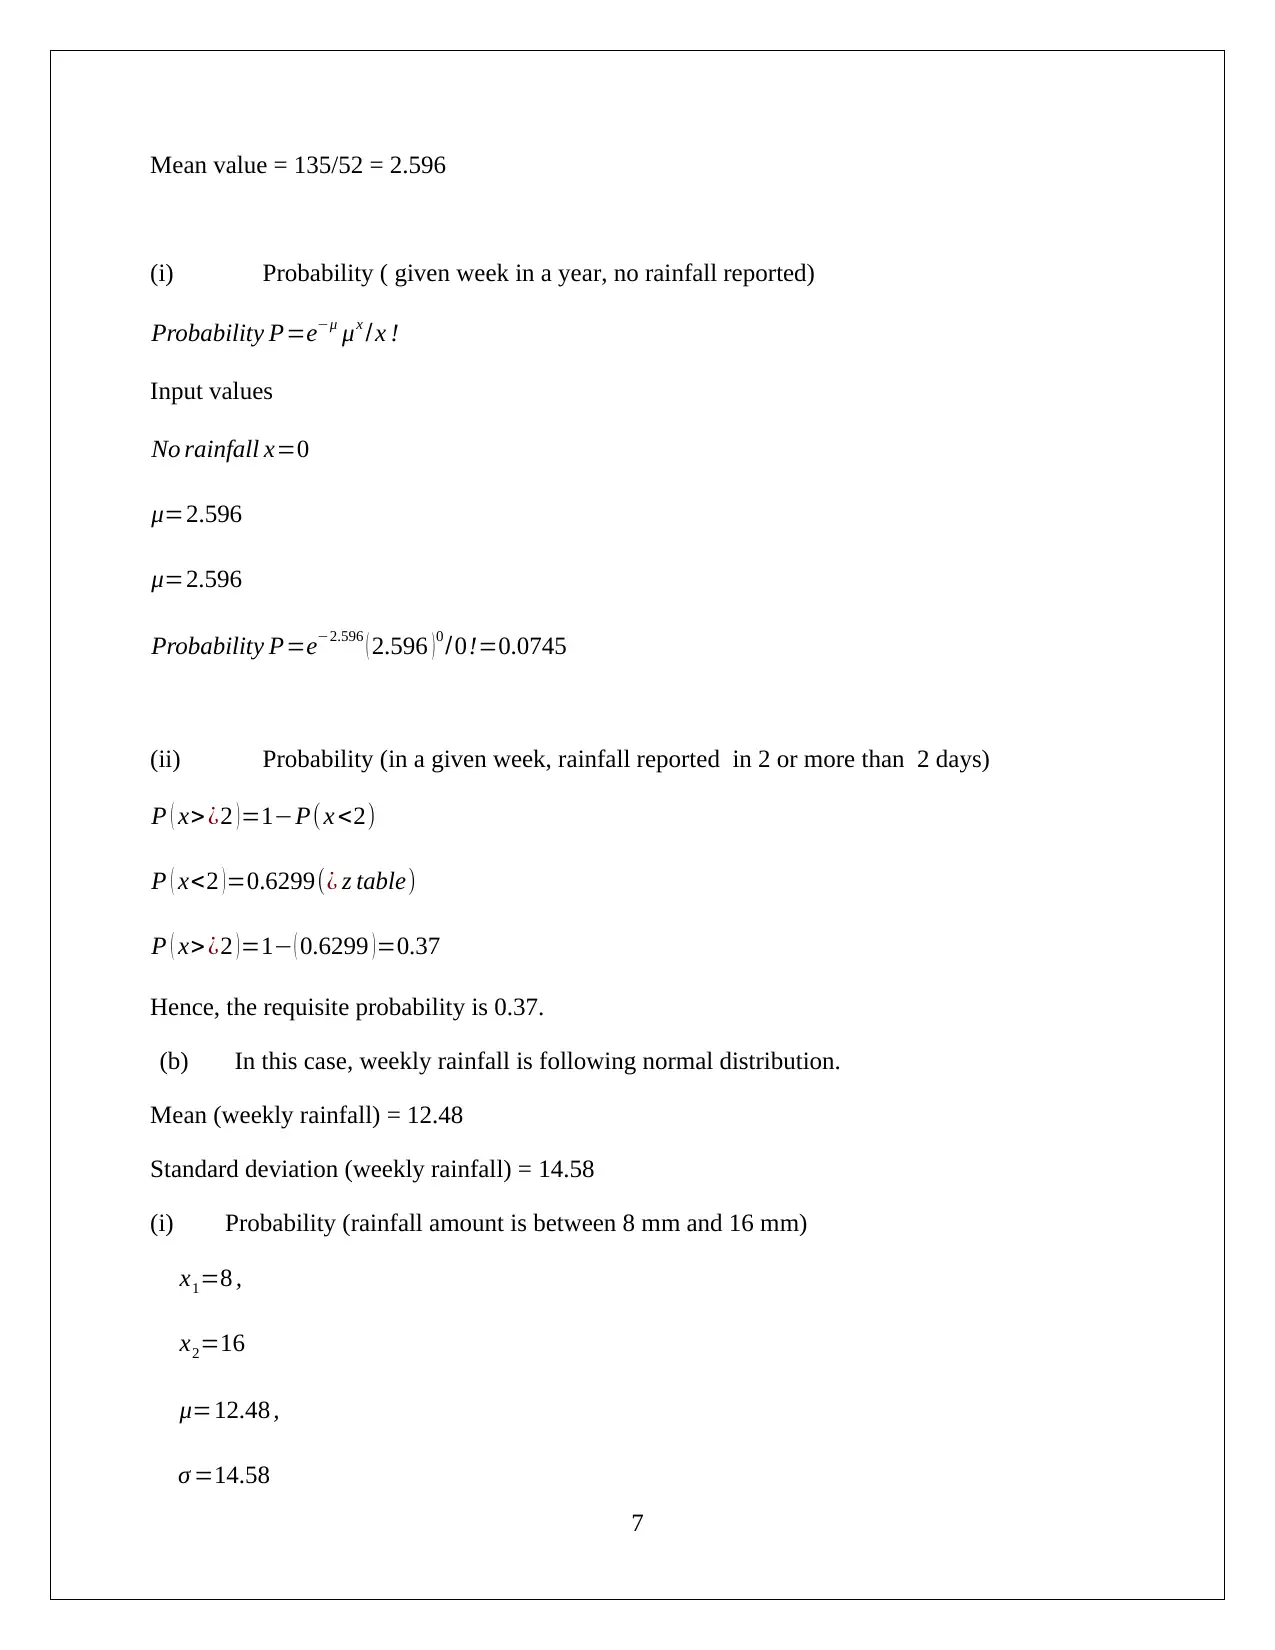
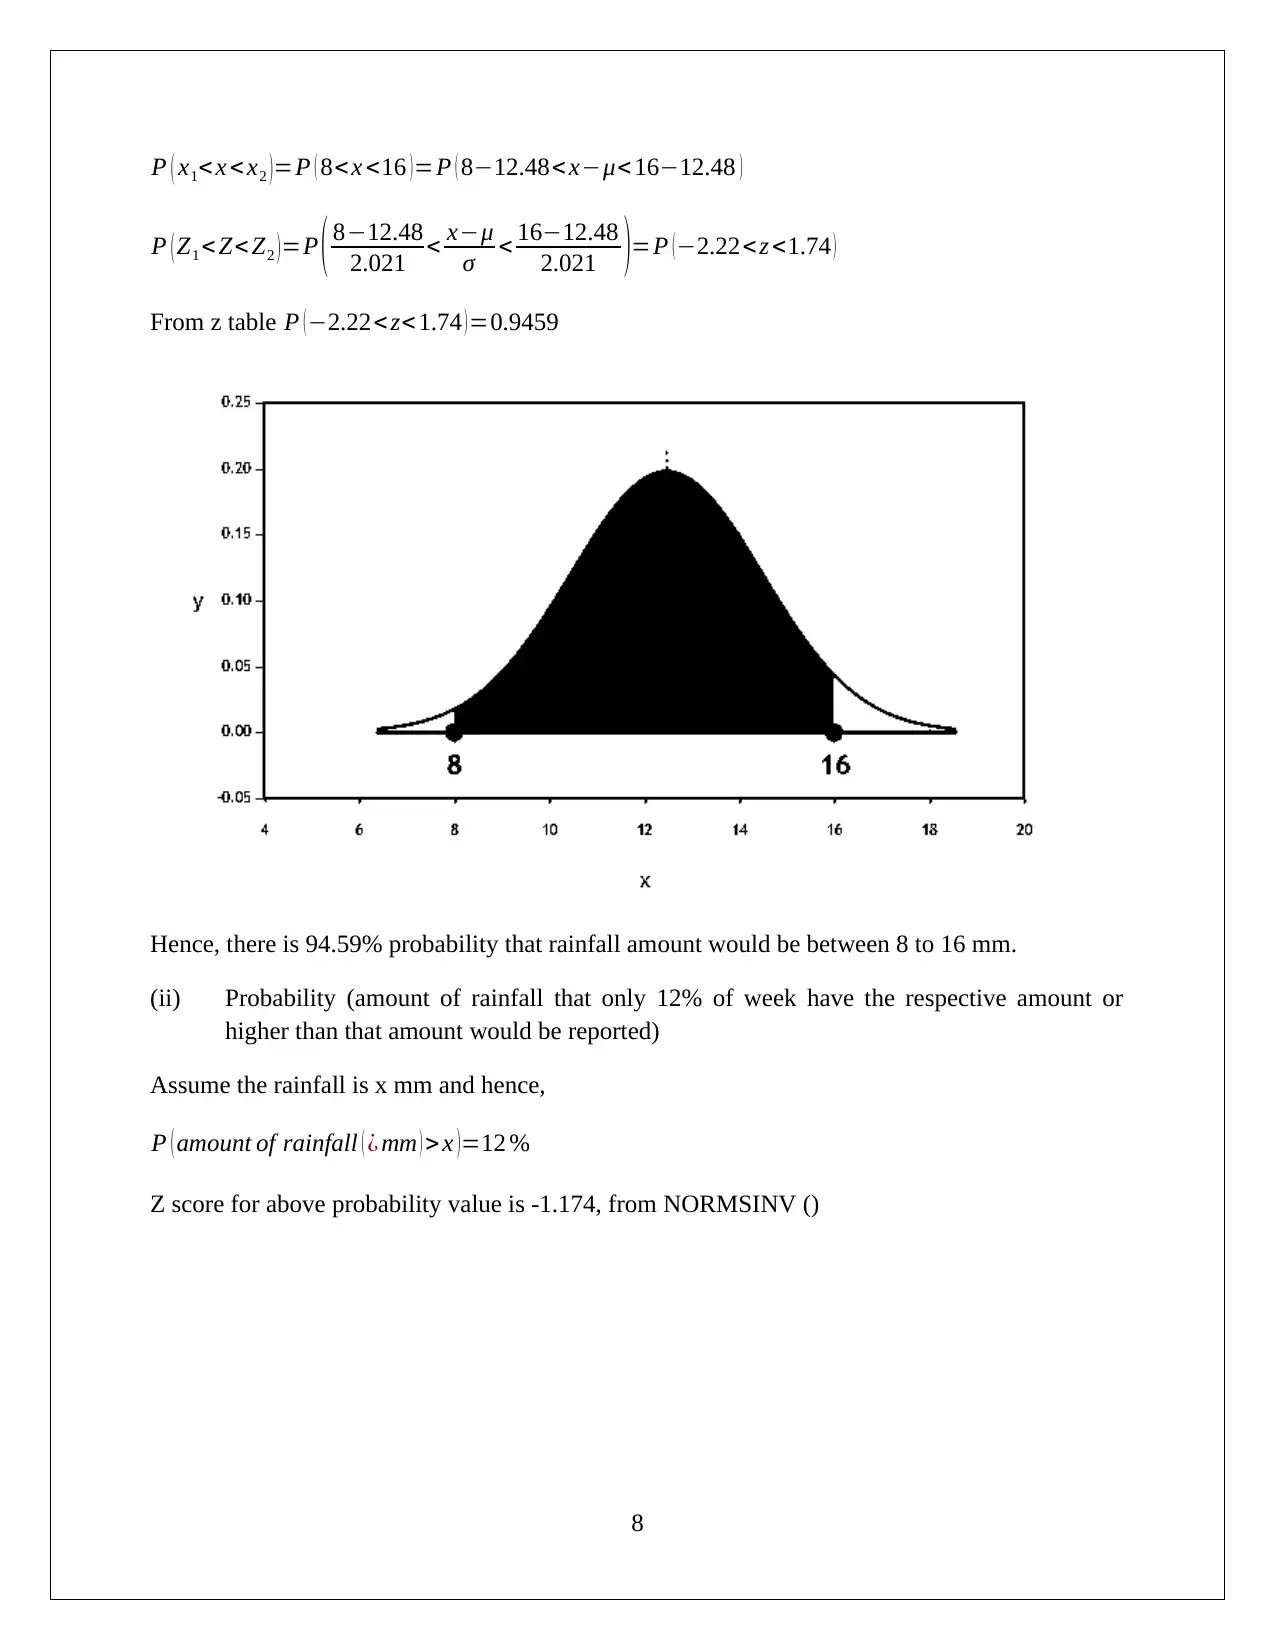
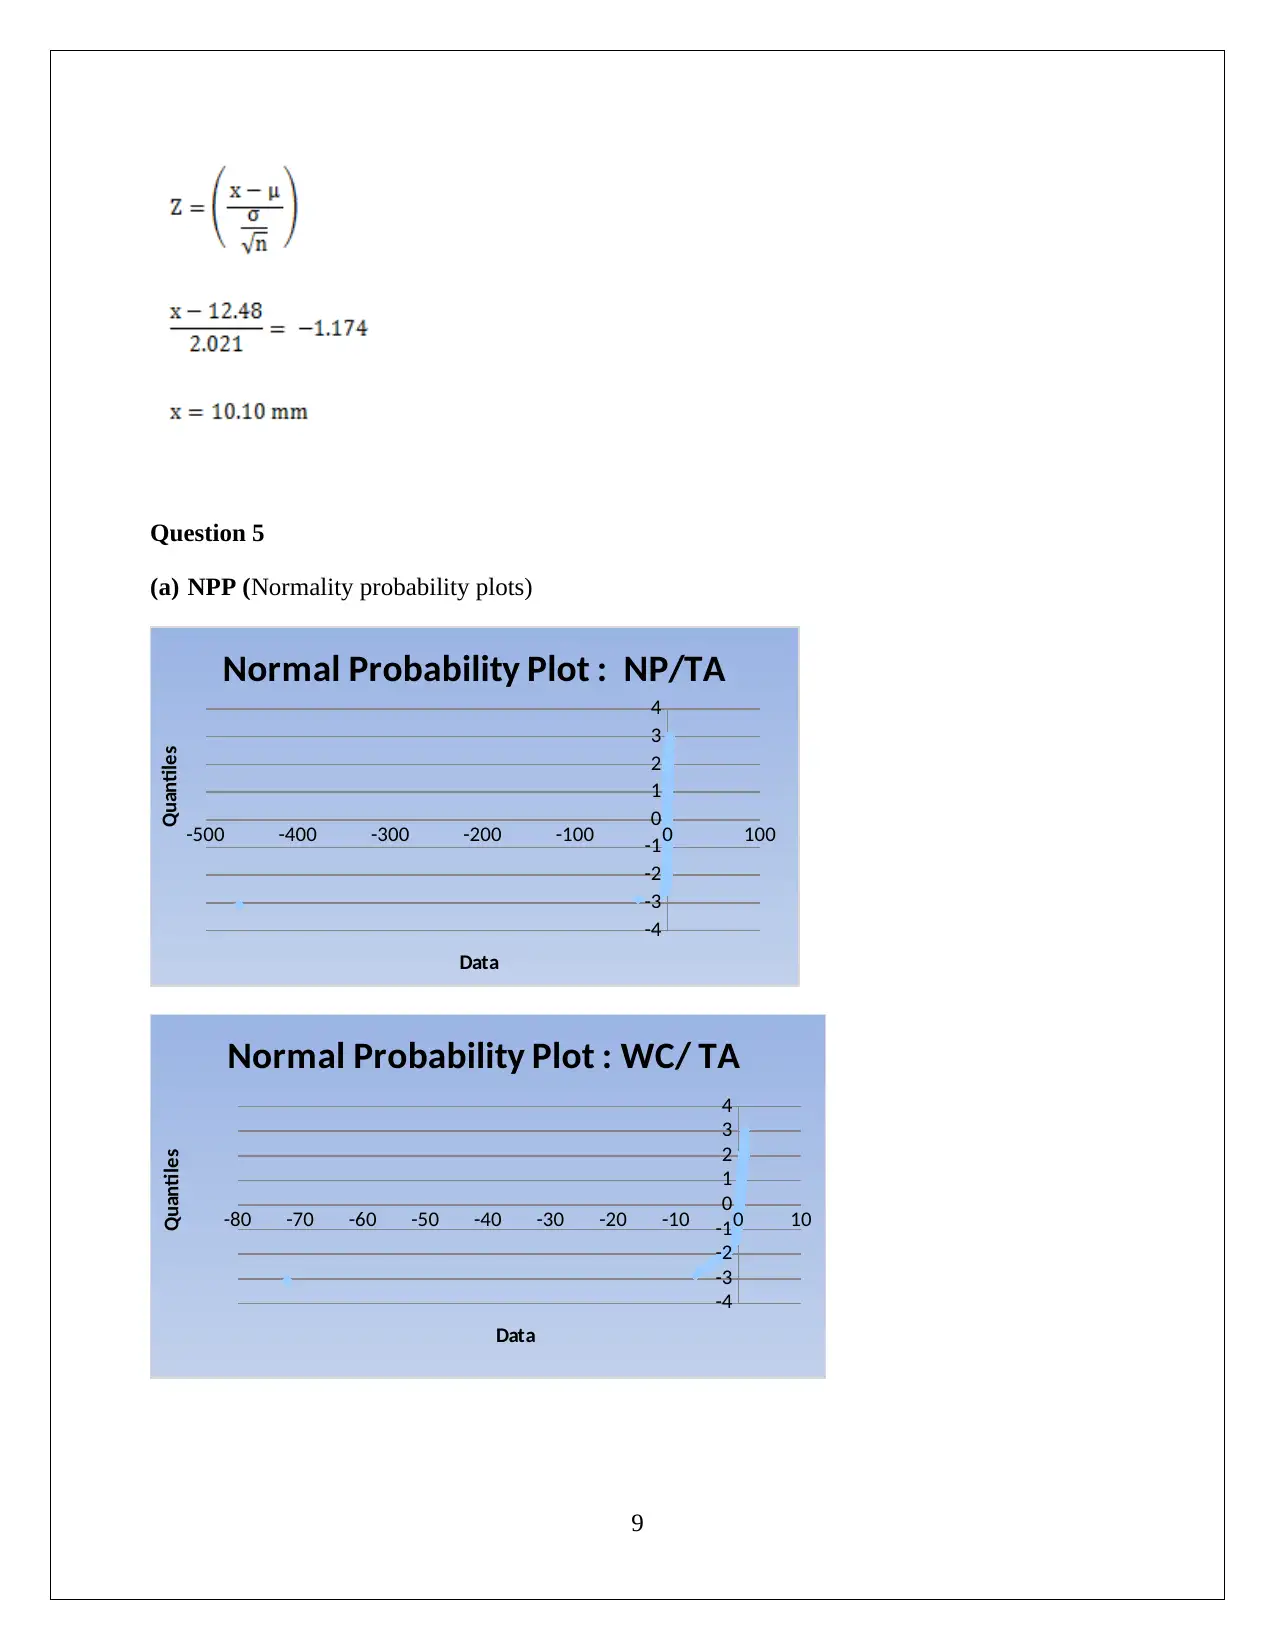
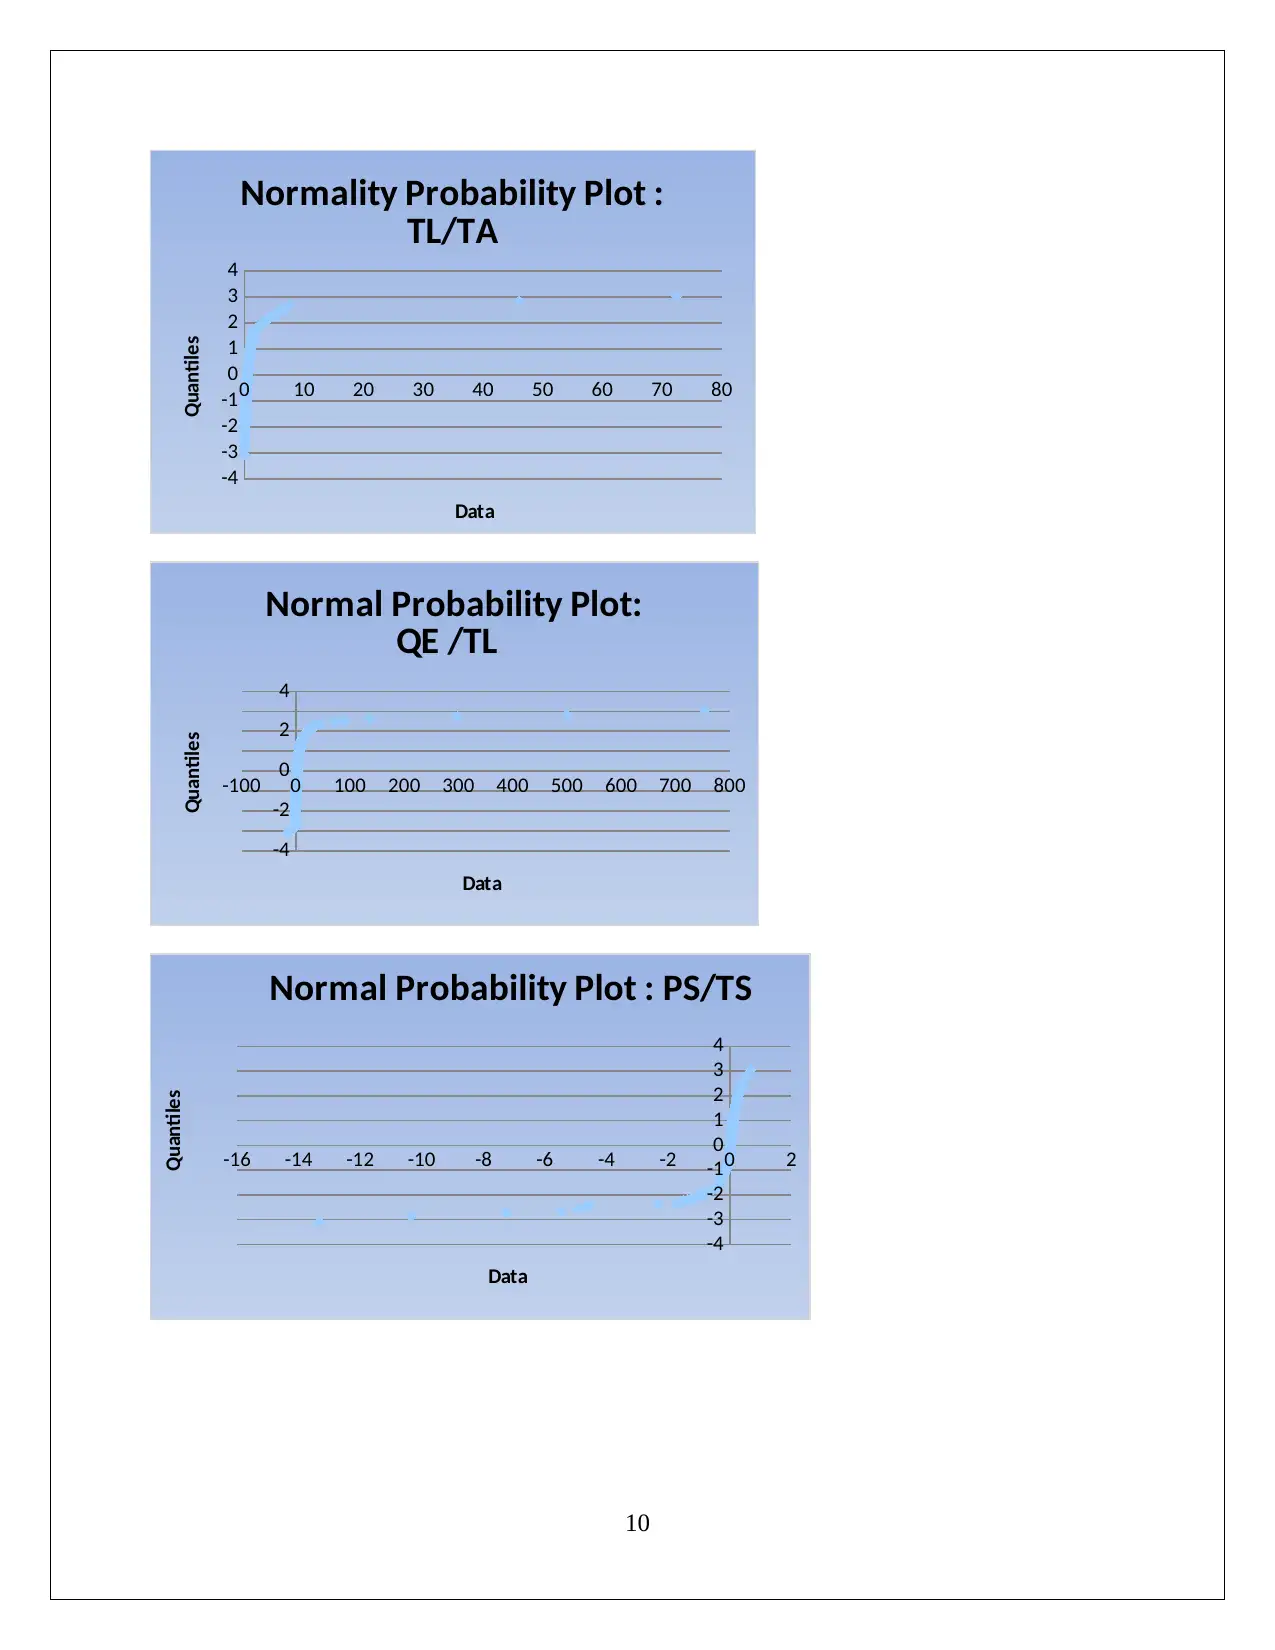
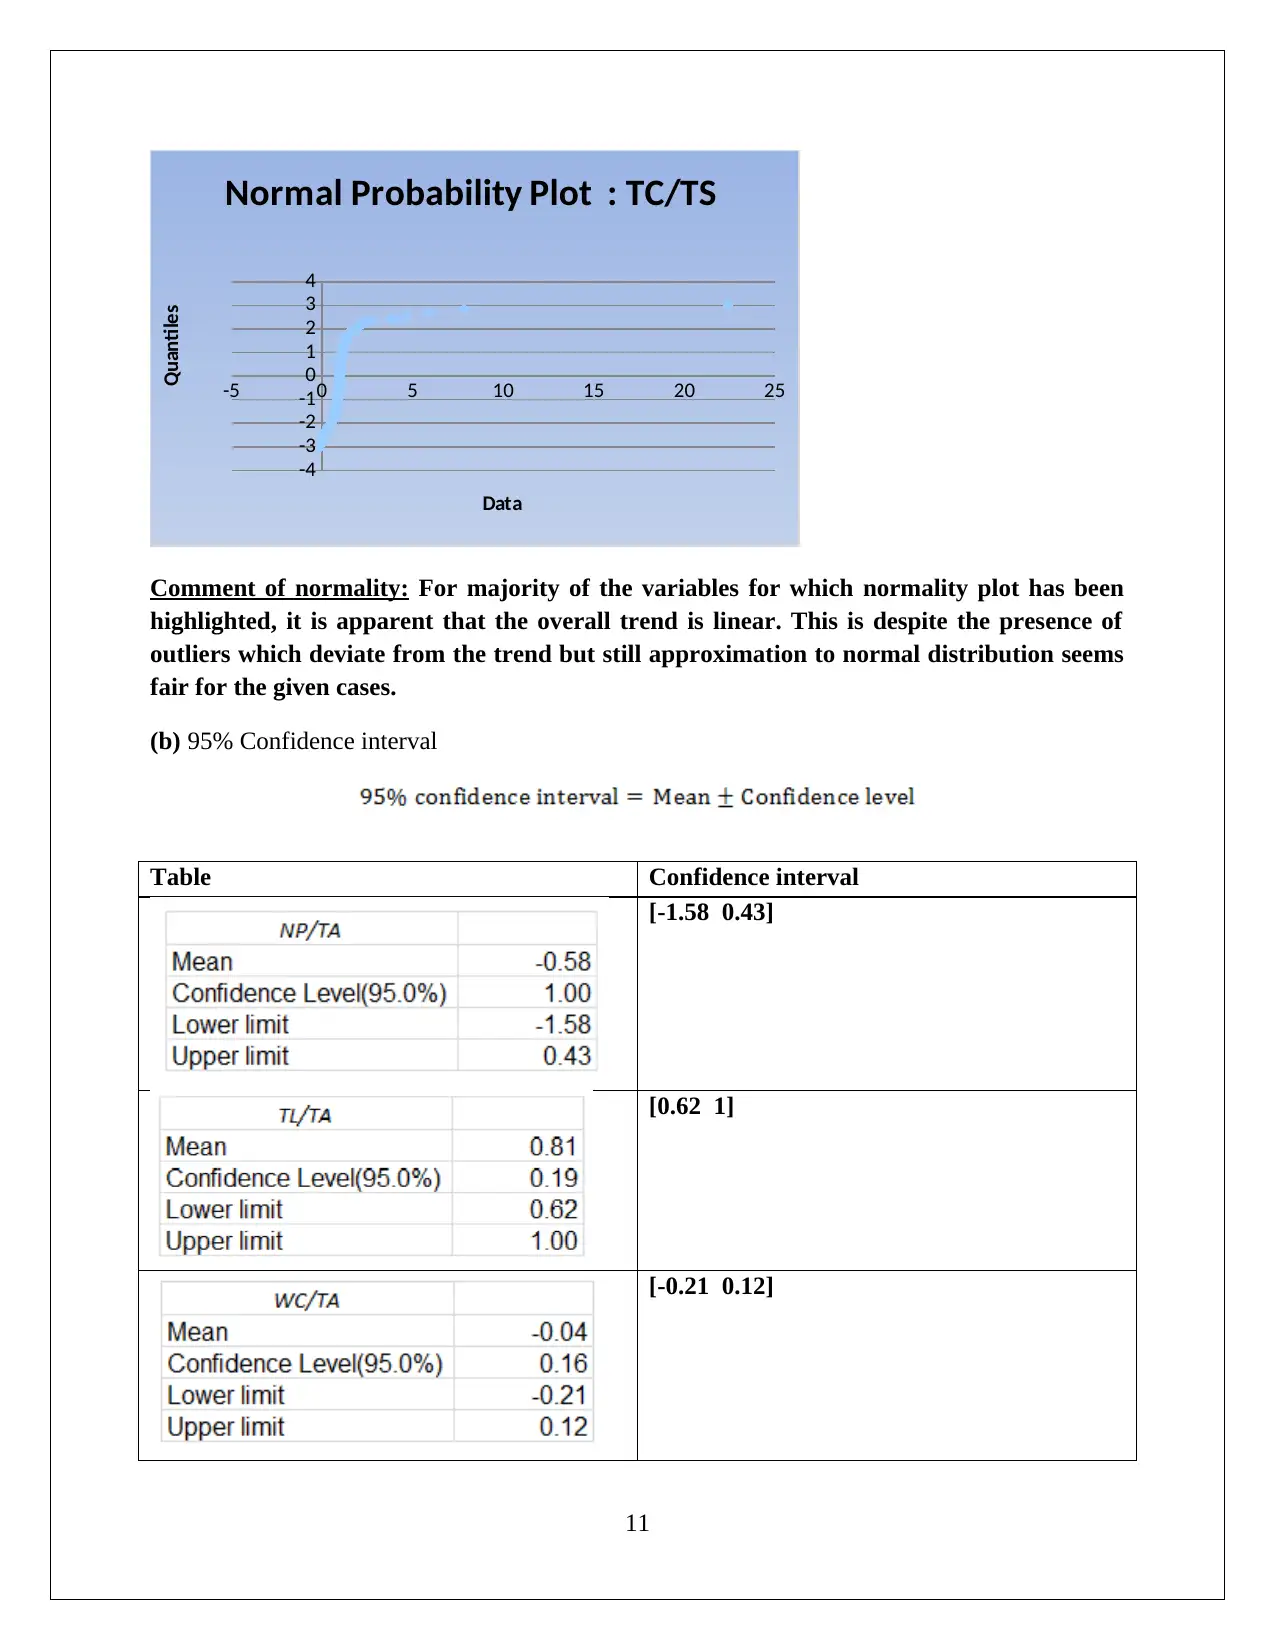
This statistics assignment delves into various statistical techniques essential for management decision-making. The assignment begins with an analysis of stock market data, including stem and leaf plots, graphs, and market capitalization comparisons for ASX-listed companies, along with analyst recommendations. It then proceeds to descriptive statistics, calculating measures like mean, median, quartiles, range, standard deviation, and box and whisker plots. The assignment also explores the impact of regulatory changes on bank capital provisioning. Further, it analyzes student data across different disciplines, calculating proportions and probabilities related to ATAR scores and non-ATAR qualifications. The assignment then applies Poisson and normal distributions to analyze weekly rainfall data, calculating probabilities for different scenarios. Finally, it includes normality probability plots, confidence intervals, and hypothesis testing, evaluating the statistical significance of various factors related to bankruptcy. The analysis uses data from various sources and employs statistical tools to draw conclusions and support decision-making processes.
tabler-icon-diamond-filled.svg

Contribute Materials

Your contribution can guide someone’s learning journey. Share your documents today.
Document Page
Statistics For Management Decision
Assignment - II
Student id
[Pick the date]
tabler-icon-diamond-filled.svg

Secure Best Marks with AI Grader

Need help grading? Try our AI Grader for instant feedback on your assignments.
Document Page
Question 1
(a) Table to represent quarterly opening prices for both the companies is shown below:
The respective stem and leaf pot is illustrated below:
(b) The respective graph is shown below:
1
Document Page
0 to less
than 2 2 < 4 4 < 6 6 < 8 8 < 10 10 < 12 12 < 14 14 < 16 16 < 18
0
5
10
15
20
25
30
35
Relative frequency histogram and Frequency
Polygon
Opening Quarterly Price
Relative frequency
(c) Market capitalisation (2016) for the five companies listed in ASX is furnished below:
2
Document Page
Village Roadshow
Tatts Group
Star Entertainment Group
Aristocrat Leisure
Tasracing
0 1 2 3 4 5 6
Bar Chart
Market Capitalization (Billion Australian Dollars)
Company NAME
(d) For Crown Resorts the majority recommendation seems to be holding the stock along
with a positive bias. This is reflected in the screenshot below.
Source: https://markets.ft.com/data/equities/tearsheet/forecasts?s=CWN:ASX
For the TAH stock, the majority recommendation seems to be to buy the stock as majority of the
analysts believe that it is going to be an outperformer.
Source: https://markets.ft.com/data/equities/tearsheet/forecasts?s=TAH:ASX
3
tabler-icon-diamond-filled.svg

Secure Best Marks with AI Grader

Need help grading? Try our AI Grader for instant feedback on your assignments.
Document Page
My views match the majority view. I am bullish on TAH primarily on account of the expected
gains from the merger and also improvement in competition position of the company.
Question 2
(a) Table for mean, median first quartile and third quartile for given data
(b) Table for range, standard deviation and coefficient of variation
(c) Box and whisker plot
4
Document Page
CBA NAB ANZ WBC
0.00
0.50
1.00
1.50
2.00
2.50
3.00
3.50
4.00
4.50
5.00
Box - Whisker Plot
(d) It has come to the notice of APRA that the Australian banks are not adhering to stringent
lending norms which they must. Hence, this relatively reckless lending behaviour
especially in the form of mortgages is essentially raising the default risk. As a result, in
order to manage this increased risk, higher capital provisioning norm has been
recommended which effectively increases the Tier 1 capital by 1%. This would have a
negative impact on the net interest margins of the bank as the overall cost of funds would
increase.
Question 3
Data
5
Document Page
(a) Discipline (most popular discipline, best student) = “Engineering and Related
Technologies”
The value of proportion = 30%
(b) Probability (student studying Society and Culture, ATAR score 80 or lower) =
¿ ( 2814 +2807+3806+5030
221060 )=0.0654 or 6.54%
(c) Discipline (highest proportion, lowest ATAR grade) = Education
The value of proportion = 7.30%
(d) Discipline (highest proportion; Non-ATAR/Non 12yrs) = Health (53%)
This might be on account of higher interest of these studies on physical health which persuades
them to take related courses in health.
Question 4
(a) Weekly rainfall is following Poisson distribution.
Total weeks = 52
Days on which rain has been reported = 135
6
tabler-icon-diamond-filled.svg

Paraphrase This Document

Need a fresh take? Get an instant paraphrase of this document with our AI Paraphraser
Document Page
Mean value = 135/52 = 2.596
(i) Probability ( given week in a year, no rainfall reported)
Probability P=eμ μx /x !
Input values
No rainfall x=0
μ=2.596
μ=2.596
Probability P=e2.596 ( 2.596 )0 /0!=0.0745
(ii) Probability (in a given week, rainfall reported in 2 or more than 2 days)
P ( x> ¿2 ) =1P(x <2)
P ( x<2 ) =0.6299(¿ z table)
P ( x> ¿2 )=1 ( 0.6299 )=0.37
Hence, the requisite probability is 0.37.
(b) In this case, weekly rainfall is following normal distribution.
Mean (weekly rainfall) = 12.48
Standard deviation (weekly rainfall) = 14.58
(i) Probability (rainfall amount is between 8 mm and 16 mm)
x1=8 ,
x2=16
μ=12.48 ,
σ =14.58
7
Document Page
P ( x1< x < x2 )=P ( 8<x <16 )=P ( 812.48<xμ< 1612.48 )
P ( Z1 < Z< Z2 )=P ( 812.48
2.021 < xμ
σ < 1612.48
2.021 )=P (2.22< z <1.74 )
From z table P (2.22< z<1.74 )=0.9459
Hence, there is 94.59% probability that rainfall amount would be between 8 to 16 mm.
(ii) Probability (amount of rainfall that only 12% of week have the respective amount or
higher than that amount would be reported)
Assume the rainfall is x mm and hence,
P ( amount of rainfall ( ¿ mm ) > x )=12 %
Z score for above probability value is -1.174, from NORMSINV ()
8
Document Page
Question 5
(a) NPP (Normality probability plots)
-500 -400 -300 -200 -100 0 100
-4
-3
-2
-1
0
1
2
3
4
Normal Probability Plot : NP/TA
Data
Quantiles
-80 -70 -60 -50 -40 -30 -20 -10 0 10
-4
-3
-2
-1
0
1
2
3
4
Normal Probability Plot : WC/ TA
Data
Quantiles
9
tabler-icon-diamond-filled.svg

Secure Best Marks with AI Grader

Need help grading? Try our AI Grader for instant feedback on your assignments.
Document Page
0 10 20 30 40 50 60 70 80
-4
-3
-2
-1
0
1
2
3
4
Normality Probability Plot :
TL/TA
Data
Quantiles
-100 0 100 200 300 400 500 600 700 800
-4
-2
0
2
4
Normal Probability Plot:
QE /TL
Data
Quantiles
-16 -14 -12 -10 -8 -6 -4 -2 0 2
-4
-3
-2
-1
0
1
2
3
4
Normal Probability Plot : PS/TS
Data
Quantiles
10
Document Page
-5 0 5 10 15 20 25
-4
-3
-2
-1
0
1
2
3
4
Normal Probability Plot : TC/TS
Data
Quantiles
Comment of normality: For majority of the variables for which normality plot has been
highlighted, it is apparent that the overall trend is linear. This is despite the presence of
outliers which deviate from the trend but still approximation to normal distribution seems
fair for the given cases.
(b) 95% Confidence interval
Table Confidence interval
[-1.58 0.43]
[0.62 1]
[-0.21 0.12]
11
Document Page
[3.22 7.41]
[-0.13 -0.03]
[0.97 1.08]
(c)Hypothesis testing
Hypotheses
NP /TA P value (two tail) = 0.2065
Alpha = 5%
p value > alpha
Null hypothesis : Cannot
reject
Conclusion: There does
not exist a statistically
significant difference on
account of bankruptcy.
PS TS P value (two tail) = 00
12
tabler-icon-diamond-filled.svg

Paraphrase This Document

Need a fresh take? Get an instant paraphrase of this document with our AI Paraphraser
Document Page
Alpha = 5%
p value < alpha
Null hypothesis : reject
Conclusion: There does
exist a statistically
significant difference on
account of bankruptcy.
TC TS P value (two tail) = 00
Alpha = 5%
p value < alpha
Null hypothesis : reject
Conclusion: There does
exist a statistically
significant difference on
account of bankruptcy.
TL TA P value (two tail) = 0.0005
Alpha = 5%
p value < alpha
Null hypothesis : reject
Conclusion: There does
exist a statistically
significant difference on
account of bankruptcy.
WC TA P value (two tail) = 0.0007
Alpha = 5%
p value < alpha
Null hypothesis : reject
Conclusion: There does
13
chevron_up_icon
1 out of 14
circle_padding
hide_on_mobile
zoom_out_icon
logo.png

Your All-in-One AI-Powered Toolkit for Academic Success.

Available 24*7 on WhatsApp / Email

[object Object]