University Statistics Homework: ANOVA, Regression Analysis Solutions
VerifiedAdded on 2020/05/28
|9
|1256
|369
Homework Assignment
AI Summary
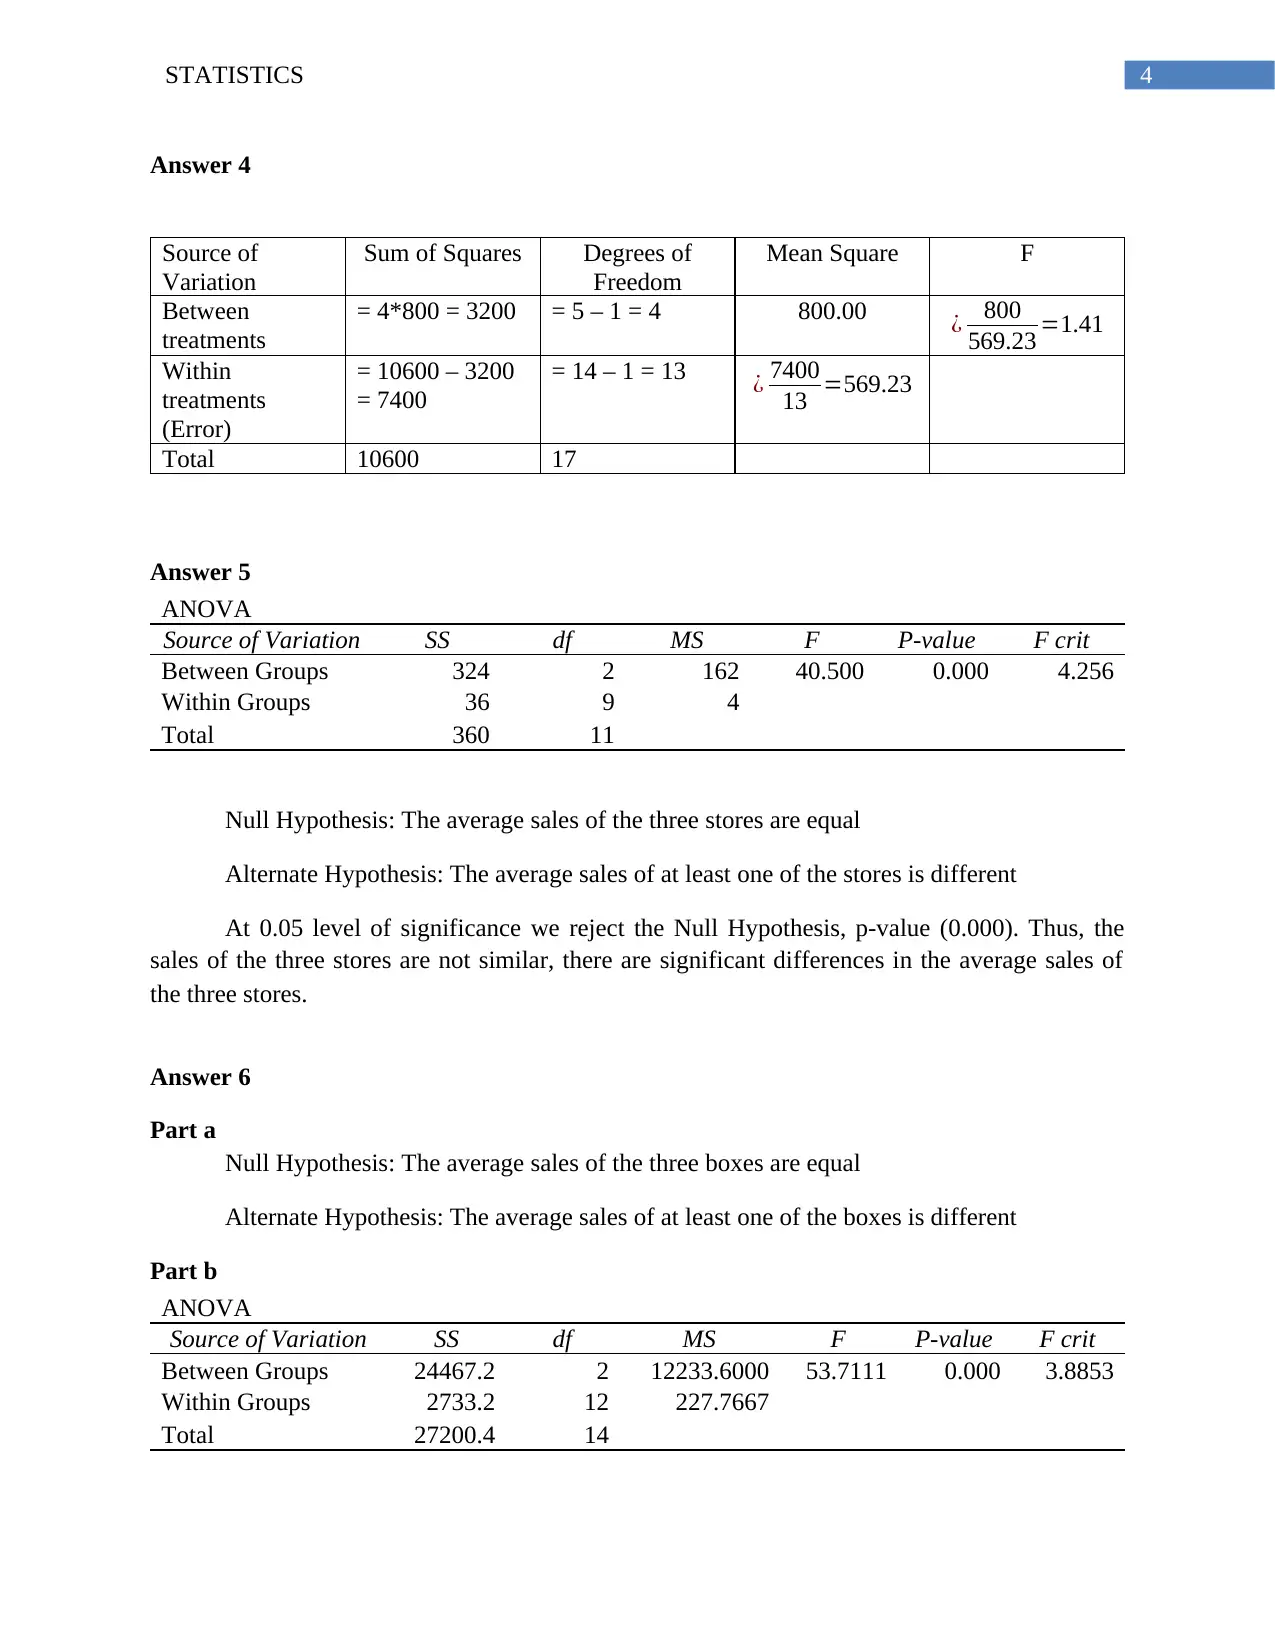
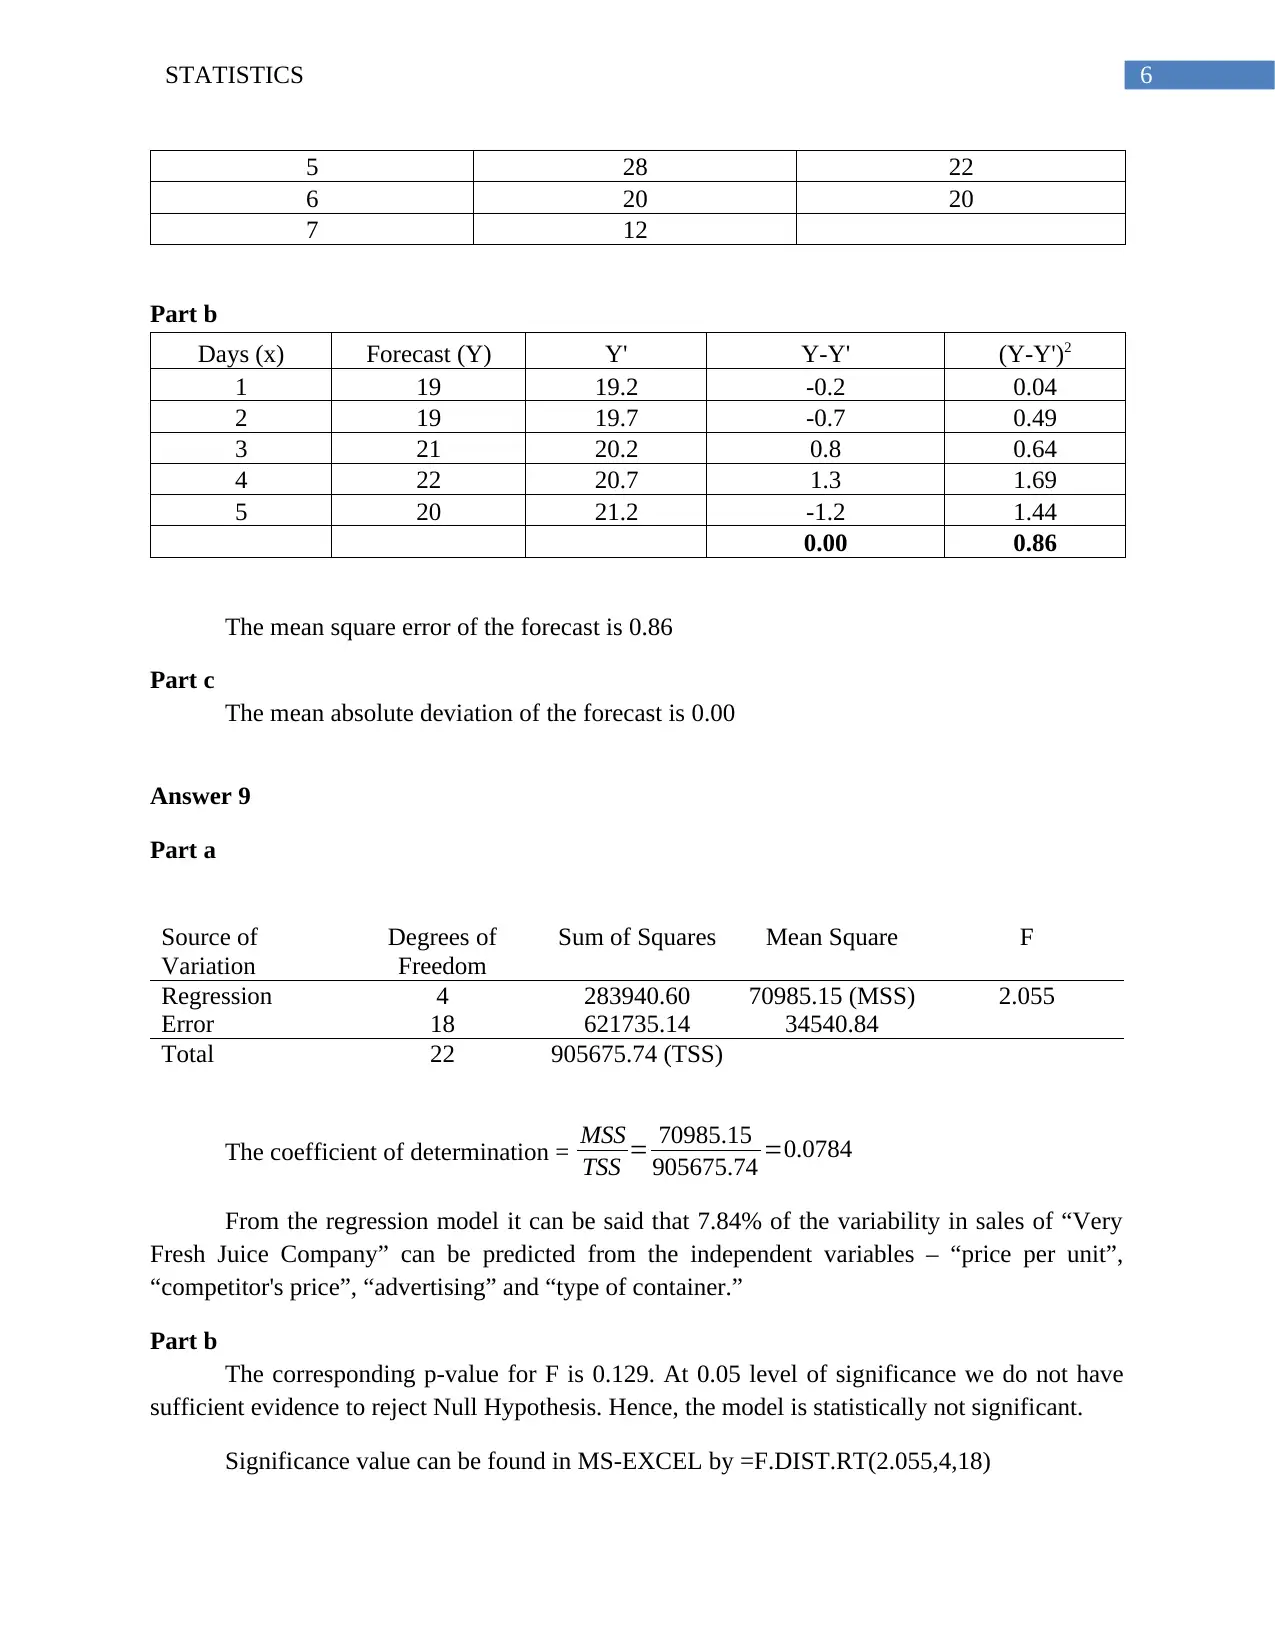
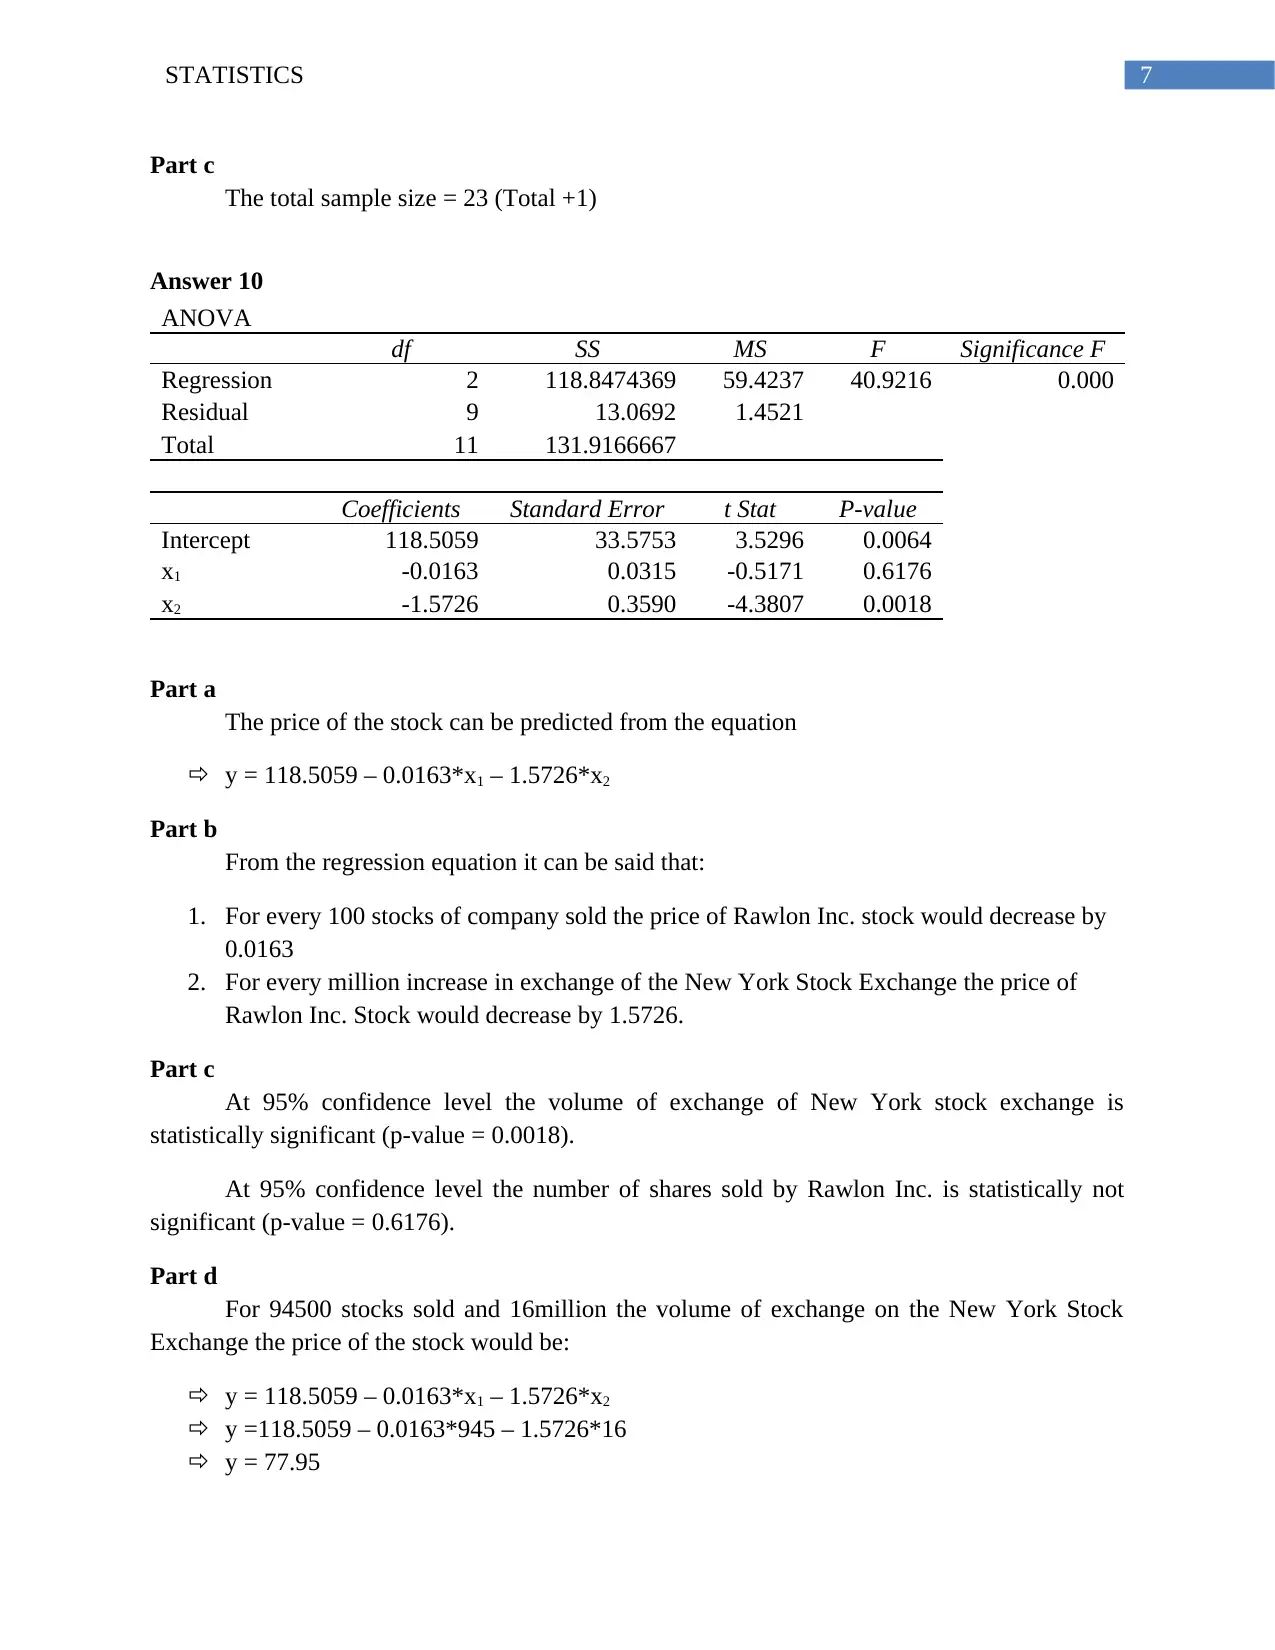
This document presents a comprehensive solution to a statistics homework assignment, addressing a range of statistical concepts and techniques. The assignment includes detailed answers to problems involving Analysis of Variance (ANOVA), regression analysis, and hypothesis testing. The solutions provide step-by-step explanations, including calculations of F-values, p-values, degrees of freedom, and coefficients of regression. The document also covers interpretations of statistical significance, null and alternative hypotheses, and the application of these concepts to real-world scenarios, such as analyzing sales trends and comparing the performance of different brands or stores. The document provides a complete and thorough analysis of the given statistical problems.

Running head: STATISTICS
Statistics
Name of the student
Name of the university
Author’s note
Statistics
Name of the student
Name of the university
Author’s note
Paraphrase This Document
Need a fresh take? Get an instant paraphrase of this document with our AI Paraphraser

1STATISTICS
Table of Contents
Answer 1..........................................................................................................................................2
Part a............................................................................................................................................2
Part b............................................................................................................................................2
Part c............................................................................................................................................2
Answer 2..........................................................................................................................................2
Answer 3..........................................................................................................................................3
Part a............................................................................................................................................3
Part b............................................................................................................................................3
Answer 4..........................................................................................................................................4
Answer 5..........................................................................................................................................4
Answer 6..........................................................................................................................................4
Part a............................................................................................................................................4
Part b............................................................................................................................................4
Part c............................................................................................................................................5
Answer 7..........................................................................................................................................5
Answer 8..........................................................................................................................................5
Part a............................................................................................................................................5
Part b............................................................................................................................................6
Part c............................................................................................................................................6
Answer 9..........................................................................................................................................6
Part a............................................................................................................................................6
Part b............................................................................................................................................6
Part c............................................................................................................................................7
Answer 10........................................................................................................................................7
Part a............................................................................................................................................7
Part b............................................................................................................................................7
Part c............................................................................................................................................7
Part d............................................................................................................................................7

2STATISTICS
Answer 1
Part a
Table 1: ANOVA table
Source of
Variation
Sum of squares Degrees of
Freedom
Mean Square F
Between
treatments
90 3 ¿ 90
3 =30 ¿ 30
6 =5
Within
treatments
(Error)
120 20 ¿ 120
20 =6
Total = 90 + 120
= 210
= 3+20
=23
The p-value for the F-value at 3,20 degrees of freedom is 0.0095. At 0.01 level of
significance since p-value is less hence we reject the NULL hypothesis.
Part b
There are 4 groups in the above problem.
Number of Groups = degrees of freedom (between treatment) + 1 = 3+1 = 4
Part c
There are 21 observations in the above problem.
Number of observations = degrees of freedom (within treatment) + 1=20+1 = 21
Answer 2
Table 2: Coefficients of Regression Equation
Coefficients Standard Error t Stat P-value
Intercept 136 13.76 9.881 0.000
Year (t) 39.18 2.22 17.664 0.000
From table 2 the trend of the number of units sold by the auto manufacturer can be written as:
Number of Units sold (000s) = 136 + 39.18*Year
Thus, in the 11th year the number of units sold = 136+39.18*11 = 566.98 ≈ 567 (000s)
⊘ This is a preview!⊘
Do you want full access?
Subscribe today to unlock all pages.

Trusted by 1+ million students worldwide

3STATISTICS
0 2 4 6 8 10 12
0
100
200
300
400
500
600
f(x) = 39.1818181818182 x + 136
R² = 0.975002230693999
Number of Cars Sold (in 1000s units)
Year (t)
Number of Cars Sold (000s)
Figure 1: Trend of the number of units sold by major auto manufacturer
The trend shows that the number of units that can be sold by the auto manufacturer = 567000
Answer 3
Part a
ANOVA
df SS MS F Significance F
Regression 1 59.89145 59.89145 29.62415 0.002842
Residual 5 10.10855 2.021711
Total 6 70
At 0.01 level of significance there is statistically significant relationship between price and the
number of flash drives sold, p-value =0.0028.
Part b
Coefficients Standard Error t Stat P-value
Intercept 40.033 1.070 37.4309 0.0000
Units sold (y) -1.174 0.216 -5.4428 0.0028
At 0.01 level of significance there is statistically significant relationship between price and the
number of flash drives sold, p-value =0.0028.
Paraphrase This Document
Need a fresh take? Get an instant paraphrase of this document with our AI Paraphraser

4STATISTICS
Answer 4
Source of
Variation
Sum of Squares Degrees of
Freedom
Mean Square F
Between
treatments
= 4*800 = 3200 = 5 – 1 = 4 800.00 ¿ 800
569.23 =1.41
Within
treatments
(Error)
= 10600 – 3200
= 7400
= 14 – 1 = 13 ¿ 7400
13 =569.23
Total 10600 17
Answer 5
ANOVA
Source of Variation SS df MS F P-value F crit
Between Groups 324 2 162 40.500 0.000 4.256
Within Groups 36 9 4
Total 360 11
Null Hypothesis: The average sales of the three stores are equal
Alternate Hypothesis: The average sales of at least one of the stores is different
At 0.05 level of significance we reject the Null Hypothesis, p-value (0.000). Thus, the
sales of the three stores are not similar, there are significant differences in the average sales of
the three stores.
Answer 6
Part a
Null Hypothesis: The average sales of the three boxes are equal
Alternate Hypothesis: The average sales of at least one of the boxes is different
Part b
ANOVA
Source of Variation SS df MS F P-value F crit
Between Groups 24467.2 2 12233.6000 53.7111 0.000 3.8853
Within Groups 2733.2 12 227.7667
Total 27200.4 14

5STATISTICS
Part c
At 0.05 level of significance we reject the Null Hypothesis, p-value (0.000). Thus, the
sales of the three boxes are not similar.
Answer 7
Brand A Brand B Brand C
Average Mileage 37 38 33
Sample Variance 3 4 2
Count 10 10 10
The total average = 37*10+38*10+33*10 = 370+380+330 = 1080
The total average mileage = 1080
30 =36
Thus SSBetween Groups = 10*(37 – 36)2+10*(38 – 36)2+10*(33 – 36)2 = 140
SSError = 10*3+10*4+10*2 = 90
ANOVA
Source of Variation SS df MS F
Between Groups 140 2 ¿ 140
2 =70 ¿ 70
3.33 =21.02
Within Groups 90 =29 – 2 = 27 ¿ 90
27 =3.33
Total 210 29
F-crit from f-table with 2, 29 at 0.05 level of significance = 3.33
Since, F-value > F-crit, hence at 0.05 level of significance there is sufficient evidence to
reject Null Hypothesis. Thus, there is statistically significant differences in the mean mileage of
the tyres.
Answer 8
Part a
Day Tips Simple Moving average
1 18
2 22 19
3 17 19
4 18 21
⊘ This is a preview!⊘
Do you want full access?
Subscribe today to unlock all pages.

Trusted by 1+ million students worldwide

6STATISTICS
5 28 22
6 20 20
7 12
Part b
Days (x) Forecast (Y) Y' Y-Y' (Y-Y')2
1 19 19.2 -0.2 0.04
2 19 19.7 -0.7 0.49
3 21 20.2 0.8 0.64
4 22 20.7 1.3 1.69
5 20 21.2 -1.2 1.44
0.00 0.86
The mean square error of the forecast is 0.86
Part c
The mean absolute deviation of the forecast is 0.00
Answer 9
Part a
Source of
Variation
Degrees of
Freedom
Sum of Squares Mean Square F
Regression 4 283940.60 70985.15 (MSS) 2.055
Error 18 621735.14 34540.84
Total 22 905675.74 (TSS)
The coefficient of determination = MSS
TSS = 70985.15
905675.74 =0.0784
From the regression model it can be said that 7.84% of the variability in sales of “Very
Fresh Juice Company” can be predicted from the independent variables – “price per unit”,
“competitor's price”, “advertising” and “type of container.”
Part b
The corresponding p-value for F is 0.129. At 0.05 level of significance we do not have
sufficient evidence to reject Null Hypothesis. Hence, the model is statistically not significant.
Significance value can be found in MS-EXCEL by =F.DIST.RT(2.055,4,18)
Paraphrase This Document
Need a fresh take? Get an instant paraphrase of this document with our AI Paraphraser

7STATISTICS
Part c
The total sample size = 23 (Total +1)
Answer 10
ANOVA
df SS MS F Significance F
Regression 2 118.8474369 59.4237 40.9216 0.000
Residual 9 13.0692 1.4521
Total 11 131.9166667
Coefficients Standard Error t Stat P-value
Intercept 118.5059 33.5753 3.5296 0.0064
x1 -0.0163 0.0315 -0.5171 0.6176
x2 -1.5726 0.3590 -4.3807 0.0018
Part a
The price of the stock can be predicted from the equation
y = 118.5059 – 0.0163*x1 – 1.5726*x2
Part b
From the regression equation it can be said that:
1. For every 100 stocks of company sold the price of Rawlon Inc. stock would decrease by
0.0163
2. For every million increase in exchange of the New York Stock Exchange the price of
Rawlon Inc. Stock would decrease by 1.5726.
Part c
At 95% confidence level the volume of exchange of New York stock exchange is
statistically significant (p-value = 0.0018).
At 95% confidence level the number of shares sold by Rawlon Inc. is statistically not
significant (p-value = 0.6176).
Part d
For 94500 stocks sold and 16million the volume of exchange on the New York Stock
Exchange the price of the stock would be:
y = 118.5059 – 0.0163*x1 – 1.5726*x2
y =118.5059 – 0.0163*945 – 1.5726*16
y = 77.95
Part c
The total sample size = 23 (Total +1)
Answer 10
ANOVA
df SS MS F Significance F
Regression 2 118.8474369 59.4237 40.9216 0.000
Residual 9 13.0692 1.4521
Total 11 131.9166667
Coefficients Standard Error t Stat P-value
Intercept 118.5059 33.5753 3.5296 0.0064
x1 -0.0163 0.0315 -0.5171 0.6176
x2 -1.5726 0.3590 -4.3807 0.0018
Part a
The price of the stock can be predicted from the equation
y = 118.5059 – 0.0163*x1 – 1.5726*x2
Part b
From the regression equation it can be said that:
1. For every 100 stocks of company sold the price of Rawlon Inc. stock would decrease by
0.0163
2. For every million increase in exchange of the New York Stock Exchange the price of
Rawlon Inc. Stock would decrease by 1.5726.
Part c
At 95% confidence level the volume of exchange of New York stock exchange is
statistically significant (p-value = 0.0018).
At 95% confidence level the number of shares sold by Rawlon Inc. is statistically not
significant (p-value = 0.6176).
Part d
For 94500 stocks sold and 16million the volume of exchange on the New York Stock
Exchange the price of the stock would be:
y = 118.5059 – 0.0163*x1 – 1.5726*x2
y =118.5059 – 0.0163*945 – 1.5726*16
y = 77.95

8STATISTICS
⊘ This is a preview!⊘
Do you want full access?
Subscribe today to unlock all pages.

Trusted by 1+ million students worldwide
1 out of 9
Related Documents

Your All-in-One AI-Powered Toolkit for Academic Success.
+13062052269
info@desklib.com
Available 24*7 on WhatsApp / Email
Unlock your academic potential
Copyright © 2020–2025 A2Z Services. All Rights Reserved. Developed and managed by ZUCOL.