Statistics and Probability Assignment - Analysis and Solutions
VerifiedAdded on 2023/01/06
|3
|429
|73
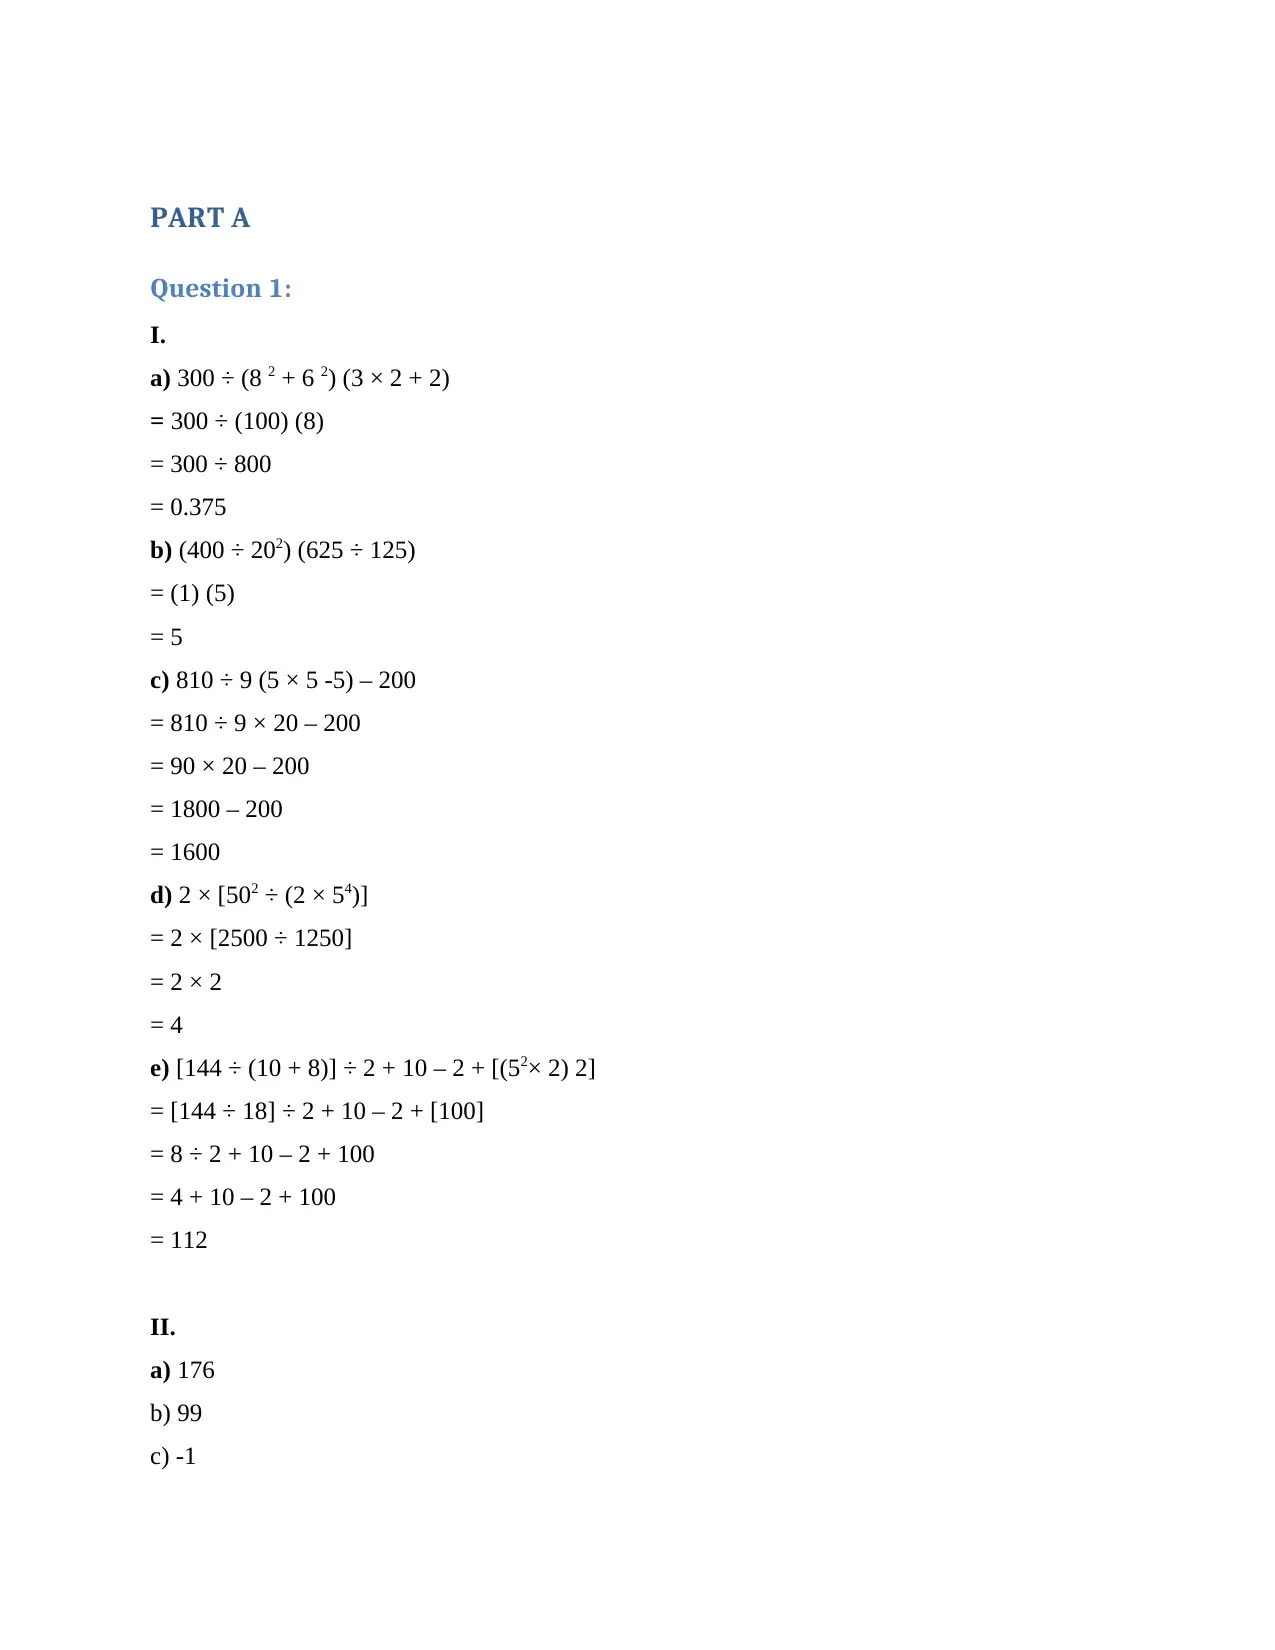
Homework Assignment
AI Summary
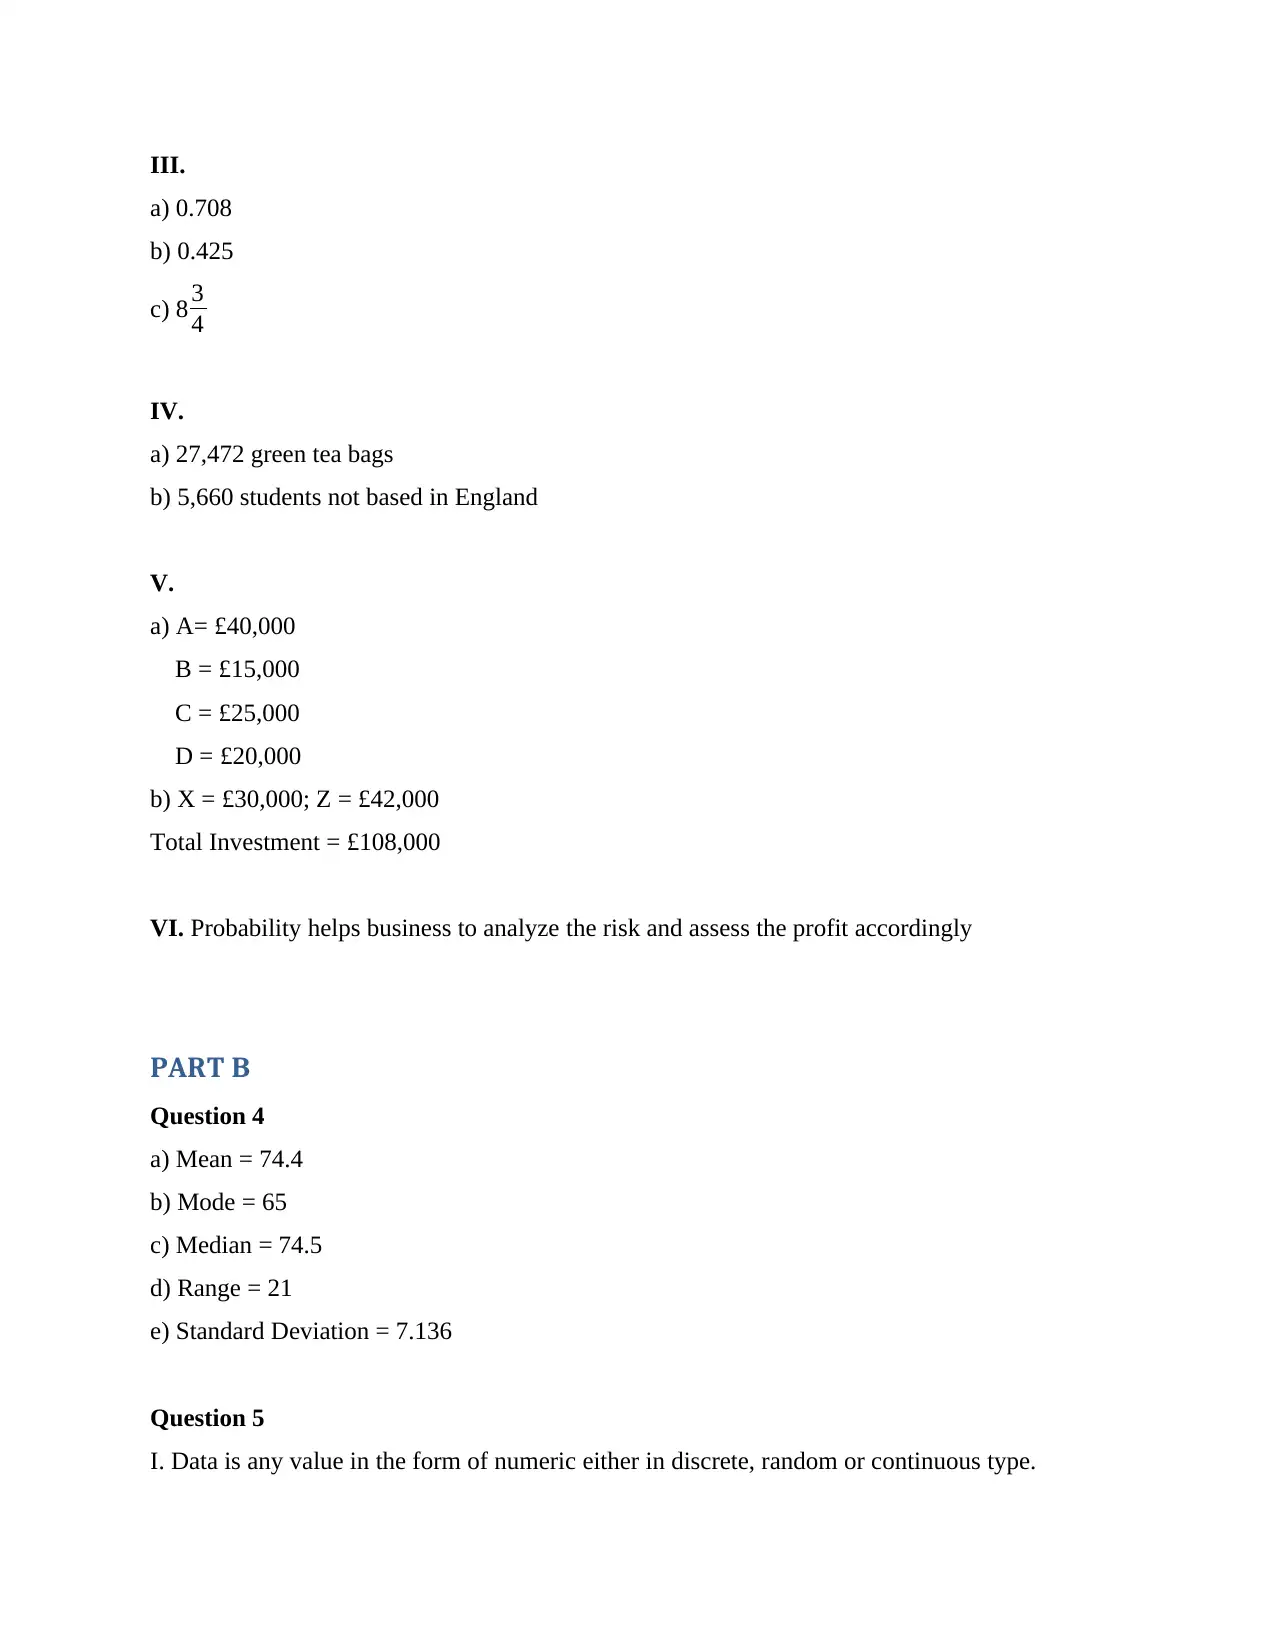
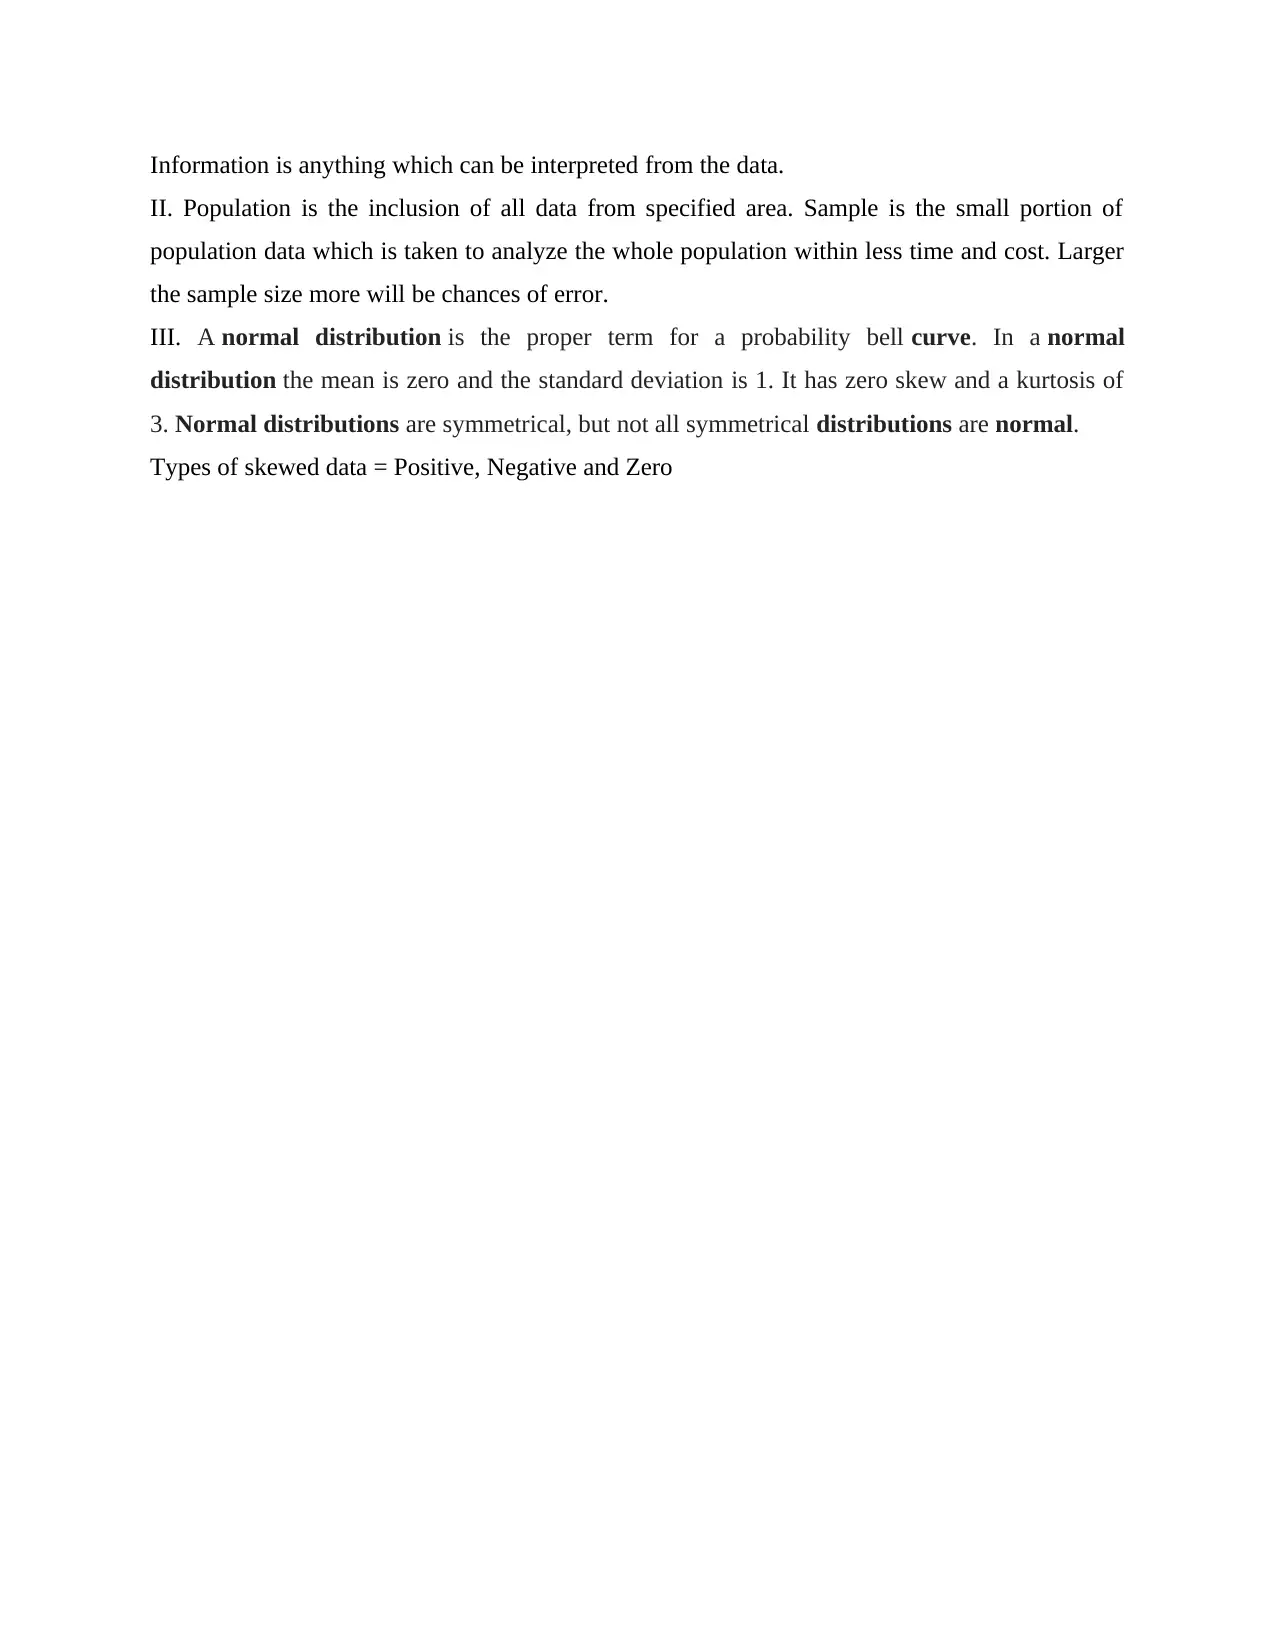
This document presents a comprehensive solution to a statistics and probability assignment. The solution includes detailed calculations and explanations for various statistical concepts. Part A covers calculations involving basic arithmetic operations, and probability, answering questions on calculating values. Part B focuses on descriptive statistics, providing calculations for the mean, mode, median, range, and standard deviation. The assignment also explores fundamental concepts such as data types, population vs. sample, and the normal distribution. The solutions are presented clearly, making it easy to understand the application of statistical methods and the interpretation of results. The assignment offers a practical guide to solving common statistical problems.
1 out of 3
Related Documents


Your All-in-One AI-Powered Toolkit for Academic Success.
+13062052269
info@desklib.com
Available 24*7 on WhatsApp / Email
![[object Object]](/_next/static/media/star-bottom.7253800d.svg)
Copyright © 2020–2026 A2Z Services. All Rights Reserved. Developed and managed by ZUCOL.